


Poor eating habits are one of the key drivers of overconsumption of energy, weight gain and obesity. Australians consume inadequate amounts of fruit, vegetables and whole grains and, on average, get about 35 % of their energy from energy-dense, nutrient-poor discretionary food and beverage items( Reference Rangan, Schindeler and Hector 1 , 2 ). As a result, improving the food supply to support healthy food choices has been identified as a priority for Australian health promotion efforts and internationally( Reference Swinburn, Sacks and Hall 3 , 4 ).
About 60 % of Australian food retail expenditure is in the supermarket, indicating its potential as a key setting to influence the food supply( 5 ). Previously, supermarket purchases have been found to relate to dietary intakes, particularly at the household level( Reference Ransley, Donnelly and Botham 6 , Reference Ransley, Donnelly and Khara 7 ). For example, when compared with 4 d of weighed food record data, 1 month of shopping purchase information produced reasonable estimates about energy and fat intake( Reference Ransley, Donnelly and Khara 7 ). Many nutrition interventions promoting the purchase of healthier foods have been trialled in the supermarket setting. Although the evidence is equivocal for the effectiveness of supermarket interventions focused on point-of-purchase dietary education and information provision( Reference Escaron, Meinen and Nitzke 8 , Reference van 't Riet 9 ), the potential for success using an innovative approach in this setting has recently been revisited( Reference Payne, Niculescu and Just 10 ).
Moreover, the large amount of supermarket purchase data collected as part of customer loyalty schemes over the past few decades is an emerging area of interest( Reference Tin, Mhurchu and Bullen 11 ). These data have potential to provide detailed, objective and prospective information about the household food supply( Reference Tin, Mhurchu and Bullen 11 ). Food purchase data have been used to estimate individual nutrient intakes( Reference Ransley, Donnelly and Botham 6 ), to describe food category purchases of different households( Reference Cullen, Baranowski and Watson 12 ) and to measure the impact of nutrition interventions( Reference Ni Mhurchu, Blakely and Jiang 13 , Reference Ball, McNaughton and Le 14 ).
Shopping docket data could also be used to initiate and support efforts to improve the household food supply, providing shoppers with information about the healthiness of their purchases over time. However, a key issue is translating these ‘big data’ into a meaningful metric, which can potentially influence purchase behaviour. Although most supermarket initiatives assist shoppers by providing a means to compare products within a food category( Reference Sutherland, Kaley and Fischer 15 ), looking at the whole pattern of dietary purchases may prove to be more valuable( Reference Hu 16 ).
In light of the increased focus towards assessing the whole diet, a large number of diet quality indices have been designed to examine how closely dietary patterns align with evidence-based national dietary guidelines. These have mostly been applied to intake data obtained via traditional assessment methods( Reference Golley, Hendrie and McNaughton 17 , Reference Aljadani, Patterson and Sibbritt 18 ). Traditional dietary assessment methods have limitations; namely, they are resource intensive and subject to biases such as misreporting( Reference Westerterp and Goris 19 ). The use of food purchase information may overcome some of these issues. In addition, it is possible that through loyalty schemes shoppers could opt into nutrition education campaigns and be rewarded for healthier purchasing habits. However, a system of rating the healthfulness of a trolley of supermarket purchases, using existing supermarket big data systems, is necessary.
The aim of this study was to develop an index to estimate population diet quality using food purchase data. The Healthy Trolley Index (HETI) will estimate compliance with the Australian Guide to Healthy Eating (AGHE) that includes five core food groups of grains and cereals, dairy foods, meat and alternatives, fruit and vegetables and recommends limited amounts of all other discretionary food and beverages. However, it will use supermarket purchase data to estimate the quality of the food supply at the household level. As part of this development, associations between shopping trolley quality and the demographic characteristics and weight status of the shopper responsible for the month of food purchases will be explored.
Methods
Food purchase data detailing all purchases from a major supermarket chain in Australia were obtained over a period of 1 month (starting late April 2014) for a sample of 964 people through a customer loyalty rewards programme. Shoppers used a loyalty rewards card, allowing identification of the shopper, and some limited demographic variables. These data were collected as part of the baseline data for a healthy lifestyle worksite intervention conducted with staff from the corporate office of a large retail chain. Ethics approval for the study was given by CSIRO Animal Food and Health Sciences Human Research Low Risk Review Panel (approval number LR14/01).
Demographic and anthropometric data including age, sex and self-reported height and weight were collected for the majority of participants. BMI was calculated, and individuals with extreme values were excluded (n 41). This included those who were underweight (BMI<18·5 kg/m2) or who reported a BMI>100 kg/m2. BMI was categorised into three weight status groups consistent with the World Health Organization( 20 ) cut-offs. Age was categorised into three groups consistent with those used in the latest Australian Health Survey (19–30, 31–50 and 51–70 years).
Measures
Food purchase data
The following information describing purchases was available in an electronic format: customer ID, transaction date, category description, item description, basket quantity (the number of items) and transaction amount.
Category description referred to major groupings into which the supermarket chain assigned products, largely based on the product’s location within the store (see Table 1 for examples). There were a total of 184 category descriptions, of which 108 referred to food and beverage products included in this analysis (seventy six non-food categories were excluded). The supermarket categorisation largely follows the displays of food in store. For example, all chilled yoghurts and desserts are in the same supermarket category. The item description provided more detailed information about the product, such as brand, package size and flavour variant. Transaction amount listed the cost of the product, and basket quantity listed the number of products purchased or the weight of fresh produce items.
Table 1 Description of the Healthy Trolley Index (HETI) components and scoring criteria

AGHE, Australian Guide to Healthy Eating.
* Serves is based on the recommendations in the AGHE, calculated as the average recomendation for men and women aged 19–50 years.
† HETI benchmark represents serves of food group as a proportion of total serves of food recommended (21·5 serves); that is: average recommendation/21·5×100.
Development of the Healthy Trolley Index scores
The AGHE provides dietary recommendations of intakes (number of servings and serve sizes) for core foods to ensure most Australians meet their nutrient requirements for health and well-being. The guidelines also include an allowance for non-core, discretionary foods, which are non-essential, as they are high in fat, salt and sugar but included to increase variety and enjoyment( 21 ). The HETI was developed to estimate compliance of monthly food purchases to these dietary recommendations. Each category description group, using the supermarket coding categories, was assigned to one of the five core food groups described in the AGHE (fruit, vegetables, grains, meat and dairy foods; see Table 1). The category descriptions considered to include discretionary foods were assigned to seven subgroups within the HETI discretionary food group (Table 1). Some category descriptions contained a mix of both core and non-core foods, and were assigned based on the most predominant items (e.g. chilled desserts contained 80 % core dairy foods and 20 % cream/mousse desserts, and thus they were assigned to dairy foods). Assigning category descriptions to core and non-core food groups was initially performed by two researchers, with another two researchers resolving any discrepancies.
There were some category description groups that did not clearly fit any AGHE food group or have a recommended intake, such as core food mixed dishes, and tea and coffee. An allowance for unsaturated fats is included as part of the core foods in the AGHE, but saturated fats are part of the discretionary food group. The category description of fats and oils included a mix of ‘healthy’ and ‘unhealthy’ fats. As these category descriptions did not have a clear position within the dietary recommendations and contributed a small proportion to total food expenditure, they were excluded in the development of the HETI scoring system. However, mixed dishes that were considered non-core contributed a greater proportion to expenditure and were included in the analysis.
Monthly expenditure per HETI food group was summed and presented as a percentage of total monthly food expenditure per shopper (i.e. expenditure per food group/monthly food expenditure×100). A proportion of expenditure was estimated for each of the five core food groups, and discretionary foods. This approach of using proportions to estimate the healthfulness of the household food supply removes the need to account for household membership in the scoring system.
To compare expenditure patterns with recommended dietary patterns, the AGHE recommendations were presented as proportions. Given that the majority of participants in this study were aged 19–50 years, we used the average of the male and female food group recommendations for this age group as the benchmark. Within the AGHE, a range of recommended serves for discretionary foods is provided, which is dependent on the individual’s current weight status, stature and physical activity level( 21 ). To allow flexibility and the greatest opportunity to score well, we used the upper limit of this range as the benchmark, which was 2·75 serves (Table 1).
To generate a HETI score, the proportion of expenditure was compared with the benchmark for each food group, and a proportion score out of 10 calculated. The HETI benchmark represents serves of the food group as a proportion of total serves of food recommended (21·5 serves); that is: average recommendation/21·5×100. If the proportion of monthly expenditure per food group was equal to or greater than the recommended proportion, a maximum score of 10 was assigned. For expenditure below the benchmark, a score was assigned proportionally. For discretionary foods, participants received a maximum score if expenditure was less than the recommended proportion, and diminished proportionally as their percentage of expenditure increased beyond the recommendation (Table 1).
The total HETI score gave equal weighting to each food group, by summing all six food group scores (total out of 60) and converting to a score out of 100 (by multiplying by 5/3). Higher HETI scores indicated greater compliance with dietary recommendations.
Statistical analyses
Participants who spent <$AU100 on food over the 1-month period were excluded (n 87), as this was below the average food expenditure of the lowest income quintile in Australia( 22 ), and therefore deemed unlikely to represent usual household food supply.
Transaction date was used to calculate the number of shopping days per participant over 1 month, and tertiles were created to examine low-, medium- and high-frequency shoppers.
Mean expenditure and HETI scores per food group and overall for the month were calculated. Quintiles of HETI score were created (Q1 – lowest compliance to Q5 – highest compliance), and associations between HETI quintile, age, sex (available for 512/836 participants), body weight status, frequency of shopping (Q1 – lowest frequency to Q3 – highest frequency) and proportion of expenditure were explored. We also examined how expenditure on various food groups differed by HETI score, and by demographic characteristics and weight status.
Estimates are presented as means and standard deviations. Differences between HETI quintiles were examined using one-way ANOVA with Bonferroni’s post hoc tests (significance level P value<0·01). Differences in shopping frequency by weight status were compared using χ 2 test. All data coding and analysis was undertaken using SPSS statistical software package version 22.0 (IBM Corporation)( 23 ).
Results
Shopping data of 1 month were available for 836 adults aged 19–65 years, most of them aged between 31 and 50 years (mean 37·6 (sd 9·3)). Of the participants who reported sex, 56 % were female. The mean BMI of the sample was 27·9 (sd 6·6) kg/m2, with the majority of participants being overweight (35 %) or obese (28 %), and living with a partner (40 %) or family (45 %). Three BMI values calculated from reported height and weight were >50 kg/m2, and while outside the expected range these individuals did not skew the data and were included. On average, participants spent $AU669 at the supermarket over the month, 77 % of which was on food (mean $AU517 (sd 354)).
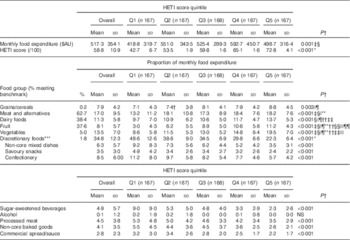
Participants spent the greatest proportion of their monthly food expenditure on discretionary foods (34·8 %), followed by meat and alternatives (17·0 %), vegetables (13·5 %) and dairy foods (11·3 %) (Table 2). Within the discretionary foods category, participants spent the greatest proportion on confectionary (8·5 %) and non-core mixed dishes (6·3 %), and about 4–5 % each on sugar-sweetened beverages, processed meat and baked goods.
Table 2 Total monthly expenditure and mean proportion of food expenditure per food group by Healthy Trolley Index (HETI) score quintile (Q) (Mean values and standard deviations; n 836)
* All quintiles are significantly different.
† Significance of the differences between quintiles were assessed using ANOVA with Bonferroni’s post hoc adjustments. Significance of pair-wise comparisons is denoted with symbols.
‡ Indicates that the difference between Q1 and Q2 is significant.
§ Q1 v. Q4.
|| Q1 v. Q5.
¶ Q2 v. Q5.
** Q1 v. Q3.
†† Q3 v. Q5.
‡‡ Q4 v. Q5.
§§ Q2 v. Q3.
|||| Q2 v. Q4.
¶¶ Q3 v. Q4.
*** The pair-wise comparisons for subgroups of discretionary foods are not reported.
The average HETI score was 58·8 (sd 10·9) (range: 22·6–93·1/out of 100). The percentage of participants meeting the benchmark (i.e. scoring 10 out of 10) for a food group was highest for meat and alternatives (62·7 %) and lowest for grains (0·2 % of the sample). In addition, very few people met the benchmark for vegetables (5·0 %) and discretionary foods (1·8 %).
Examination of expenditure by HETI quintiles shows a stepwise decrease in expenditure on discretionary foods by increasing HETI score quintile: that is, as overall shopping trolley quality increased, expenditure on discretionary foods decreased (P<0·001). The opposite was true for fruit and vegetables: as overall trolley quality increased, so did expenditure on fruit and vegetables. Although significant differences were seen across quintiles for all other food groups, the pattern of expenditure across all quintiles was not always consistent. For example, participants in the lowest quintile spent a q1significantly lower proportion of their monthly expenditure on grains and dairy foods than those in the highest quintile, and significantly less on meat than all other groups (P<0·001; Table 2).
More detailed sub-group analysis showed that higher HETI scores were associated with a greater proportion of expenditure on rice, seafood, non-meat protein sources (nuts, tofu, eggs), cheese, chilled desserts (mainly yoghurt), fresh fruit, dried fruit, frozen fruit, fresh vegetables, canned vegetables and salad leaves (data not shown). In contrast, lower scores were associated with canned, frozen and refrigerated convenience meals (mainly frozen pizzas, pies, garlic breads, chicken nuggets, television dinners, pre-prepared pasta dishes and canned casseroles), instant noodles, snacks (mainly potato and maize chips), chocolate bars, energy/sports drinks, soft drinks, juices, biscuits and cakes and meal bases. Interestingly, the lowest HETI quintile spent a significantly greater proportion on frozen vegetables, which largely comprised processed potato products (e.g. oven fries).
Table 3 shows the proportion of expenditure on food groups by various demographic variables. Overall HETI scores were significantly higher in male than in female participants (60·0 v. 57·6; P≤0·01) and significantly lower in obese compared with normal-weight and overweight participants (55·9 v. 60·3 and 59·9; P≤0·001). Male participants spent a greater proportion of their expenditure on grains and dairy foods and significantly less on discretionary foods. There was a stepwise increase in expenditure on discretionary foods with increasing weight status, with obese participants spending more on these foods than other weight status groups. Although obese participants spent significantly more on discretionary foods (38·3 v. 32·7; P≤0·001), they spent significantly less on fruit (7·2 v. 8·8; P≤0·01) and vegetables compared with normal-weight participants (12·1 v. 14·8; P≤0·001). In particular, obese participants spent a greater proportion on frozen convenience foods, chocolate bars, soft drinks, processed deli meats, biscuits and frozen vegetables (data not shown).
Table 3 Healthy Trolley Index (HETI) score and mean percentage of food expenditure per Healthy Eating Index food groups by sex, age group, weight status, frequency of shopping and living arrangements (Numbers; mean values and standard deviations)

* All groups are significantly different.
† Significance of the differences between quintiles were assessed using ANOVA with Bonferroni’s post hoc adjustments. Significance of pair-wise comparisons is denoted with symbols (P<0·01).
‡ Difference between 19–30 and 31–50 is significant.
§ Healthy weight v. overweight.
|| Healthy weight v. obese.
¶ Low v. high frequency.
** Medium v. high frequency.
†† Alone v. partner.
‡‡ Alone v. family.
§§ Partner v. family.
|||| Family v. other.
Young adults (19–30 years) spent a greater proportion of their monthly expenditure on meat and alternatives (18·3 v. 16·3; P≤0·01) and vegetables (15·0 v. 12·9; P≤0·001) compared with 31–50-year-olds. However, there were no significant differences in overall HETI scores between age groups.
An increased frequency of shopping occasions within the month was associated with a greater proportion spent on discretionary foods. Those participants in the highest tertile of shopping occasions spent significantly more on discretionary foods than those who shopped less often. Although mean BMI did not differ by shopping frequency, the proportions of obese v. normal weight in the high-frequency shoppers was significantly greater (35 v. 20 %; χ 2=0·001). There were no differences in the frequency of shopping by age or sex. Those who lived alone had significantly lower HETI scores compared with those living with a spouse/partner (55·8 v. 59·9; P<0·01). They spent less on grains/cereals and meat and alternatives compared with couples and families. Couples spent significantly less on discretionary items. Those living with family spent significantly less on vegetables compared with both those living alone or with a partner.
Discussion
The HETI has been developed as a tool to assess the healthiness of food purchases from a supermarket over 1 month. The index has been applied to electronic supermarket docket data in the format it is collected by the supermarket. It was deemed important to use the existing supermarket coding system, as it would be unfeasible to code each individual food, assign all the new foods as they come to market or to expect supermarket chains to redesign their system to fit with the AGHE categories. The HETI was developed to estimate compliance with the Australian nutrition recommendations. Thus, we found that higher HETI scores were related to greater expenditure on healthy foods including fruit, vegetables, dairy foods, meat and alternatives and grains and cereals, and lower expenditure on energy-dense, nutrient-poor discretionary foods. Interestingly, these findings are consistent with those of Hollywood et al.( Reference Hollywood, Cuskelly and O’Brien 24 ) who found that shoppers perceived a healthy shop to include fruit, vegetables, seafood, dairy foods, eggs, juice and whole grain products, whereas an unhealthy shop was characterised by baked goods, high-fat snack foods, soft drinks, frozen and processed items and convenience products.
The comparison between expenditure and nutrition recommendations was based on proportions, and thus the proportion of total monthly expenditure per food group was compared with the recommended intake as a proportion of recommended total serves of food. Although there are limitations to this method, it does give an indication of where the balance of the food in the diet should be coming from. The suitability of using expenditure as the method for calculating food group proportions was reinforced when basket quantity counts of purchased items yielded similar HETI scores for shoppers. National data on food intakes are also consistent with the direction of our findings. For example, it is recommended that 26 % of our total serves of food comes from vegetables; however, participants only spent 13 % of their monthly expenditure on vegetables, and only 5 % spent an adequate amount to meet the recommendation. Similarly, 40 % of participants spent an adequate amount to meet the fruit recommendation. These results are supported by recent national intake data using 24-h recall, which suggest that 48 % of Australian adults report meeting the fruit recommendation and 8 % the vegetable recommendation( 2 ). Similar findings between methods have also been reported for discretionary foods. It has been estimated that 36 % of Australian adults’ energy intake comes from discretionary foods( Reference Rangan, Schindeler and Hector 1 , 2 ), and we found that almost 35 % of monthly food expenditure was spent on these energy-dense, nutrient-poor foods. It is encouraging that the current study using food expenditure data to capture the household food supply found similar percentages to those from Australian population surveys using traditional 24-h recall methods of dietary assessment. This offers some validity to using supermarket purchase data to estimate the HETI as a representation of household food supply.
Fruit, vegetables and discretionary foods held the strongest relationship with HETI score; that is, expenditure on fruit and vegetables increased in a stepwise manner with increasing quintile of shopping quality, whereas expenditure on discretionary foods decreased. This pattern of expenditure suggests that these households’ food supply may not support healthy dietary choices. Indeed, we found that lower expenditure on fresh fruit and vegetables and higher expenditure on energy-dense, nutrient-poor discretionary foods characterised the supermarket purchases of obese individuals. Although all weight status groups spent more than one-third of their monthly expenditure on discretionary foods, obese individuals spent 38 % – significantly more than other groups – and as a result had a lower-quality purchase pattern overall than normal-weight people in this sample. The prevalence of overweight and obesity in this sample population is consistent with the Australian population in 2011–2012( 25 ).
Previous research suggests that supermarket purchasing patterns are a proxy for food availability in the home( Reference Moore, Roux and Nettleton 26 , Reference French, Shimotsu and Wall 27 ), and that food availability has been associated with weight status( Reference Ransley, Donnelly and Botham 6 , Reference Morland, Diez Roux and Wing 28 ). Interestingly, however, relationships between higher energy intake, poor diet quality and weight status are not always supported in studies using traditional, self-reported methods of dietary assessment. Many have suggested that this is a consequence of misreporting and social biases, a phenomenon generally characterised by over-reporting of healthy foods and under-reporting of unhealthy foods, which is particularly common in some subgroups of the population such as women and obese adults( Reference Rangan, Allman-Farinelli and Donohoe 29 , 30 ). Using food purchase data may overcome some of these issues( Reference Gibson 31 ), as it is objective and prospective, and therefore does not rely on the usual issues associated with an individual’s memory to recall foods consumed. Female participants often report better-quality dietary patterns than male participants( Reference McNaughton, Ball and Crawford 32 , Reference Zarrin, Ibiebele and Marks 33 ); however, we know that social desirability biases tend to vary by sex using traditional methodology for dietary data collection( 2 , 30 , Reference Hebert, Ma and Clemow 34 ). We found that male participants spent less on discretionary foods, and more on dairy foods and grains, resulting in a trend towards male shoppers obtaining higher HETI scores. As the HETI is free from reporting biases associated with these traditional methods, the findings in the present study indicate that perhaps the diets of female participants may not be as healthy as previously reported, although we acknowledge that the purchases may be for other household members such as children.
Participants who shopped more frequently tended to spend more over the month, and spend a greater proportion of this on discretionary foods. These participants were also more likely to be obese. The shopping environment, layout and positioning of foods within the supermarket means that each time consumers visit the store they battle marketing strategies to increase impulse purchasing and encourage the purchase of unhealthy foods( Reference Nederkoorn, Guerrieri and Havermans 35 ). In fact, discretionary foods and beverages are most likely to be purchased as a result of these tactics( Reference Nederkoorn, Guerrieri and Havermans 35 – Reference Harris, Pomeranz and Lobstein 37 ). Restructuring the food environment, which shapes obesity, is one important part of the multidimensional approach needed to address obesity; however, commitment is required from all sectors including retailers, if the full potential of this is to be met( 38 ).
There are a number of strengths and limitations of this study, which need consideration. First, we applied the shopping quality scoring system to 1 month’s worth of purchase data received directly from the supermarket. Data of 1 month were considered reasonable to represent ‘usual’ food purchases and capture some items bought infrequently. However, using data for a longer time period may better reflect habitual purchase habits. In light of translation and up-scaling this approach, we used the predefined category descriptions provided in the data set for coding foods into food groups consistent with the AGHE. However, there were some category descriptions groupings that included both healthy and less healthy versions of foods that would usually be included in the discretionary food group. In these cases, we allocated the whole category description food group based on the majority of food items within that group; for example the HETI is unable to distinguish between breakfast cereals, placing all varieties into an AGHE core food group, positively affecting the HETI score. In addition, this approach did not allow all aspects of the AGHE to be included in the HETI scoring system. For example, in Australia, there are recommendations to eat a variety of foods and that dairy foods are preferably low fat, and grains are mostly whole grain; however, our current approach did not distinguish foods at this level of detail. Further refinement is possible using the food item description; however, collaboration with supermarkets would be required to build this coding into their computer systems before being up-scaled and applied to a large data set. In addition, our scoring system did not penalise for excessive consumption. It has been recommended when designing a diet quality index for application at individual level, to apply scoring penalties for overconsumption of core foods that could have detrimental health impacts when eaten in excess( Reference English, MacInnis and Hodge 39 – Reference Sesink, Termont and Kleibeuker 41 ). The HETI expressed purchase patterns as a proportion based on expenditure, which may have influenced results differently for distinct foods groups. For example, foods within the grains group, such as rice or pasta, may be consumed daily but purchased in larger quantities. Thus, expenditure per month may not reflect consumption as well as it does for other foods. We found that compliance with this food group was very low, but this finding is supported by dietary intake data( 42 ). Nonetheless, future refinement of the index may improve the sensitivity of the scoring system across all food groups.
The emergence in popularity of smaller speciality stores such as greengrocers, bakeries, fishmongers and butchers means that for some shoppers an unknown proportion of fresh, healthy foods would not have been captured in their supermarket expenditure. On the other hand, although people are purchasing some takeaway type foods such as frozen pizzas, pies and frozen chicken and chips from supermarkets, meals purchased from takeaway outlets and restaurants are also not accounted for within this approach. Australians spend >25 % of weekly food expenditure on these foods( 5 ), and thus the index may exclude a significant proportion of likely unhealthy foods. Furthermore, this approach does not account for different proportions consumed by different household members, visitors to the home who consume some of this food and food wastage. In addition, although using proportional data reduces the need for information regarding the number and makeup of individuals in the household, the applicability of relationships between shopper demographics and HETI score may be limited. Despite these limitations, food sold in supermarkets makes a substantial contribution to the household diet. In Australia, we have two major supermarkets with a market share of 73 % of the grocery sector( 43 ); therefore, the products they stock have a major influence on food purchases. Therefore, while shopping dockets may have limitations as a direct measure of intake, there is potential to use purchasing information as a proxy of intake at the group/household level.
Future research needs to validate the HETI scoring system against an alternative method of dietary assessment, and even with disease risk factors and biomarkers if possible to examine the diet–disease relationships. A self-administered online version of the 24-h recall will become available in Australia in future, and family members of the primary shopper could be invited to complete a number of recalls over a month to further validate the HETI scoring system. In addition, testing the sensitivity of the index to capture changes in food purchases over time would be warranted( Reference Wirt and Collins 44 ). With the proposed refinements and established validity, there is potential to use such an index in consumer education programmes or supermarket offerings to improve the healthiness of food purchases to better align with public health recommendations. Payne et al.( Reference Payne, Niculescu and Just 10 ) have demonstrated that properly targeted supermarket-based nutrition interventions may benefit both shoppers and retailers by guiding consumer purchases towards fruit and vegetable items without detrimentally affecting the income of the retailers.
Nonetheless, strong evidence for supermarket interventions, particularly those that provide nutrition education only at point of purchase, is somewhat lacking( Reference Escaron, Meinen and Nitzke 8 ), although interventions with a price intervention show more promise( Reference Ni Mhurchu, Blakely and Jiang 13 , Reference Waterlander, de Boer and Schuit 45 , Reference Liberato, Bailie and Brimblecombe 46 ). Nutrition education alone may not be adequate to drive real and sustained change to the household food supply. Emerging technologies might provide a vehicle to increase shopper engagement and collaboration between retailers and nutrition educators. This could affect eating habits at a population level. The HETI might be used to track changes in shoppers’ purchases over time and goals set to improve the score with an education programme to assist.
Conclusion
The HETI was designed to assess the healthiness of food purchases by comparing expenditure with population dietary recommendations. We have shown that higher shopping quality over 1 month was associated with greater expenditure on healthy foods such as fruit and vegetables, and lower expenditure on energy-dense, nutrient-poor foods. Poor shopping quality was also associated with obesity. With further refinement and validation, and with the use of innovative technology that allows communication and education, the HETI may prove to be a useful tool to help shoppers move towards healthier food purchasing patterns at the supermarket.
Acknowledgements
This research received no specific grant from any funding agency, commercial or not-for profit sectors.
All authors contributed to the design of the study. A. T., F. W. and G. A. H. conducted the analysis and were responsible for preparing the manuscript. All authors have reviewed the manuscript and approve it for submission.
None of the authors has any conflicts of interest to declare.


