


Short bowel syndrome (SBS) is a type of intestinal failure caused by intestinal resection resulting in a shortened intestinal remnant( Reference Thompson, Rochling and Weseman 1 ). SBS represents a serious malabsorption disorder, the dietetic management of which is extremely challenging( Reference Fassini, Pfrimer and Ferriolli 2 ). SBS is characterised by an inability to maintain protein–energy, fluid, electrolyte or micronutrient balances when patients are on a conventional diet( Reference Thompson, Rochling and Weseman 1 , Reference O’Keefe, Buchman and Fishbein 3 ).
Although it is considered rare, the true incidence and prevalence of SBS in adults is unknown because of the lack of precise definitions( Reference O’Keefe, Buchman and Fishbein 3 ) for this disorder. In the USA, the estimated annual prevalence of SBS in patients with non-malignant bowel disease requiring home parenteral nutrition (PN) is at least four per hundred thousand( Reference Thompson, Chopra and Clandinin 4 ).
The treatment of patients with SBS is complex since these patients are heterogeneous both conditions leading up to the SBS and in the clinical manifestation of their symptoms. Therefore, nutritional therapy needs to be individualised and depends on the gastrointestinal anatomy, length and health of the remaining intestine( Reference Drehmer, Mello and Gazal 5 , Reference Jeppesen 6 ). Commonly, SBS is associated with complications such as diarrhoea, dehydration, weight loss and nutritional deficiencies( Reference Jeppesen 6 , Reference Kelly, Tappenden and Winkler 7 ). Weight loss results from failure to meet the body’s energy needs, and complications associated with nutritional support usually determine the morbidity and mortality of these patients( Reference Lochs, Dejong and Hammarqvist 8 ). Therefore, it is important to accurately assess the energy intake (EI) of these patients and provide adequate nutrients to compensate for the malabsorption and symptom-related energy losses.
Assessments of dietary intake in a clinical setup is most easily achieved by collecting self-reported data using a variety of methods such as diet histories, 24-h dietary recalls, food frequency questionnaires and weighed-food records. However, self-reported intake may not accurately reflect actual energy requirements( Reference Hise, Sullivan and Jacobsen 9 ), and data in SBS patients are lacking( Reference Fassini, Pfrimer and Ferriolli 2 ). Energy requirements can be measured in weight-stable, free-living individuals using the doubly labelled water (DLW) technique. However, this method is highly specialised and requires a high cost, which limits its use in clinical practice( Reference Redman, Kraus and Bhapkar 10 ). Estimating the energy gap between self-reported and measured energy expenditure is greatly useful for the purpose of planning energy needs for dietetic management and to correct for energy lost in malabsorption, thus ensuring that energy requirements are adequate to prevent malnutrition in SBS patients.
This aim of this study was to compare the accuracy of EI assessed by 24-h dietary recalls (EIrecall) with the total energy expenditure (TEE) measured by the DLW method (TEEdlw) in SBS patients in comparison with matched controls.
Methods
Patient selection
This observational study included participants with SBS (SBS group) and a matched control group (CG). Each CG patient was free from SBS but was matched for age, sex, ethnicity, BMI and chronic disease conditions similar to the SBS patient.
SBS participants were recruited from the Metabolic Unit and Ambulatory Nutrition Unit of the University Hospital at the Ribeirão Preto Medical School. Most SBS patients presented an intestinal transit time of 15 min and history of large intestinal resection( Reference Chagas Neto, Barreto and Muglia 11 ).
Matched controls (CG) were selected by extensive evaluation of electronic medical records at the University Hospital, and via advertisements using the web (University intranet and internet), radio and television.
This study was approved by the Ethics Committee of the Ribeirão Preto Medical School, São Paulo University (process no. 1822/2013), and conducted according to the Helsinki Declaration. This trial was registered at clinicaltrials.gov as NCT02113228.
Anthropometric measurements
Weight was measured after an overnight fast and after participants emptied their bladder, using an electronic scale (Filizola) with the participant on barefeet and wearing a hospital gown. Height was obtained by using a wall-mounted stadiometer (Filizola). BMI was classified according to the World Health Organization( 12 ).
Resting energy expenditure and macronutrient oxidation rate
Resting energy expenditure (REE) and macronutrient oxidation rate was assessed by indirect calorimetry (IC) using the Quark RMR® calorimeter (Cosmed). The IC test was conducted in the morning after 12 h of fasting. Participants were asked to rest quietly in a temperature-controlled room for 30 min before beginning the test. Measurements were collected for 30 min using a canopy with hood using standard practices( Reference Compher, Frankenfield and Keim 13 , Reference Fassini, Silvah and Lima 14 ), as outlined in our previous publication( Reference Fassini, Pfrimer and Ferriolli 2 ). The first 5 min of data were excluded from analyses. Weir’s formula( Reference Weir 15 ) was used to calculate REE and Frayn’s formula( Reference Frayn 16 ) to calculate carbohydrate and lipid oxidation from VO2 and VCO2.
RQ was calculated using the ratio of the volume of carbon dioxide expired (VCO2) to the volume of O2 inspired (VO2).
Total energy expenditure
As in our previous publication( Reference Fassini, Pfrimer and Ferriolli 2 ), TEE was measured by the DLW using the multi-point method over 14 d( 17 ). A baseline urine sample was collected before the participant received the DLW dose (2H2 18O) (2 g of 10 %18O-labelled and 0·12 g of 99·9 % 2H-labelled water/kg estimated total body water). The deuterium oxide and 18O were supplied by Sercon Ltd. Urine samples were collected daily over the 14 d to enhance adherence and minimise confusion regarding the ‘days to collect’; however, only the urine samples from days 1, 2, 3, 7, 12, 13 and 14 were used in the analyses( Reference Fassini, Pfrimer and Ferriolli 2 ). Measurement of H and O2 isotope enrichments were analysed using the isotope ratio MS (Hydra System, ANCA 20–22; Sercon or Europa Scientific) at the Mass Spectrometry Laboratory from Ribeirão Preto Medical School. TEEdlw was calculated using the recommendations of the International Dietary Energy Consultancy Group (IDECG) working group( 17 ), by the method described by Coward( Reference Coward 18 ) using the value of 0·85 for RQ( Reference Schoeller, Taylor and Shay 19 ).
Body composition
Body composition was determined using the 2H dilution technique measures as part of the DLW studies and using the total body water measurements from which fat-free mass and fat mass were calculated( Reference Colley, Byrne and Hills 20 ). For the purposes of DLW dosing, total body water was calculated( 17 , Reference Colley, Byrne and Hills 20 ).
Assessment of energy and macronutrient intake
EIrecall was assessed by four 24-h dietary recalls (three on weekdays, and one on the weekend) applied to participants, following the recommendations of the US Department of Agriculture Automated Multiple-Pass Method( Reference Moshfegh, Rhodes and Baer 21 ). Three 24-h dietary recalls during the weekdays were collected by a trained dietitian, using a picture booklet to improve the quality of the information provided on portion size( Reference Monteiro, Pfrimer and Tremeschin 22 ). One 24-h dietary recall, for the weekend days, was collected by telephone, as results obtained through a telephone interview are similar to the results obtained in person( Reference Tran, Johnson and Soultanakis 23 ) and as this was the only way it was feasible to collect a weekend recall.
A protocol was followed for the standardisation of home measures, where a table to estimate food consumption using home measures( Reference Pinheiro, Lacerda and Benzecry 24 ) and a picture booklet( Reference Monteiro, Pfrimer and Tremeschin 22 ) were used to convert the food to g or ml. The PN was considered to calculate energy and macronutrients for the SBS patients for the week that they received the PN at Metabolic Unit in the hospital.
The software Virtual Nutri Plus® updated with data from the Brazilian Food Composition Table( 25 ) and the USDA American Table( 26 ) was used to calculate energy and macronutrient intakes. For dietary intake analyses, an adjustment of energy and macronutrient data by intrapersonal and interpersonal variability (attenuation method) was applied in order to reduce the distortion of consumption estimates and, consequently, increase the reliability of the results obtained. In this method, a semi-parametric transformation approach was used to estimate usual daily intake distributions according to the method from Iowa State University( Reference Nusser, Carriquiry and Dodd 27 ), using the software PC-Side 1.0 version (Iowa State University).
Macronutrient intake was assessed using the following recommendations: 45–65 % of the total energetic value of the diet from carbohydrate, 10–35 % from proteins and 20–35 % from lipids (Acceptable Macronutrient Distribution Ranges)( 28 ).
Misreporting was determined as described by Black & Cole( Reference Black and Cole 29 ).
Statistical analysis
The sample size was not calculated once we included all the SBS patients registered at our hospital during the past eighteen years. Given that SBS is a rare disease, we would not have been able to increase our sample size, and the current pool is fairly representative of this population.
Results are shown as means and standard deviations. Kolmogorov–Smirnov test was used to assess the normality of the data and independent Student’s t test to compare the SBS patients with the subjects in the CG. Bland–Altman plots were used to compare EIrecall with TEEdlw in each group.
The significance level considered for the tests was set at P<0·05. All analyses were performed by using SPSS version 21.0.
Results
Participant characteristics
A total of twenty-two participants, eleven each in the SBS and CG groups (five men and six women), aged 53 (sd 8) years (range: 37–65 years) were evaluated. The average time since surgery was 8·2 (sd 5·6) years (range: 1–18 years). The clinical information pertaining to the SBS participants, in particular the aetiology, the amount of surgical resection and amount of bowel remaining and intestinal transit time, are provided in Table 1. All patients with SBS had an intestinal transit time of <30 min, and most of them presented a remaining intestine with <120 cm.
Table 1 Baseline characteristics of short bowel syndrome participantsFootnote *
* Clinical information of participants with short bowel syndrome were obtained from the medical records.
Nine SBS patients were from the Ambulatory Nutrition Unit of the University Hospital at the Ribeirão Preto Medical School, and two patients were from the Metabolic Unit and were on partial PN only for 1 week (energy needs were supported with PN and oral intake, which required them to be inpatients) during the 2-week study period. Nutritional status was monitored by the hospital staff for all SBS patients who also received oral supplements of vitamins and/or electrolytes based on their individual needs.
Anthropometric characteristics and body composition
The anthropometric characteristics, body composition and phase angle of the patients are described in Table 2. There were no significant differences between groups. All patients presented stable weight and BMI during the year before and during their participation in this research.
Table 2 Anthropometric characteristics of the groupsFootnote * (Mean values and standard deviations)
SBS, short bowel syndrome; CG, control group.
* Participants without SBS (CG) were matched for characteristics similar to those of SBS participants including sex, age, ethnicity, BMI and chronic diseases. The body composition was determined using the 2H dilution technique measures as part of the doubly labelled water method.
† Independent Student´s t test for comparison between SBS and CG groups.
Resting energy expenditure, macronutrient oxidation rate and total energy expenditure
TEE, REE, macronutrient oxidation rate and RQ of the groups are shown in Table 3.
Table 3 Energy expenditure and substrate oxidation rate of the groupsFootnote * (Mean values and standard deviations)
SBS, short bowel syndrome; CG, control group; REE, resting energy expenditure; TEE, total energy expenditure; DLW, doubly labelled water.
* Participants without SBS (CG) were matched for characteristics similar to those of SBS participants including sex, age, ethnicity, BMI and chronic diseases.
† Independent Student’s t test for comparison between SBS and CG groups.
TEEdlw was significantly lower (P<0·01) in the SBS group (7·85 (SD 1·16) MJ/d, range: 6·18–9·49 MJ/d; equivalent, on average, to 0·14 MJ/kg per d), compared with the CG group (10·02 (SD 1·86) MJ/d, range: 7·9–12·98 MJ/d; equivalent, on average, to 0·18 MJ/kg per d).
REE did not differ significantly between the groups when measured by IC (5·68 (SD 0·79) MJ/d, range: 4·44–7·05 MJ/d, for the SBS group) (5·73 (SD 0·82) MJ/d, range: 4·6–7·14 MJ/d for the CG group); the RQ and the oxidation rate of carbohydrates and lipids also did not differ significantly between the SBS and CG.
Assessment of energy and macronutrient intake
The assessment of energy and macronutrient intake is shown in Table 4. EIrecall adjusted for intrapersonal and interpersonal variability showed that the energetic intake was significantly higher (P<0·05) in the patients in the SBS group compared with the CG.
Table 4 Self-reported 24-h energy intake (EIrecall) and macronutrient composition of the diet of the groupsFootnote * (Mean values and standard deviations)
SBS, short bowel syndrome; CG, control group; DV, daily value.
* Participants without SBS were matched for characteristics similar to those of SBS participants including sex, age, ethnicity, BMI and chronic diseases. DV( 28 ): carbohydrate 45–65 % of DV, protein 10–35 % of DV, lipids 20–35 % of DV.
† Independent Student’s t test for comparison between SBS and CG groups.
Regarding the macronutrient distribution of the total EI, only the percentage of lipid intake was higher in the CG group (P=0·012) compared with the SBS group. However, macronutrient intake was within the recommendations( 28 ) for both groups. Protein consumption per kg of body weight per d was higher for patients in the SBS group (P=0·001).
EIrecall was compared with the TEEdlw in the groups (Fig. 1). The SBS group had a higher EIrecall (11·07 (SD 3·45) MJ/d) in comparison with TEEdlw (7·85 (SD 1·16) MJ/d) (P=0·014). However, the EIrecall (7·19 (SD 1·68) MJ/d) was lower than the TEEdlw (10·02 (SD 1·86) MJ/d) (P=0·001) in the CG.
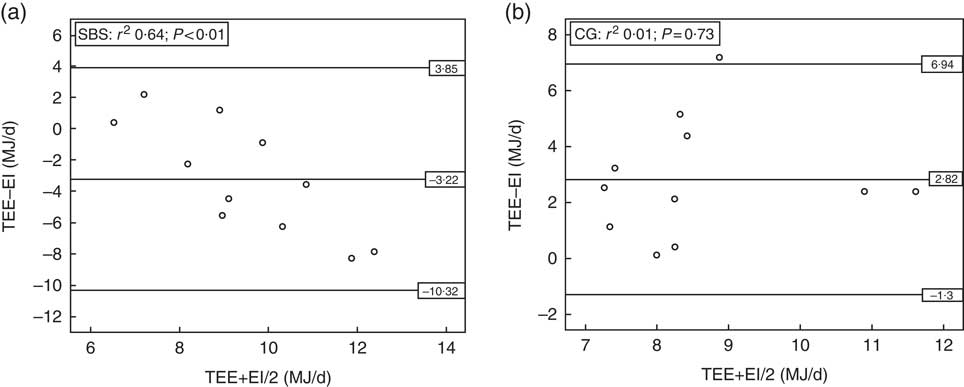
Fig. 1 Bland–Altman plots for comparison between self-reported 24-h energy intake (EI) v. measured total energy expenditure (TEE) in the groups with short bowel syndrome (SBS, n 11) (a), and without short bowel syndrome (control group (CG), n 11) (b). DLW, doubly labelled water.
Discussion
A significantly higher EIrecall was observed in SBS patients in comparison with measured TEE by the DLW method. This suggests that relying on self-reports alone in the long term can be mistaken for provision of adequate energy needs and can compromise nutritional status in SBS patients in whom malabsorption is highly prevalent. For most SBS patients, hyperphagia (defined as an oral intake greater than 1·5 times the REE( Reference Crenn, Morin and Joly 30 )) is key to achieving body’s energy demands and compensating for malabsorption( Reference Crenn, Morin and Joly 30 – Reference Matarese, O’Keefe and Kandil 32 ). Therefore, increasing energy recommendations by an upward adjustment of the EIrecall may be warranted for SBS patients, as suggested by the findings from our study.
All SBS patients who can be maintained on an oral diet need to ingest more energy than normal individuals, as most of the dietary energy is poorly absorbed( Reference Nightingale and Woodward 33 ). The literature indicates that patients with short bowel, who are clinically stable for at least one year, present a total fat, carbohydrate, protein and energy absorption in the order of 54, 61, 81 and 62 %, respectively( Reference Woolf, Miller and Kurian 34 ), and on average SBS patients absorb 52 % of fats, 79 % of carbohydrates, 61 % of protein and 67 % of total energy content ingested( Reference Messing, Pigot and Rongie 35 ). Considering that stable adult patients with SBS absorb only about one-half to two-thirds of the EI, energy prescriptions must be increased by at least 50 % of the estimated energy needs( Reference Dibaise, Young and Vanderhoof 36 , Reference Parrish and Dibaise 37 ).
The observation of under-reporting of EI by subjects in the CG group who were weight stable before and during the study is similar to observations of under-reporting, which is commonly prevalent when intake is self-reported( Reference Karelis, Lavoie and Fontaine 38 ). Further, the estimated dietary intake included 4 d of assessment, and was adjusted for intrapersonal and interpersonal variability. Usually, under-reporting is identified through the comparison between EI and TEE as measured by the DLW method, which is considered an excellent biomarker for EI( Reference Schoeller 39 ).
With regard to the distribution of macronutrients in the diet, both groups presented percentages of intake that were within the current recommendations( 28 ) (45–65 % of the energetic daily value for carbohydrate, 10–35 % for protein and 20–35 % for lipid), and only lipid intake was slightly lower in the SBS patients compared with the CG, suggesting that major changes to the macronutrient recommendations may not be required so long as energetic intake is adequately planned for. Therefore, for adult SBS patients requiring about 0·13MJ/kg per d, the energetic intake should be increased gradually, up to about 0·25MJ/kg per d, in order to promote hyperphagia, and facilitate sufficient absorption of energy content( Reference Jeejeebhoy 31 ).
Although we included all the SBS patients registered at our hospital during the past 18 years, the sample size is small and is a potential limitation of this study. However, given that SBS is a rare disease, we would not have been able to increase our sample size. Another potential limitation is that all the enrolled participants were from one centre; however, this is a primary centre that attends to patients who are referred from all around São Paulo state and from other states in Brazil. A second limitation is that we were unable to measure faecal energy losses in this population and future studies including this aspect, as well as conducting a provided food study where the patients are fed at the level of their reported EI, may help in elucidating the reasons for the discrepancy in REE v. measured EI. The strength of the study is that it is, to our knowledge, the first study comparing measured total daily energy expenditure with daily self-reported EI in adults with SBS and with extended survival after surgery.
Conclusion
In SBS patients, a hyperphagic diet is the key for achieving energy needs. Our study shows that self-reported EI does not reflect the energy available to the SBS patient, and could be misleading when used as the basis for providing or prescribing energetic intake for these patients. The long-term consequence of inadequate EI is the potential for impaired nutritional status and poor recovery from episodes of hospitalisation. Careful monitoring for the provision of additional intake by upward adjustment of self-reported intake to compensate for malabsorptive losses is highly recommended.
Acknowledgements
The authors wish to thank the São Paulo Research Foundation (FAPESP) for the financial support, grants nos 2012/22543-3 and 2012/22542-7.
P. G. F. and K. P. designed the research; P. G. F. conducted the research; J. S. M. and E. F. provided essential materials and support; P. G. F., K. P. and S. K. D. analysed data; P. G. F. and S. K. D. wrote the manuscript; and S. K. D., P. G. F., E. F., J. S. M., K. P. and V. M. M. S. had primary responsibility for the final content. All authors read and approved the final manuscript. None of the authors declared a conflict of interest.


