


The earliest discovered biological action of vitamin K was the control of blood coagulation and consequently dietary guidelines in the UK(1) and elsewhere(2) are typically based on this function alone. However, it is now recognised that vitamin K has a much broader physiological role. Phylloquinone is the primary source of vitamin K in Western diets and average intakes in the UK are about 70 μg/d(Reference Thane, Bolton-Smith and Coward3). While these levels are sufficient for the maintenance of normal blood coagulation, they may be insufficient for maximal vitamin D-dependent carboxylation of osteocalcin(Reference Binkley, Krueger and Engelke4, Reference Bügel, Sørenson and Hels5) and matrix Gla protein(Reference Cranenburg, Schurgers and Vermeer6). It has been suggested that higher phylloquinone intakes may be beneficial for bone health since they are associated with increased bone mineral density(Reference Booth, Broe and Gagnon7) and lower fracture rates(Reference Feskanich, Weber and Willett8, Reference Booth, Tucker and Chen9); however, the conclusions from observational studies are generally not supported by more recent intervention data(Reference Bügel, Sørenson and Hels5, Reference Binkley, Harke and Krueger10–Reference Cheung, Tile and Lee12).
Where intakes may be marginal, and in order to set evidence-based dietary recommendations, it is important to understand the relationship between intake and nutrient status. For phylloquinone, the relationship between intake and plasma concentration, although significant, is not very strong(Reference Thane, Wang and Coward13). An important consideration for the intake–status relationship is the bioavailability, an understanding of which is essential for the determination of the dietary quantity of a nutrient required to ensure adequate status and hence optimal health. In addition, information on phylloquinone bioavailability may be important in controlling coagulation in individuals on long-term anticoagulation treatment(Reference Khan, Wynne and Wood14–Reference Custódio das Dôres, Booth and Aújo Martini16).
Phylloquinone is found in a wide range of foods but vegetables provide over half of daily phylloquinone intake(Reference Thane, Bolton-Smith and Coward3, Reference Duggan, Cashman and Flynn17). Green leafy vegetables are considered the major source of phylloquinone contributing about 20 % to daily intake. Some types of oils and fats also contain high amounts of phylloquinone(Reference Bolton-Smith, Price and Fenton18), and due to their widespread use in many food products it is likely that these make an important contribution(Reference Thane, Bolton-Smith and Coward3). However, limited information is available on phylloquinone bioavailability from these different sources partly because of the difficulties associated with the analysis of phylloquinone. The majority of studies have compared absorption from different sources to standards, such as Konakion®(Reference Gijsbers, Jie and Vermeer19–Reference Schurgers and Vermeer21), but the results are difficult to compare because of differences in study protocols. The studies have been limited to comparisons of bioavailability from foods given to small numbers of subjects, and often using relatively large vitamin doses. Studies comparing the relative bioavailability of phylloquinone from vegetable and oil sources have produced conflicting results(Reference Booth, O'Brien-Morse and Dallal22, Reference Booth, Lichtenstein and Dallal23), most likely due to the different methods used to measure absorption.
The use of stable isotope-labelled tracers potentially avoids some of these problems and provides a safe method of investigating absorption and bioavailability(Reference Yeum and Russell24–Reference Jeanes, Hall and Ellard26). The use of intrinsically labelled vegetables has been investigated for the measurement of phylloquinone absorption(Reference Erkkilä, Lichtenstein and Dolnikowski27–Reference Kurilich, Britz and Clevidence29), but this method of labelling is only suitable for single food items that are amenable to labelling in this way.
Bioavailability studies that focus on absorption from single food items may not reflect the true state of affairs in normal meal consumption since they do not take account of interactions between food components that may negate variation in bioavailability between single foods. Based on recent work in our laboratory(Reference Jones, Bluck and Coward30, Reference Jones, Bluck and Wang31), we report here the development and application of a stable isotope-based method to measure phylloquinone absorption. Our initial aim was to determine the fraction of phylloquinone absorbed from test meals by using the labelled phylloquinone as a standard. However, because the meal significantly influenced absorption of the tracer we have presented the data as a meal effect, defined as the influence of the integrated meal on the absorption of free phylloquinone, and a matrix effect that describes the extraction efficiency or bioaccessibility of phylloquinone from the meal components. In order to provide an objective basis for the meal composition used in the present studies, the test meals were designed to reflect dietary clusters identified from the National Diet and Nutrition Survey of adults 2000–1(Reference Fahey, Thane and Bramwell32).
Methods
Subjects
Twelve healthy, non-smoking subjects were recruited (five female and seven male). The subjects were aged 31·3 (sd 8·3) years (range 22–49 years), with a mean weight of 69·4 (sd 9·3) kg, and BMI of 23·1 (sd 2·3) kg/m2. Ethical permission for the study was obtained from the Suffolk Local Research Ethics Committee and informed, written consent was obtained from all subjects.
Stable isotope-labelled phylloquinone
Methyl-13C-labelled phylloquinone was synthesised by ARC Laboratories (Apeldoorn, The Netherlands). Isotopic purity, assessed by GC/MS in our laboratory, was >98 %. The molecular weight of naturally occurring, unlabelled phylloquinone is 450 Da and for the labelled material 451 Da. A stock solution of 83·8 mg in 100 ml of ethanol was prepared, divided into aliquots and stored at − 18°C. To prepare the dose for volunteers, 48 μl of the standard solution was added to 1 ml of groundnut oil to give a solution of 40 μg/ml. Ethanol was evaporated from the oil by heating at 35°C under N2 with a Pierce Reacti-therm heating block and Reacti-vap evaporator (Perbio Science, Erembodegem, Belgium). After vortexing for 1 min, 0·5 ml of groundnut oil containing 20 μg (44·4 nmol) of phylloquinone was transferred to a gelatine capsule (kindly provided by Capsugel, Colmar, France). Capsules were prepared fresh for each subject and stored, refrigerated, in amber medicine bottles.
Experimental protocol
Since recent phylloquinone intake has an effect on plasma phylloquinone concentration, before each study day, volunteers were supplied with a standard evening meal and asked not to eat anything else. The meal consisted of a pizza containing no ingredients known to be high in phylloquinone. On three occasions, at least 2 weeks apart, volunteers attended the volunteer suite at MRC Human Nutrition Research after an overnight fast. An indwelling cannula was inserted into a forearm, and two baseline blood samples were collected into 7·5 ml EDTA S-monovettes® (Sarstedt Ltd, Leicester, UK). The volunteer then took the phylloquinone capsule (with water) immediately preceding consumption of one of three test meals. Previously prepared meals were defrosted overnight and reheated before consumption. In this three-period study, and to minimise sequence effects, subjects were randomised for the order they received the meals, with two subjects designated to each sequence. A snack (two slices of toast with sunflower spread and jam) was provided after 5 h and water was permitted throughout the study. Thirteen 7·5 ml blood samples were collected at 1·0, 2·0, 2·5, 3·0, 3·5, 4·0, 4·5, 5·0, 5·5, 6·0, 6·5, 7·0 and 8·0 h post-dose. Samples were stored on ice and protected from light and within 1 h were centrifuged at 4°C for 20 min at approximately 2000 g. Plasma was divided into aliquots and stored at − 70°C until analysis.
Meal design
Each of the three meals was formulated to represent a meal from typical UK dietary patterns. Dietary pattern analysis of data from the National Diet and Nutrition Survey of adults 2000–1 has previously identified four dietary clusters for women and six for men, each characterised by their consumption of each of twenty-five food groups relative to the study population(Reference Fahey, Thane and Bramwell32). Of these clusters, three showed similar patterns for both men and women and were chosen for the meal design. Fahey et al. (Reference Fahey, Thane and Bramwell32) assigned a name to each of the dietary clusters to describe its defining characteristics. These names are repeated here in order to aid identification. The ‘convenience’ cluster is characterised by higher than average consumption of fast foods and refined cereals and lower than average consumption of fruit, vegetables and whole-grain cereals. The cosmopolitan cluster is characterised by higher than average consumption of fruits, vegetables, whole grains, fish and dairy foods and the animal-oriented cluster is characterised by higher than average consumption of red meat and saturated fat. The three test meals were designed to reflect the dietary characteristics of each cluster and, on the basis of food composition data contained equal amounts of phylloquinone (40 μg), energy (3200 kJ), energy from protein (20 %), fat (40 %) and carbohydrate (40 %) and fibre (10·5 g). The meals were chicken pie with beans and chips (convenience), fish pie (cosmopolitan) and beef lasagne (animal-oriented). Dietary composition was estimated using the MRC Human Nutrition Research in-house suite of programs based on McCance and Widdowson's The Composition of Foods, 4th edition(Reference Paul and Southgate33), its supplements(Reference Holland, Unwin and Buss34, Reference Holland, Unwin and Buss35) and the 6th edition(36). Phylloquinone values were derived from the 6th edition(36), published values(Reference Bolton-Smith, Price and Fenton18) and unpublished results (C Bolton-Smith and M Shearer). Meal composition is shown is Table 1. Each meal type was prepared in a single batch, cooked and frozen until required.
Table 1 Weight and nutritional information for the convenience (a), cosmopolitan (b) and animal-oriented (c) test meals
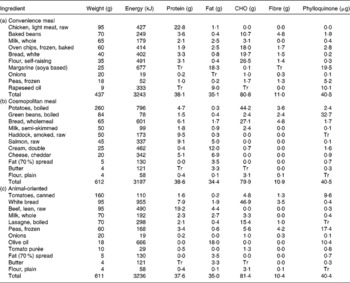
CHO, carbohydrate; Tr, trace.
Analysis of phylloquinone in meals
The extraction of phylloquinone from the meals was based on the method described by Booth et al. (Reference Booth, Davidson and Sadowski37). Quantification was performed by the standard addition method. Chemicals were purchased from VWR (VWR International Ltd, Poole, UK). One meal from each batch was defrosted and heated in the same way as for the subjects' meals, then blended with an equal amount of warm purified water. A 30 g portion was homogenised using an IKA Ultra Turrax T25 basic homogeniser (Esslab, Essex, UK) and 2 g of the homogenised meal was transferred to a pestle and mortar and ground with 18 g of anhydrous sodium sulphate. One gram of the mixture was weighed into a 50 ml polypropylene centrifuge tube (Sarstedt Ltd) and 30 ml of 2-propanol–hexane (3:2, v/v) and 10 ml of purified water were added. At this stage, 3 ng of phylloquinone (Supelco, Poole, Dorset, UK) in 100 μl of hexane was added to half the tubes and to the remaining tubes was added 100 μl of hexane only. The tubes were vortexed for 3 min and then sonicated for 3 min with a Microsonix XL2000 model with 1/8 in. tapered microtip (Microsonix, New York, NY, USA). The tubes were further vortexed for 3 min and then centrifuged at 2000 g for 5 min. From the top layer, 9 ml of hexane was removed and transferred to a disposable culture tube (16 × 100 mm, Corning Ltd, Hemel Hempstead, UK) and evaporated under N2 at 45°C. The contents of the tube were reconstituted in 300 μl of hexane and further purified by solid-phase extraction using 500 mg silica columns (Sep-Pak-RC™ 500 mg silica, Waters, Hatfield, Hertfordshire, UK). The columns were conditioned with 4 ml diethyl ether–hexane (3·5:96·5 v/v) and then 4 ml of hexane. The sample was added and washed with 6 ml of hexane before elution with 7 ml of diethyl ether–hexane (3·5:96·5, v/v). The use of a C18 solid phase extractor purification step was also investigated, but significant losses occurred during the washing steps and we found silica solid phase extractor alone provided sufficient purification. The sample eluent was collected into disposable glass tubes (13 × 100 mm, Fisher Scientific Ltd, Loughborough, Leics, UK) and evaporated to dryness in a vacuum evaporator (Savant, New York, NY, USA). The samples were reconstituted in 200 μl of dichloromethane and 800 μl of methanol and analysed by HPLC. Extraction and analysis was performed in duplicate.
Quantitative analysis
Meal and total plasma phylloquinone were measured by HPLC with fluorescence detection after post-column reduction(Reference Wang, Bates and Yan38). Long-term reproducibility of quality control plasma samples was assessed by their analysis in parallel with the unknowns to ensure the quality assurance in routine analysis. The lower limit of detection of phylloquinone by the described HPLC method is 0·04 nmol/l(Reference Wang, Bates and Yan38). The inter-assay CV of lyphilised human plasma standards (Immunodiagnostik AG, Bensheim, Germany) were 4·3 % (mean 0·48 nmol/l, n 8) and 1·7 % (mean 1·50 nmol/l, n 8). The laboratory also participates in the vitamin K external quality assurance scheme run by the Human Nutristasis Unit at St Thomas' Hospital.
Isotope ratio analysis
Isotope ratio measurements of phylloquinone in plasma were performed by GC/MS after extraction and derivatisation as described previously(Reference Jones, Bluck and Coward30). Briefly, sample extraction and clean-up was achieved by enzyme hydrolysis with lipase and cholesterol esterase, deproteination with ethanol, extraction with hexane and solid-phase extraction. Isotopic composition was determined in the pentafluoropropionyl derivative of phylloquinone. Analysis was performed on an Agilent GC/MS 5973N inert system (Agilent Technologies, Stockport, UK) comprising a 6890 GC with autosampler and equipped with on-column injection. The chromatography used a DB5-MS fused-silica capillary column (15 m × 0·25 mm inner diameter, 0·25 μm film thickness). Ions 598·4 m/z to 602·4 m/z (M to M+4) were monitored in selected ion monitoring and high-resolution mode. Isotope ratios and thus tracer concentrations were calculated using the M+1/M (599·4/598·4 m/z) ratio. The limit of quantification of the GC/MS method is 0·3 nmol/l of total phylloquinone (labelled+unlabelled (endogenous and from the meal) and inter-assay precision is about 3 %(Reference Jones, Bluck and Coward30). Isotopomer ratios were calculated using the fitting methods of Bluck & Coward(Reference Bluck and Coward39) from the raw data generated by the GC/MS.
Calculations
Area under the curve (AUC) was used to assess absorption of the labelled phylloquinone tracer and was calculated using the trapezoid rule. Tracer AUC data assessed the effect of the meal on bioavailability of labelled phylloquinone from the capsule (‘meal effect’). AUC values were checked for normal distribution by observing a quintile–quintile plot. AUC for tracer measurements were compared using linear regression with fixed effects for meal, subject and period.
Tracer concentration was calculated as
where R M+1 is the ratio of M+1 to M and at baseline (0) and subsequent time points (t). C(t) is the concentration of total (i.e. labelled+unlabelled) phylloquinone, assessed by HPLC.
For comparisons of the bioavailability of phylloquinone from the meals, a different approach was taken. In each instance, if the absorption profile with time of phylloquinone from the meal were the same as that of the tracer, then the relationship between them would be linear and with a 1:1 ratio after normalisation for the dose given by adjusting concentrations for the amount of phylloquinone provided as tracer or in the meal. By measuring the slope of regressions between normalised concentration of tracer and tracee from the meal, it was possible to measure the relative absorption of the phylloquinone from each meal compared with the tracer. This ‘matrix effect’ describes the extraction efficiency of phylloquinone from the meal. Data manipulation was performed in Excel (Microsoft, Seattle, WA, USA) and statistics were performed using STATA version 9.1 (StataCorp LP, College Station, TX, USA).
Results
Mean baseline plasma phylloquinone concentration was 0·35 (sd 0·30) nmol/l. Mean baseline intra-individual CV was 48 %. The maximum total plasma phylloquinone increment in any subject was 2·5 nmol/l.
Phylloquinone in test meals measured by HPLC was 19·9 μg in the convenience meal, 26·3 μg in the cosmopolitan meal and 33·0 μg in the animal-oriented meal. The CV of results for duplicate extraction and analyses was < 4 %. For subsequent calculations, the measured meal phylloquinone content was used rather than that calculated from food tables.
The means of tracer AUC measurements were 0·88 (sd 0·43), 1·30 (sd 0·48) and 1·13 (sd 0·60) nmol/l × h for the convenience, cosmopolitan and animal-oriented meals, respectively. Individual values are shown in Table 2. Significantly more phylloquinone tracer was absorbed when consumed with the cosmopolitan and animal-oriented meals than the convenience meal (P = 0·001 and 0·035, respectively). We did not detect any significant difference between the cosmopolitan and animal-oriented meals (P = 0·120). There were no significant differences in AUC between sexes, calculated using Student's t test (convenience P = 0·83, cosmopolitan P = 0·88, animal-oriented P = 0·81). Calculation of AUC between 0–5 h and 5–8 h tested the possible influence of the 5 h snack on appearance of tracer phylloquinone in plasma. However, differences between meals in tracer absorption were similar before and after the snack. Profiles of plasma tracer against time are shown in Fig. 1.
Table 2 Tracer area under the curve (AUC) values for each individual and each meal
Fig. 1 (A–N) Plasma phylloquinone tracer concentration v. time profiles for each subject, after oral administration of 20 μg 13C-labelled phylloquinone consumed together with the convenience meal (○), cosmopolitan meal (●), or animal-oriented meal (△).
Means of the slopes of the relationship between tracer and meal tracee after adjustment for dose were 1·88 (sd 0·81), 0·59 (sd 0·32) and 0·43 (sd 0·40) for convenience, cosmopolitan and animal-oriented meals, respectively. Final relative bioavailability values (Table 3) between meals were calculated by multiplying values for the matrix and meal effects and are expressed relative to the convenience meal.
Table 3 Summary of meal and matrix effects and combined relative bioavailability values for the three test meals
Values are normalised to the convenience meal.
* Meal effect refers to the effect of meal on absorption of tracer vitamin K1 calculated from area under the curve measurements of plasma tracer concentration.
† Matrix effect refers to the bioavailability of vitamin K1 from within the food matrix, relative to the tracer.
‡ The total effect is calculated as the product of the meal and matrix effects.
Discussion
The primary aim of the present study was to develop and apply a stable isotope-based method to measure phylloquinone bioavailability. We proposed a method using 13C-labelled tracer as a standard, taken at the same time as a test meal. Changes in plasma phylloquinone isotopic enrichment could then be used to calculate relative bioavailability of phylloquinone from the meals. However, dominance of the meal effect resulted in significant differences in tracer absorption between the meals. As a consequence, it was not possible to use the tracer as a global standard by which to compare phylloquinone absorption. An alternative approach was adopted where relative bioavailability of phylloquinone from the meals was assessed on the basis of the relationship between tracer and tracee absorption profile with time. Thus, two, separate but interacting, determinants to bioavailability can be considered. Firstly, meal composition affects the bioavailability of free phylloquinone. This meal effect is the result of the meal modifying conditions within the gut and affecting digestion and/or absorption, and the potential enhancers or inhibitors of absorption. The second determinant, matrix effects or bioaccessibility, relate to the extraction of phylloquinone from the meal constituents. The appearance in plasma of 13C-labelled phylloquinone was used to determine meal effects, whereas the relationship between tracer and tracee phylloquinone was used to determine matrix effects. A final relative bioavailability value for each of the meals was determined as the product of the matrix and meal effects.
Absorption of phylloquinone from the capsule was significantly lower when taken with the convenience meal compared with the other meals. Such variation in absorption between meals has also been observed for stable isotope-labelled vitamin E(Reference Jeanes, Hall and Ellard26). Various meal factors such as viscosity, particle size, meal volume, macronutrient content and energy density determine gastric emptying and intestinal transit(Reference Low40), and these may affect phylloquinone bioavailability. To minimise differences in gastric emptying between the meals, all were balanced for fibre content, energy and percentage of energy from fat, protein and carbohydrate. However, the convenience meal had a 50 % greater energy density that may have influenced phylloquinone absorption. Borel et al. (Reference Borel, Pasquier and Armand41) investigated the effect of emulsified fat globule size on the absorption of vitamins A and E and concluded that the size of the particles does not affect absorption. Fat is required to stimulate bile secretion that is necessary for the absorption of phylloquinone(Reference Shearer, McBurney and Barkhan42). Butter increased phylloquinone absorption from spinach 3-fold(Reference Gijsbers, Jie and Vermeer19), but another study reported no difference in phylloquinone absorption between lettuce consumed with either 30 or 45 % energy from fat(Reference Garber, Binkley and Krueger20). Meals in the present study contained similar amounts of fat, thus total fat is unlikely to explain the differences in absorption between meals. The fatty acid composition of a meal may affect absorption and plasma response by changing the physical characteristics of mixed micelles and/or influencing postprandial lipid metabolism. Chylomicrons are the major carrier of postprandial phylloquinone(Reference Lamon-Fava, Sadowski and Davidson43) and chylomicron remnants transport phylloquinone to both liver and also bone(Reference Niemeier, Kassem and Toedter44). The size of mixed micelles may be important since longer chain fatty acids reduced phylloquinone absorption(Reference Hollander and Rim45). PUFA decreased phylloquinone absorption in in vitro (Reference Hollander and Rim45) and rat(Reference Hollander, Rim and Muralidhara46) experiments, possibly through a greater affinity of the mixed micelle for phylloquinone decreasing transfer across the enterocyte. More recent studies in human subjects have shown that a PUFA-rich maize oil diet resulted in lower plasma phylloquinone compared with a diet enriched with olive/sunflower oil(Reference Schurgers, Shearer and Soute47). In the present study, the convenience meal contained more than 2-fold greater PUFA (37 % of total fat) than both the cosmopolitan (19 %) and animal-oriented meals (14 %). Inhibition of phylloquinone uptake or altered postprandial metabolism by the high PUFA convenience meal could explain the lower absorption of phylloquinone from the capsule. Evidence suggests that vitamin E may affect phylloquinone status in rats(Reference Alexander and Suttie48, Reference Mitchell, Cook and Jenkins49); however, other studies have shown that effects are limited to tissue status, not plasma status, both in animal(Reference Tovar, Ameho and Blumberg50) and in human studies(Reference Booth, Golly and Sacheck51), thus it is likely that any effect is related to metabolism rather than absorption(Reference Schurgers, Shearer and Soute47, Reference Traber52). In the present study, the vitamin E content of each meal, calculated using food composition tables, was 11·0, 5·3 and 5·8 mg for the convenience, cosmopolitan and animal-oriented meals, respectively.
Observation of the tracer profiles in Fig. 1 reveals that in the majority of cases, an individual's plasma tracer concentration profile shows a similar pattern for each test meal, and suggests that the differences in tracer profiles reflect genetic or physiological differences between individuals, e.g. transfer of phylloquinone across the enterocyte or chylomicron metabolism (apo E genotype). High intra-individual consistency in absorption profiles of carotenoids has also been observed(Reference Faulks and Southon53). Although in general tracer profiles within individuals were similar for the different meals, subjects K, L and N showed substantial intra-individual differences in tracer absorption profile between the meals that may have confounded the results. As far as practicable external influences on digestion and absorption were controlled (such as previous meals, fasting and seating position), it is possible that these may have affected the absorption profile. In addition, particularly where absorption was apparently delayed, tracer concentration remained elevated beyond the 8 h duration of the experiment thus similar future studies might consider increasing the sampling period. These observations demonstrate that consideration should be given to potential variability of the absorption profile in bioavailability studies, particularly where absorption is assessed on the basis of a measurement at a single time point(Reference Schurgers, Teunissen and Hamulyak54), and further supports the importance of crossover studies. Although generally there was some consistency in the extent of tracer absorption between the different meals for the same individual (assessed by rank; Table 2), the potential variability in absorption of phylloquinone from the same meal eaten on different occasions for a given individual is unknown and may have influenced the data. A single study has reported the intra-individual variation of phylloquinone absorption, albeit of a very large dose of a pharmaceutical preparation of phylloquinone (2·2 μmol Konakion). CV of the AUC measurements for three individuals each measured on three occasions were 18, 7 and 9 %(Reference Gijsbers, Jie and Vermeer19).
In a number of individuals, tracer phylloquinone peaked between 5 and 8 h, or a second smaller peak was observed, apparently in response to the 5 h snack. Although there were no differences in AUC before and after the snack, the snack may influence the plasma tracer profile. In some individuals, the physiological response to the snack may be the release of partially absorbed phylloquinone into the circulation. Dueker et al. (Reference Dueker, Lin and Buchholz55) reported a similar observation with a second plasma peak of labelled β-carotene. A comparable phenomenon has also been reported with fatty acids, where fatty acids consumed during an initial meal appear in the circulation after a second meal a number of hours later(Reference Fielding, Callow and Owen56, Reference Maillot, Garrigue and Pinault57). An alternative explanation for the second peak is hepatic secretion of VLDL containing phylloquinone(Reference Erkkilä, Lichtenstein and Dolnikowski27, Reference Lamon-Fava, Sadowski and Davidson43, Reference Schurgers and Vermeer58).
In contrast to tracer absorption, and on the basis of the matrix effect alone, absorption of phylloquinone from the convenience meal was more than 3-fold than that from the cosmopolitan and animal-oriented meals. While the magnitude of this difference was reduced with the inclusion of the meal effect (tracer data), total relative bioavailability remained greater from the convenience meal. Greater absorption of phylloquinone from the convenience meal may be expected given the sources of phylloquinone. In the convenience meal, it can be estimated that more than 80 % of the phylloquinone was in the oil phase, whereas in the cosmopolitan and animal-oriented meals only 10 and 20 % of phylloquinone was in oil, respectively. Conversely, the majority of phylloquinone in the cosmopolitan and animal-oriented meals was sited within a vegetable matrix where it is tightly bound to the thylakoid membranes and may be less bioavailable because cell walls and membranes must be digested before absorption. Although it is generally assumed that fat-soluble vitamin absorption is greater from fat than from vegetables, there have been few direct comparisons(Reference Parker, Swanson and You59). Previous studies to compare the bioavailability of phylloquinone from oil and vegetables have shown conflicting results. In one study, absorption, calculated by 24 h AUC, was reported to be significantly greater from oil than from broccoli(Reference Booth, Lichtenstein and Dallal23) but an earlier study, which measured absorption of phylloquinone from multiple meals over 5 d, found no difference in absorption between these two sources(Reference Booth, O'Brien-Morse and Dallal22). A number of caveats are applicable to our interpretation of the matrix effect data. Firstly, due to low phylloquinone content of the meals and low absorption, the plasma phylloquinone content attributable to phylloquinone from the meal was towards the lower end of analytical limits. Plasma phylloquinone concentration from the meal across the time course of the experiment was between 0·2 and 1 nmol/l. Secondly, and as discussed earlier in relation to the tracer data, there was variability in the pattern of phylloquinone appearance in plasma and in responses with the different meals, both of which may have influenced our interpretation of the matrix effect. Thirdly, although the mixed meal provides the opportunity to assess the combined impact of foods, interpretation of these effects is complicated by the many interacting factors.
Previous phylloquinone absorption studies have primarily tested single foods, either individually or in combination with untypical food combinations. The meal-based method described here was an attempt to use a less subjective approach to the design of test meals with the aim that they represent more accurately meals in a free-living situation in which food components may interact to negate effects observed in experiments with individual foods. The three meals in the present study were designed using the characteristics of dietary clusters identified in a national nutrition survey. The use of dietary analysis in this way provides a basis for the design of test meals in bioavailability experiments that can be used to probe relationships between dietary intake and plasma response and/or status. The meals were designed to contain equal amounts of phylloquinone, with the major difference between the meals, the sources of phylloquinone. However, direct analysis of meals revealed variation in the measured value compared with that calculated from nutrient tables. The observed discrepancy however is not unusual; the phylloquinone content of foods is known to be highly variable and affected by heating(Reference Ferland and Sadowski60). Furthermore, a comparison of the phylloquinone content of ten meals calculated by two nutrient databases compared with direct analysis showed variation of up to 89 %(Reference McKeown, Rasmussen and Charnley61).
In summary, we have investigated a meal-based approach to measurements of absorption, which is more relevant to the consumption of foods in a free-living population. The apparent dominance of the meal effect showed that different meals affect absorption of phylloquinone, although the mechanism is unknown. Notwithstanding the potential limitations, the data also suggest that phylloquinone may be more bioavailable from oils and fats than from vegetable sources.
Acknowledgements
We would like to acknowledge the UK Food Standards Agency for funding this work (project number N05050). We would like to thank Louise McKenna for assistance in sample extraction and analysis, and the volunteers for participating in the study. We also thank Dr Adrian Mander and Mark Chatfield for statistical advice. There are no conflicts of interest. K. S. J., L. J. C. B., A. M. S., C. J. P. and W. A. C. all contributed to the design of the study. K. S. J. performed the actual study including meal design and preparation, volunteer work, GC/MS analysis of plasma, food extractions, and data analysis. L. Y. W. performed all the HPLC analysis. K. S. J. drafted the manuscript with input from all co-authors.


