


Adverse situations, such as malnutrition and hormonal changes, during a critical window of development, such as lactation, could permanently affect the regulation of body mass and food ingestion in the progeny( Reference de Moura and Passos 1 , Reference de Moura, Lisboa and Passos 2 ). This phenomenon is defined as the programming or ‘Barker hypothesis’ and is supported by strong epidemiological data( Reference Barker 3 ). More recently, it was renamed as developmental plasticity due to its probabilistic rather than deterministic nature( Reference Gluckman and Hanson 4 ).
The interruption of lactation before the recommended minimum period of 6 months in humans( 5 ) is a very common practice today, since no more than 35 % of infants worldwide are exclusively breastfed during the first 4 months of life( 6 ). Some epidemiological studies have suggested an association between breast-feeding and prevention of child and adolescence overweight( Reference Stettler 7 ). However, population studies have shown several confounding factors. Given the prevalence of precocious interruption of breast-feeding in humans, animal models that emulate this phenomenon might provide useful information regarding the deleterious effects of this procedure on development and health. In this regard, studies carried out in different experimental models of early weaning lend support to the hypothesis that precocious interruption of lactation is a priming factor for developmental plasticity( Reference Bonomo, Lisboa and Pereira 8 – Reference Lisboa, Pires and de Oliveira 13 ).
Our group has recently demonstrated( Reference Lima Nda, de Moura and Passos 14 ) that interruption in lactation for a short period, without the use of pharmacological substances or maternal separation, programmes the progeny for overweight, insulin and leptin resistance( Reference Lima Nda, de Moura and Passos 14 ). At weaning, early-weaned (EW) pups presented lower body mass, length, visceral fat, total fat, leptinaemia, glycaemia and insulinaemia, indicating malnutrition. At postnatal day 180 (P180), EW animals displayed hyperphagia, higher adiposity and hyperleptinaemia. In the hypothalamus, normal contents of leptin receptor (Ob-R) were observed in these animals; however, the contents of downstream effectors of the leptin pathway such as Janus tyrosine kinase 2 (JAK-2) and phosphorylated signal transducer and activator of transcription-3 (pSTAT-3) were lower. On the other hand, suppressor of cytokine signalling-3 (SOCS3), an inhibitor of leptin signalling( Reference Bjorbaek, El-Haschimi and Frantz 15 ), was higher, explaining the central leptin resistance, characterised by the concomitant presence of hyperphagia and hyperleptinaemia( Reference Lima Nda, de Moura and Passos 14 ).
Energy homeostasis depends on a complex regulatory mechanism controlled by the hypothalamus, composed of several nuclei which produce specific neuropeptides to control food intake( Reference Remmers and Delemarre-van de Waal 16 ). The arcuate nucleus (ARC) receives peripheral messages that include satiety and adiposity signals, such as leptin and insulin. It contains two populations of neurons that express the leptin receptor (Ob-R), but which are differently regulated by leptin. These are: anorexigenic neurons releasing pro-opiomelanocortin (POMC) and cocaine- and amphetamine-regulated transcript (CART), which are positively regulated by leptin, reducing food intake and increasing catabolic processes; and orexigenic neurons releasing neuropeptide Y (NPY) and agouti-related peptide (AgRP), which are negatively regulated by leptin, promoting feeding and inhibiting energy expenditure( Reference Gautron and Elmquist 17 , Reference Sanchez-Lasheras, Konner and Bruning 18 ). POMC is later cleaved into melanocyte-stimulating hormone, which acts on melanocortin receptors (MC3R and MC4R), while AgRP acts as an antagonist of these receptors( Reference Sanchez-Lasheras, Konner and Bruning 18 ). Project axons reach, among other structures, the paraventricular nucleus (PVN), where anorexigenic hormones such as thyrotropin-releasing hormone and corticotropin-releasing hormone are produced. Also, these axons can reach the lateral hypothalamus (LH), where the orexigenic hormones such as melanin-concentrating hormone and orexins are produced( Reference Remmers and Delemarre-van de Waal 16 , Reference Sanchez-Lasheras, Konner and Bruning 18 , Reference Valassi, Scacchi and Cavagnini 19 ).
During early development, there is a window of plasticity, a period in which the organism can still develop in different directions. During this period, the developing organism has a large potential to adapt to its environment( Reference Remmers and Delemarre-van de Waal 16 , Reference Metcalfe and Monaghan 20 ). The development of hypothalamic feeding circuits in rats occurs at this time, and perturbations in perinatal nutrition that alter leptin levels may have consequences for the formation and function of circuits regulating food intake and body weight in adult life( Reference Bouret, Draper and Simerly 21 – Reference Pinto, Roseberry and Liu 23 ). Since we have described that EW pups present hypoleptinaemia at postnatal day 21 (P21)( Reference Lima Nda, de Moura and Passos 14 ), it is conceivable that orexigenic and anorexigenic neuropeptides are imprinted by this alteration. Thus, in the present study, we evaluated the expression of NPY, AGRP, CART and POMC neuropeptides in the ARC, PVN and LH, in an EW model in order to better understand the mechanisms underlying the obese and hyperphagic phenotypes that are observed in these animals in adulthood.
Experimental methods
Ethical approval
The use of animals according to our experimental design was approved by the Animal Care and Use Committee of the Biology Institute of the State University of Rio de Janeiro (no. CEUA/017/2009), which based its analysis on the principles established in Brazilian Law no. 11·794/2008. Experiments were conducted to minimise the number of animals and the suffering caused by the procedures following the ethical doctrine of the three ‘Rs’ – reduction, refinement and replacement( Reference Drummond 24 , Reference Marques, Morales and Petroianu 25 ).
Animals
Wistar rats were kept in a temperature-controlled room (25 ± 1°C) with an artificial dark–light cycle (lights on at 07.00 hours and off at 19.00 hours). Each pregnant rat was placed in an individual cage with free access to water and food until delivery. In order to avoid the influence of the litter size in the programming, only dams whose litter size was at least ten pups were used. At birth, to maximise lactation performance( Reference Passos, Ramos and Moura 26 ), litters were adjusted to six male pups per dam.
Experimental model of early weaning
As described previously by Lima et al. ( Reference Lima Nda, de Moura and Passos 14 ), after birth, twelve lactating rat dams were randomly separated into the two following groups: EW (early weaning) – dams were lightly anesthetised with thiopental (0·06 mg/ml per 100 g) and teats were blocked with a bandage to interrupt lactation from postnatal day 18 to P21; control – dams whose pups weaned after the normal period of 21 d.
Both groups received food directly into the cage and pups had easy access to drinking water from a bottle. During lactation, body weight and naso-anal length of the pups were daily monitored. After weaning, EW and control offspring had free access to water and a standard laboratory diet, and their body weight and food intake were recorded. We used one offspring from each dam from both groups.
Animals were killed at weaning P21 and P180 for Western blot analyses of neuropeptides. Animals killed at P180 were used both for Western blot and immunohistochemistry analyses.
Western blot and statistical analysis
Animals were killed by decapitation for the Western blot analysis. Hypothalamic samples were collected from six animals (from different litters) per group per age (P21 and P180). To obtain cell extracts, the hypothalamus was homogenised in ice-cold lysis buffer (50 mm-HEPES, 1 mm-MgCl2, 10 mm-EDTA, 1 % Triton X-100, pH 6·4) containing the following protease inhibitors: aprotinin (10 μg/μl), leupeptin (10 μg/μl), pepstatin (2 μg/μl) and 1 mm-phenylmethylsulfonic fluoride (PMSF) (Sigma-Aldrich). After centrifugation (7500 g for 5 min), homogenates were stored at − 20°C. NPY, AgRP, POMC and CART contents were analysed by Western blot, using anti-actin (Sigma-Aldrich) as an internal control. Protein concentrations were determined by the BCA Protein Assay Kit (Thermo Scientific). Samples (30 μg total protein) were separated by 10 % SDS-PAGE according to the molecular weight of each protein, and transferred to nitrocellulose membranes (Hybond ECL; Amersham Pharmacia Biotech). Rainbow standard markers (Amersham Biosciences) were run in parallel to estimate molecular weights. Membranes were blocked with 5 % non-fat milk in Tween–TBS (20 mm-2-amino-2-hydroxymethyl-propane-1,3-diol (Tris)-HCl, pH 7·5, 500 mm-NaCl, 0·1 % Tween-20) for 1 h. Membranes were incubated with the same primary antibodies used in immunohistochemistry with adjustments in working dilution: anti-NPY, anti-AgRP, anti-POMC, anti-CART and anti-actin (1:500 in TBS), with appropriate secondary antibodies (1:10 000; peroxidase-conjugated IgG, Santa Cruz Biotechnology) for 1 h and then with streptavidin (1:10 000; Zymed) for 1 h. Targeted proteins were detected by chemiluminescence (ECL; Amersham Pharmacia Biotech) and then exposed to X-ray film for 10 s to 30 min. Images were scanned and bands were quantified by densitometry using Image J 1.34 s software (Wayne Rasband National Institute of Health).
Results are reported as mean values with their standard errors. The GraphPad Prism 4 (GraphPad Software) program was used for statistical analyses and graphics. Experimental data were analysed by Student's unpaired t test with the level of significance set at P < 0·05.
Immunohistochemistry
Rats at P180 (four animals per group from different litters) were anaesthetised with Avertin® (0·3 mg/kg intraperitoneally) and intracardially perfused with 0·9 % saline solution followed by 4 % paraformaldehyde in 100 mm-phosphate buffer (pH 7·4) and then by the same fixative plus 10 % sucrose for cryoprotection. After dissection, brains were immersed in 100 mm-phosphate buffer containing 20 % sucrose overnight at 4°C and then sectioned at 20 μm on a cryotome at − 20°C in the coronal plane. All sections containing the hypothalamus starting from Bregma − 1·88 mm, according to Paxinos & Watson( Reference Paxinos and Watson 27 ), were collected in gelatinised slides and then stored at − 20°C.
Before staining, sections were treated with a 0·3 % PBS–Triton X-100 solution for six times, 5 min each, followed by incubation with a blocking solution (5 % bovine serum albumin) for 1 h at room temperature. After that, they were submitted to immunolabelling with primary antibodies, which were incubated in a blocking solution (1 % bovine serum albumin) overnight at 4°C. Sections were then rinsed with PBS four times and the immunoreaction was visualised by incubation with the appropriate secondary antibody for 1 h at room temperature. After rinses with PBS, sections were counterstained with 4′,6-diamidino-2-phenylindole (DAPI) (diluted 1:5000; Sigma). Slides were rinsed and mounted in ProLong Gold antifading reagent (Invitrogen, Molecular Probes). In control procedures, omission of the primary antibodies with inclusion of the secondary antibody produced no labelling.
We analysed the following hypothalamic nuclei: ARC, PVN and LH. We used the antero-posterior coordinates from Paxinos & Watson( Reference Paxinos and Watson 27 ) as guides to select the appropriate histological sections and equated the levels of the hypothalamus in both groups. Image capturing was performed with a LSM 510 META Confocal Microscope (Zeiss). For the quantification procedures we used captured images of four slices per animal. Each selected slice was 20 μm and was separated from the other selected slices by 100 μm.
The anti-NPY antibody labels neuron fibres. For the quantification analyses, we used Image-Pro Plus (version 4.5; Media Cybernetic, Inc.). The segmentation tool was used in order to better differentiate the background from actual NPY staining of the processes. Since the cut-off point was selected by the experimenter (who was blind as to group assignment), we decided to repeat the segmentation tool procedure three times, on separate occasions, for each image. The grey-scale image (brighter pixels indicating stronger labelling) resulting from this procedure was used in the quantification procedure, which consisted of calculating the average pixel brightness intensity of the entire image. Then, we calculated the average pixel intensity for the three treated images of each original, and this final result was used as the datum.
AgRP, POMC and CART antibodies label the perinuclear region. Since individual cells can be easily identified with this labelling, the number of cells for each marker was determined. For the quantification, positive cells of each marker were counted, in images counterstained with 4′,6-diamidino-2-phenylindole (DAPI), in captured images of each hypothalamic nucleus analysed (ARC, PVN, LH), of four slices per animal.
Statistical analysis
Data are compiled as means and standard errors. Data pertaining to the intensity of NPY immunostaining in four animals of each group (control and EW) were submitted to a repeated-measures ANOVA. ‘Group’ (control or EW) was considered the between-subjects factor. ‘Marker’ (AgRP, POMC, CART) and ‘nucleus’ (ARC, PVN, LH) were considered the within-subjects factors. Data regarding the number of positive cells displaying AgRP, POMC or CART immunostaining in four animals of each group were also submitted to a repeated-measures ANOVA using the same between- and within-factors. For simplicity, we will report results based only on the averaged univariate F tests. The univariate approach is considered more powerful than the multivariate criteria( Reference Huynh and Feldt 28 ). However, each univariate test requires that the variances of all transformed variables for a given effect to be equal and their covariances to be zero( Reference Huynh and Feldt 28 ). Therefore, the extent to which the covariance matrices deviated from sphericity was estimated by Mauchly's test and when the sphericity assumptions appeared to be violated, an adjustment to the numerator and denominator df was made by using parameter ɛ( Reference Huynh and Feldt 28 ). Pairwise comparisons were carried out post hoc by Fisher's protected least significant difference test. Significance is assumed at the level of P < 0·05 for main effects.
Antibodies
Anti-NPY (rabbit polyclonal antibody, diluted 1:1000) was purchased from Sigma-Aldrich. The following primary antibodies were purchased from Santa Cruz Biotechnology Inc.: anti-AgRP (rabbit polyclonal antibody, diluted 1:100); anti-CART (goat polyclonal antibody, diluted 1:100); anti-POMC (rabbit polyclonal antibody, diluted 1:100). Primary antibodies were revealed by appropriate secondary antibodies: donkey anti-rabbit conjugated with Alexa Fluor 488 or donkey anti-goat conjugated with Alexa Fluor 633, all from Molecular Probes (Invitrogen), diluted 1:400.
Results
The results regarding body weight and food intake have previously been published by Lima et al. ( Reference Lima Nda, de Moura and Passos 14 ). The aforementioned study used animals from the same litters that were used here. In summary, at weaning (P21), it was shown that EW pups presented lower body weight ( − 10 %), visceral fat ( − 40 %) and total fat ( − 30 %). In addition, lower leptinaemia ( − 73 %), glycaemia ( − 10 %)m and insulinaemia ( − 20 %) were observed. In adulthood (P180), EW offspring showed hyperphagia, higher body weight (+8 %), visceral fat (+36 %), total fat (84 %), triacylglycerolaemia (+96 %), glycaemia (+15 %) and leptinaemia (+185 %), but lower adiponectinaemia ( − 59 %). All parameters analysed in that study were also used in the present study.
Here, at P21, Western blot analysis of total hypothalamus protein content showed no significant difference between the groups (P>0·05) concerning the neuropeptides AgRP, POMC and CART (data not shown). On the other hand, NPY was significantly increased by 86 % in the EW group compared with the control group (F = 1·3; df = 8; P = 0·032) (Fig. 1).
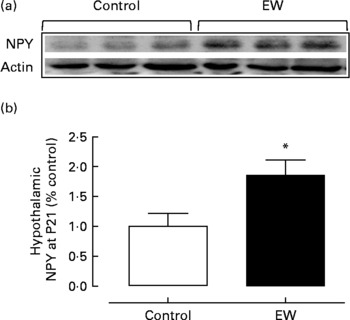
Fig. 1 Hypothalamic neuropeptide Y (NPY) protein content at postnatal day 21 (P21). Representative blots (a) and optical density of NPY (b) protein expression evaluated by Western blot in the hypothalamus. (□), Control group; (■), early-weaned (EW) group. Values are means (six rats per group), with standard errors represented by vertical bars. * Mean value was significantly different from that of the control group (P < 0·05).
At P180, immunohistochemistry for NPY demonstrated that EW offspring presented a more intense staining (Fig. 2(b) and (d)) in comparison with the control group (Fig. 2(a) and (c)), as observed in the medial part of the ARC, in the periventricular nucleus (both regions highlighted in Fig. 2(c) and (d)) and in the parvocellular region of the PVN (regions highlighted in Fig. 2(a) and (b)).
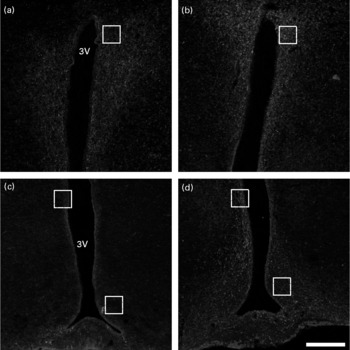
Fig. 2 Immunohistochemistry for neuropeptide Y (NPY) in the hypothalamus at postnatal day 180. Confocal multichannel images of NPY immunoreactions, counterstained with 4′,6-diamidino-2-phenylindole (DAPI). (a) and (c), Control group; (b) and (d), early-weaned (EW) group. (a) and (b), Paraventricular nucleus (PVN); (c) and (d), arcuate nucleus (ARC). The marked areas in (a) and (b) show the parvocellular region of the PVN; the top marked areas in (c) and (d) show the periventricular nucleus; the lower marked areas in (c) and (d) show the medial part of the ARC. Note that NPY immunoreaction is more intense in EW animals in these delimited regions. 3V, third ventricle. Calibration bar: 200 μm.
In higher resolution, the EW group presented a denser NPY-positive fibre network in all nuclei analysed: ARC, PVN and LH (Fig. 3(d), (e) and (f)). The fibres were apparently not organised as in the control group and were also thicker, as observed in the PVN (arrows in Fig. 3(a) and (b) and 3(d) and (e)). NPY fibre quantification in the EW group showed an increase in NPY density in the PVN (1·9-fold increase) that was significant (F = 23·5; df = 1; P = 0·003). The ARC and LH showed no difference in NPY density between the groups (ARC: F = 1·4, df = 1, P>0·10; LH: F = 1·6, df = 1, P>0·10) (Fig. 4(a)).
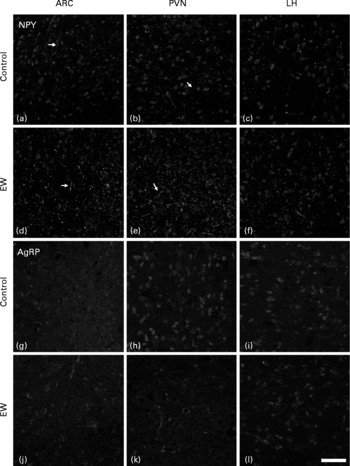
Fig. 3 Immunohistochemistry for orexigenic neuropeptides neuropeptide Y (NPY) and agouti-related peptide (AgRP) in the arcuate nucleus (ARC), paraventricular nucleus (PVN) and lateral hypothalamus (LH) at postnatal day 180. (a)–(f), Confocal images of NPY antibody, counterstained with 4′,6-diamidino-2-phenylindole (DAPI); (g)–(l), confocal images of AgRP antibody, counterstained with DAPI; (a)–(c) and (g)–(i), control (C) animals; (d)–(f) and (j)–(l), early-weaned (EW) animals; (a), (d), (g) and (j), ARC; (b), (e), (h) and (k), PVN; (c), (f), (i) and (l), LH. Observe the increase of NPY immunoreactivity in EW offspring, and there is no difference in AgRP immunostaining between the groups. → , NPY-positive fibre network. Calibration bar: 50 μm.
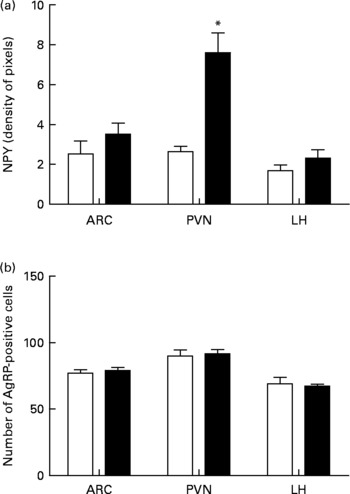
Fig. 4 Quantitative data concerning orexigenic neuropeptides neuropeptide Y (NPY) and agouti-related peptide (AgRP) in the arcuate nucleus (ARC), paraventricular nucleus (PVN) and lateral hypothalamus (LH) at postnatal day 180. (a) NPY immunostaining as indicated as pixel density. (b) Number of AgRP-positive cell bodies. (□), Control group; (■), early-weaned group. Values are means (four rats per group), with standard errors represented by vertical bars. * Mean value was significantly different from that of the control group (P < 0·05).
Qualitative analysis of AgRP immunostaining indicated that there were no differences between the groups in the three nuclei analysed (Fig. 3(g)–(l)). Quantitative analyses of AgRP-positive cells also failed to show significant differences between the groups in all three nuclei (ARC: F = 0·43, df = 1, P>0·10; PVN: F = 0·1, df = 1, P>0·10; LH: F = 0·1, df = 1, P>0·10) (Fig. 4(b)).
As for the anorexigenic neuropeptides, we observed that the POMC distribution pattern was different between the groups. In the control group, POMC staining was stronger in the perinuclear region (Fig. 5(a), (b) and (c)), while in the EW group, POMC staining was more distributed along the perinuclear region, as well as in fibres (arrows in Fig. 5(d), (e) and (f)). The quantification of POMC-positive cell bodies showed no significant difference between the groups in all three nuclei (ARC: F = 1·1, df = 1, P>0·10; PVN: F = 2·5, df = 1, P>0·10; LH: F = 3·6; df = 1, P>0·10) (Fig. 6(a)).

Fig. 5 Immunohistochemistry for anorexigenic neuropeptides pro-opiomelanocortin (POMC) and cocaine- and amphetamine-regulated transcript (CART) in the arcuate nucleus (ARC), paraventricular nucleus (PVN) and lateral hypothalamus (LH) at postnatal day 180. (a)–(f), Confocal images of POMC antibody, counterstained with 4′,6-diamidino-2-phenylindole (DAPI); (g)–(l), confocal images of CART antibody, counterstained with DAPI. (a)–(c) and (g)–(i), control (C) animals; (d)–(f) and (j)–(l), early-weaned (EW) animals; (a), (d), (g) and (j), ARC; (b), (e), (h) and (k), PVN; (c), (f), (i) and (l), LH. → , POMC-positive fibres in EW offspring, not observed in control offspring. In addition, CART immunoreactivity was less intense in the ARC and PVN regions of EW animals, in comparison with control animals. Calibration bar: 50 μm.

Fig. 6 Quantitative data concerning anorexigenic neuropeptides pro-opiomelanocortin (POMC) and cocaine- and amphetamine-regulated transcript (CART) in the arcuate nucleus (ARC), paraventricular nucleus (PVN) and lateral hypothalamus (LH) at postnatal day 180. (a) Number of POMC-positive cell bodies. (b) Number of CART-positive cell bodies. (□), Control group; (■), early-weaned group. Values are means (four rats per group), with standard errors represented by vertical bars. * Mean value was significantly different from that of the control group (P < 0·05).
CART-positive cells in EW offspring showed a qualitative reduction in their immunoreactivity in comparison with CART-positive cells in the control group in the ARC and PVN nuclei (Fig. 5(g) and (h); Fig. 4(j) and (k)). In addition, the quantitative analysis showed a reduction of CART-positive cells only in the PVN (F = 9·1; df = 1; P = 0·023); in the ARC, the difference approached significance (F = 4·3; df = 1; P = 0·083). The LH showed no difference in the number of CART-positive cells between the groups (F = 2·1; df = 1; P>0·10) (Fig. 6(b)).
The total amount of NPY in the hypothalamus of P180 animals, observed by Western blot, corroborates the findings obtained with the immunohistochemistry, in which EW offspring showed an increase of 68 % (P < 0·05) when compared with the control group (Fig. 7). CART presented a significant reduction of 38 % (P < 0·05) of its total protein content in EW offspring. However, AgRP and POMC protein contents in the hypothalamus of EW offspring were not significantly different from those of controls (data not shown).

Fig. 7 Hypothalamic neuropeptide Y (NPY) and cocaine- and amphetamine-regulated transcript (CART) protein content at postnatal day 180 (P180). Representative blots (a) and optical density of NPY (b) and CART (c) protein expression evaluated by Western blot in the hypothalamus. (□), Control group; (■), early-weaned (EW) group. Values are means (six rats per group), with standard errors represented by vertical bars. * Mean value was significantly different from that of the control group (P < 0·05).
Discussion
In the present study we have shown that early weaning during a short period at the end of the lactation period can affect central mechanisms that regulate food intake and energy homeostasis, consequently inducing metabolic changes in adulthood. Our present findings lend support to the proposed hypothesis that milk ingestion is a particularly important priming factor regarding future development( Reference Remmers and Delemarre-van de Waal 16 ). It is possible that a lack of macronutrients, hormones or even some micronutrients present in the milk is the main reason for the alterations observed in the present study.
As previously reported( Reference Lima Nda, de Moura and Passos 14 ), animals submitted to early weaning displayed, at P21, lower body mass, shorter length, lower total body and visceral fat mass, hypoglycaemia, hypoinsulinaemia and hypoleptinaemia. In adulthood, these animals were programmed for overweight and also presented hyperphagia concomitantly with hyperleptinaemia, suggestive of leptin resistance. This resistance was confirmed by changes in hypothalamic leptin signalling in EW rats, which presented lower Janus tyrosine kinase 2 (JAK-2) and phosphorylated signal transducer and activator of transcription-3 (pSTAT-3) protein contents and higher suppressor of cytokine signalling-3 (SOCS-3)( Reference Lima Nda, de Moura and Passos 14 ). The present data showed that the interruption of lactation permanently altered the hypothalamic circuitry in the short and long term. We showed an increase in NPY content at P21 in the hypothalamus, and, in adulthood, the effects were most prominently observed in NPY and CART expression, particularly in the PVN. No effect was observed regarding AgRP expression and only a different pattern of neuronal distribution of POMC was observed.
NPY plays an active role in energy homeostasis, stimulating food intake( Reference Beck 29 – Reference Dube, Xu and Crowley 32 ). In response to food restriction, NPY levels increase while those of leptin decrease( Reference Korner, Savontaus and Chua 33 – Reference Yoshihara, Honma and Honma 35 ). Blocking access to milk at the end of lactation results in an abrupt food restriction to the pups. Thus, the observed higher NPY hypothalamic content in 21-d-old EW pups, concomitantly with hypoleptinaemia, is in accordance with the aforementioned effects of food restriction. It is interesting that these hypothalamic alterations regarding NPY remained well into adulthood, as confirmed by immunohistochemistry in the PVN and Western blot in the whole hypothalamus. These data may justify the hyperphagia previously observed in EW animals( Reference Lima Nda, de Moura and Passos 14 ). Since these animals were also hyperleptinaemic, it was supposed that NPY levels could be lower, supporting our leptin resistance hypothesis.
The immunohistochemistry assays showed a denser NPY-positive fibre network in the ARC, PVN and LH of adult EW rats, and these fibres were apparently thicker than those in the control group. Malnutrition is usually followed by leptin deficiency, and is associated with the expression of some proteins related to developmental processes, cytoskeleton, cell adhesion and tissue remodelling, especially in the PVN( Reference Coupé, Amarger and Grit 36 ). These proteins are known to be involved in axon guidance, target recognition and synapse formation. The PVN receives some of the densest innervation by NPY fibres and, more specifically, by those originating from the ARC( Reference Broberger, Johansen and Johansson 37 ). In rats, projections from the ARC to the PVN and the LH during development are in place by postnatal day 16( Reference Bouret, Draper and Simerly 21 , Reference Bouret and Simerly 22 , Reference Grove and Smith 38 ), just 2 d before the lactation was interrupted in the EW group. At postnatal day 14, before the maturation of NPY projections, there is a peak of NPY mRNA followed by a decrease at postnatal day 17( Reference Delahaye, Breton and Risold 39 ). This NPY decrease could be correlated, at this critical window of time, with the onset of the anorexigenic effect of leptin( Reference Bouret, Draper and Simerly 21 ). At this time, leptin may restrict NPY fibres in order to specify projection patterns( Reference Bouret and Simerly 22 ). Since, at postnatal day 16, NPY fibres have already arrived in the PVN and in the LH( Reference Bouret, Draper and Simerly 21 , Reference Bouret and Simerly 22 ), it is reasonable to suppose that in our model, in which early weaning starts at postnatal day 18, this event is not be impaired. However, the refinement of these projections, a process modulated by leptin, could still be affected, since EW animals have a reduction in leptinaemia at P21( Reference Lima Nda, de Moura and Passos 14 , Reference Grayson, Kievit and Smith 40 – Reference Schmidt, Fritz and Scholch 43 ).
Concerning POMC, there was no difference in the total amount of protein in the hypothalamus at P21 and P180, and the number of POMC-positive cells was not altered in the nuclei analysed. However, its distribution pattern in the hypothalamic nuclei of EW adult offspring was altered. In the control group, the staining was located in the perinuclear region of the cell bodies, while in EW animals the staining observed in the cell bodies was weaker in comparison with that in the control group. On the other hand, in the EW group, staining was also observed in the fibres, a finding that was not present in the control group. POMC can appear on the fibres if there is an inhibition of its cleavage in the cell body( Reference Pritchard, Turnbull and White 44 , Reference Pritchard, Oliver and McLoughlin 45 ). This could happen because the prohormone convertases, which cleave POMC into adrenocorticotropic hormone (ACTH) and melanocyte-stimulating hormone, are leptin-dependent enzymes( Reference Fox, Vella and Good 46 , Reference Wardlaw 47 ). Since EW animals do display central leptin resistance( Reference Lima Nda, de Moura and Passos 14 ) in spite of the unchanged POMC expression, it is conceivable that leptin was able to regulate POMC distribution by acting through the prohormone convertases.
We observed a reduced CART-positive cell number in the PVN, a less intense immunoreactivity of CART-positive cells both in the PVN and in the ARC, and a reduction in total hypothalamic protein content in EW offspring. These results are consistent with previous studies that have reported a decrease in CART levels in obese rats presenting leptin resistance( Reference Tian, Li and Shi 48 , Reference Yu, South and Wang 49 ).
Different models of early weaning have already been studied( Reference Bonomo, Lisboa and Pereira 8 , Reference dos Santos Oliveira, de Lima and da Silva 11 , Reference Kowalski, Ster and Smith 50 ). Maternal deprivation could be considered as one of the imprinting factors in early weaning. In experiments of 24 h deprivation of maternal interaction at postnatal days 2, 10 or 15, an increase in NPY mRNA expression in the ARC was observed, which was abolished after intragastric infusion of milk, but not water, during the maternal separation( Reference Kowalski, Ster and Smith 50 ). These findings suggest that the increase in NPY is due to malnutrition by milk deprivation, instead of other stress factors such as the loss of maternal interaction. In the present study we did not separate the mother from the pups. We only blocked the access of the pups to the dam teats. This could cause some degree of stress, but based on the fact that corticosterone was normal in P21 pups (data not shown), it is unlikely that stress is more important than milk deprivation. The present results help to demonstrate how important milk ingestion is during the postnatal period, even at a time when pups can already feed themselves by eating the chow provided. Even the short period of milk access restriction at the end of the lactation period was capable of causing offspring malnutrition. It can also be said that their hypoleptinaemia was due, at least in part, to the absence of milk transfer and to the pups' lower adipogenesis.
In another model of programmed overweight, in which we reduced litter size, we observed a hypothalamic leptin resistance and unchanged POMC expression in the adult rats, findings that were very similar to those observed in the present model. Conversely, we observed lower NPY protein content( Reference Rodrigues, de Moura and Passos 51 ). Thus, it is not always that leptin resistance in adulthood has the same hypothalamic phenotype. As in the litter size reduction model, leptin is higher at weaning. It is possible that NPY levels at adulthood are more dependent on serum leptin in the weaning period. In a model of maternal protein restriction during gestation and lactation, Cripps et al. ( Reference Cripps, Martin-Gronert and Archer 52 ) have shown that hypoleptinaemia during lactation is associated with higher NPY mRNA expression in the ARC in pups aged 22 d.
The present data lend support to the hypothesis that leptin is a key developmental signal. Its deficiency in the critical period at the end of lactation, where leptin starts to have its anorexigenic effect, modifies the architecture of NPY hypothalamic circuits, with further programming of both leptin signalling and CART inhibition associated with NPY increase, especially in the PVN. Since this nucleus is important for the releasing of pituitary regulatory hormones, these alterations may have other important hormonal consequences. It is noteworthy that a period of 3 d of suppression of suckling in a total of 21 d of lactation in rats is roughly equivalent to 1 month in 7 months of breast-feeding in humans. Thus, even this very short period of breast-feeding interruption in humans may have severe consequences for the neuronal orexigenic–anorexigenic circuitry development.
Acknowledgements
The present study was supported by the ‘National Council for Scientific and Technological Development’ (Conselho Nacional de Desenvolvimento Científico e Tecnológico; CNPq), the ‘Carlos Chagas Filho Research Foundation of the State of Rio de Janeiro’ (Fundação Carlos Chagas Filho de Amparo à Pesquisa do Estado do Rio de Janeiro; FAPERJ) and Coordination for the Enhancement of Higher Education Personnel (Coordenação de Aperfeiçoamento de Pessoal de Nível Superior; CAPES). V. Y.-R. and E. de O. were recipients of CAPES fellowships and N. da S. L. was a recipient of a FAPERJ fellowship. We also thank Ms Mônica Moura, Mr Ulisses Siqueira and Mr Carlos Alberto Guimarães for technical assistance in the laboratory and Ms Patrícia Martinez for technical assistance in confocal microscopy. E. de O., N. da S. L., V. Y.-R., P. C. L. and E. G. de M. designed the experiments. V. Y.-R. and N. de S. L. were responsible for animal programming, immunohistochemistry and molecular procedures. All the authors participated in analysis, interpretation of data, and elaboration of the article or revising it. All authors contributed to and approved the final manuscript. There are no conflicts of interest.


