


Obesity has become the most common metabolic and nutritional disorder in developed countries, and represents one of the most prevalent risk factors for the development of common chronic metabolic diseases, such as atherosclerosis and diabetes(Reference Friedman1). One of the major issues in the field of obesity research is the question of why some humans easily become obese (obesity prone, OP) and others resist the development of obesity (obesity resistant, OR) when exposed to high-energy diets. Once exposed to a high-energy diet, OR and OP subjects differ markedly in their regulation of food intake and metabolic efficiency. Although several hypotheses have been proposed, the mechanisms underlying inter-individual susceptibility to diet-induced obesity (DIO) remain to be fully defined. A large number of factors including physiological signalling and responsiveness, metabolic processes, and genetic differences have been associated with susceptibility to obesity(Reference Chang, Graham and Yakubu2, Reference Levin, Hogan and Sullivan3).
Different strains of rats are known to differ in their susceptibility to dietary obesity(Reference Chang, Graham and Yakubu2). The model of DIO in Sprague–Dawley rats is of special interest with regard to the regulation of energy homeostasis. When fed a diet moderately high in fat, about half of the rats develop DIO, whereas the rest are diet resistant(Reference Chang, Graham and Yakubu2). In the search for an explanation for the differing propensities for obesity susceptibility in rats fed a high-fat diet (HFD), blood and several tissues, such as hypothalamus, adipose tissues and skeletal muscle, have been targeted in rodent models in this laboratory.
Compared with OR rats, OP rats have several deficits in central nervous system function. Levin & Sullivan(Reference Levin and Sullivan4) pointed out that glucose-induced noradrenaline (NA) levels are closely associated with obesity resistance. They have found that plasma NA levels after a glucose load in OR rats were lower than those in OP rats, providing a positive correlation between NA levels and subsequent weight gain. OP rats have a diminished rate of NA clearance from the plasma, whereas OR rats require less sympathetic activation because of their increased sensitivity to NA. These results suggest that the balance between pre- and post-synaptic NA actions appears to be a critical factor in the differentiation of OP from OR rats, and may be important in their body-weight gain patterns on HFD(Reference Flanagan, Brown and Santiago5–Reference Levin, Triscari and Sullivan8). It has also been demonstrated that OR rats have a greater glucose-induced stimulation of their sympathetic nervous system than OP rats. Taken together, glucose and insulin metabolism and their interface with the sympathetic nervous system appear to be important determining factors with regard to which animals might be predisposed to resist the development of DIO(Reference Levin and Sullivan4).
Involvement of enhanced fat oxidation and oxidative capacity in skeletal muscle in resistance to DIO has been reported. Increased fat metabolism in muscle may contribute to the obesity resistance of rodents, enabling circulating lipids elevated by diet to be oxidised in the muscle rather than deposited in the adipose tissue(Reference Alexander, Chang and Dourmashkin9, Reference Abou Mrad, Yakubu and Lin10). A relationship has been supposed between the composition of skeletal muscle and susceptibility or resistance to HFD-induced obesity(Reference Alexander, Chang and Dourmashkin9). It has been demonstrated that an average daily respiratory quotient in OR rats was significantly lower than that in OP rats, suggesting a greater daily oxidation of fat in OR rats(Reference Alexander, Chang and Dourmashkin9). A greater proportion of type I fibres has been reported to be associated with a greater capacity for fat oxidation, which would favour resistance to body fat accumulation(Reference Abou Mrad, Yakubu and Lin10).
Adipocytes from OP mice have greater sensitivity to insulin compared with those from OR mice because OP mice take up more glucose than OR mice, thereby increasing lipogenesis(Reference Eberhart, West and Boozer11). Defective oxygen consumption in brown adipose tissue also affects obesity development. Brown adipose tissue of obese rats has a diminished respiratory rate compared with that of lean rats due to the inability of the mitochondria to utilise NEFA for the production of enhanced oxygen consumption(Reference Levin, Finnegan and Marquet12). Recently, the liver has been targeted by many investigators to unravel the metabolic differences between OP and OR rats because it plays a pivotal role in lipid homeostatic response to feeding conditions(Reference Li, Xie and Lin13–Reference Hu, Qing and Chen16). In the present study, we hypothesised that differential expression of proteins in the liver is likely to contribute to this response. We thus performed proteomic analysis on liver proteins to assess which metabolic changes cause OP and OR propensity in rats fed a HFD.
Numerous proteomic studies in the liver of human subjects and rodents have been reported in order to provide a liver proteome dataset(Reference Gazzana and Borlak17, 18) and to find liver toxicity markers(Reference Thome-Kromer, Bonk and Klatt19). Also, in order to provide a strong basis for the investigation of liver pathobiology and for a better understanding, diagnosis and prevention of hepatic diseases, many improved methods for liver proteomic analysis have been demonstrated(Reference Gazzana and Borlak20–Reference de Roos, Rungapamestry and Ross26). However, a proteomic study to profile the differential expression of liver proteins in an attempt to distinguish the phenotypic difference between OP and OR has not yet been performed.
The goals of the present study were (1) to achieve a detailed understanding of molecular changes in response to HFD feeding in rat liver and (2) to find hepatic marker proteins determining the metabolic differences between OP and OR rats through identification of differentially expressed proteins in rat liver.
Materials and methods
Animals and breeding conditions
Male Sprague–Dawley rats, 5 weeks old, were purchased from Japan SLC (Hamamatsu, Japan) and were maintained in the animal facility at the Department of Biotechnology, Daegu University (Gyeongsan, South Korea). All rats were provided water and standard chow ad libitum for 1 week before the start of any experimental procedures in order to allow them to acclimatise to their new surroundings. Rats were raised in separate cages in order to exclude diverse effects among them. They were randomly divided into two groups: eight rats fed a low-fat diet (LFD, 12 % energy from fat) and thirty-seven rats fed on a HFD (45 % energy from fat). These feeds were purchased from Feed Korea Lab (Hanam, Kyungki, Republic of Korea), and the dietary composition of the LFD and HFD is shown in Table 1. The weights of the rats were recorded every alternative day for 56 d, and the HFD-fed rats were subdivided into OP (n 6) and OR rats (n 6) according to the highest and lowest body-weight gain, respectively. Rats were deprived of food for at least 12 h before killing, and they were anaesthetised with 3 % diethyl ether. These experiments were approved by the Committee for Laboratory Animal Care and Use of Daegu University. All procedures were conducted in accordance with the Guide for the Care and Use of Laboratory Animals published by the National Institutes of Health.
Table 1 Dietary composition of the experimental diets
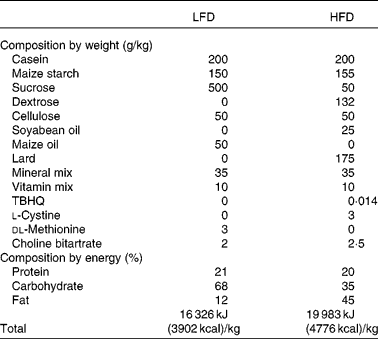
LFD, low-fat diet; HFD, high-fat diet; TBHQ, tertiary butylhydroquinone.
Plasma biochemical parameters
Blood samples were obtained by resection at the end of the rat tail under anaesthesia, and plasma was separated by centrifugation (3000 g, 10 min). Total cholesterol and HDL-cholesterol in plasma were enzymatically measured using commercial kits of Bio Clinical System Corporation (Anyang, Kyungki, Republic of Korea), and TAG and glucose were determined using enzymatic kits (Asan Phamaceutical, Seoul, Republic of Korea). NEFA were quantified using an enzymatic fatty acid quantification kit (Abcam, Cambridge, UK). They were measured according to the manufacturer's instructions.
Hepatic lipid contents
Hepatic lipids were extracted using the procedure developed by Folch et al. (Reference Folch, Lees and Sloane Stanley27). Briefly, 0·1 g liver samples were homogenised in 2 ml of 20 mm-potassium phosphate buffer. After adding 5 ml of chloroform and methanol (1:1) solution, the samples were incubated at 25°C for 1 h. Then, 2·5 ml of chloroform solution and 0·8 ml of 0·74 % potassium chloride solution were added to all the samples. The samples were centrifuged at 2000 g for 5 min. The resulting precipitates were transferred to new tubes, to which 0·72 ml of 0·74 % potassium chloride solution, 0·735 ml chloroform and 0·46 ml methanol were added. Mixed samples were dried under N2, and the dried lipid residues were dissolved in 1 ml ethanol for total cholesterol and TAG measurements. Triton X-100 and a sodium cholate solution were added to 0·2 ml of the dissolved lipid solution to produce final concentrations of 5 g/l and 3 mmol/l, respectively. Total cholesterol and TAG levels were determined using enzymatic kits (Asan Phamaceutical), according to the manufacturer's instructions.
Hepatic lipid metabolic enzyme activity
Fatty acid synthase (FAS) activity was measured in accordance with the method described by Nepokroeff et al. (Reference Nepokroeff, Lakshmanan and Porter28) by monitoring the malonyl-CoA-dependent oxidation of NADPH at 340 nm, where the activity is expressed as the oxidised NADPH nmol/min per mg protein. Malic enzyme activity was determined according to the process of Ochoa(Reference Ochoa, Colowick and Kaplan29) by viewing the production of NADPH at 340 nm, and the activity is expressed as the formation of NADPH nmol/min per mg protein. β-Oxidation activity was determined using the method of Lazarow(Reference Lazarow30) by monitoring the reduction of NAD to NADH at 340 nm, where the activity is expressed as the reduced NAD nmol/min per mg protein. Carnitine palmitoyltransferase (CPT) activity was determined according to the method described by Markwell et al. (Reference Markwell, McGroarty and Bieber31). The results are expressed as nmol/min per mg protein. Protein content was determined according to the method used by Bradford(Reference Bradford32) using bovine serum albumin as the standard.
Preparation of liver samples for two-dimensional gel electrophoresis
Liver tissues of the rats were isolated immediately after killing and then washed with a cold NaCl solution. The liver tissues were pulverised under liquid N2 and stored at − 80°C until use. The tissues were lysed in 0·3 ml rehydration buffer solution containing 7 m-urea, 2 m-thiourea, 4 % 3-((3-cholamidopropyl)dimethylammonio)-1-propane sulfonic acid, 20 mm-dithiothreitol, 1 mm-phenylmethanesulfonyl fluoride, 2 % IPG (immobilised pH gradients) buffer and a trace of bromophenol blue. Tissues were homogenised on ice using a homogeniser (PT 1200E; Kinematica Limited, Luzern, Switzerland). The homogenates were centrifuged at 14 000 g for 20 min; the supernatant was then stored at − 80°C until analysis. Protein content of the liver tissue was determined by the Bradford method(Reference Bradford32) using Bradford reagent (Sigma-Aldrich, St Louis, MO, USA).
Two-dimensional gel electrophoresis
IPG drystrips (18 cm, pH 3–10; Amersham Biosciences, Little Chalfont, Buckingham, UK) were used for isoelectric focusing (IEF); 150 μg of protein were adjusted to a volume of 0·35 ml with rehydration buffer solution, and the IPG drystrips were rehydrated overnight in a stripholder. IEF was then performed using the PROTEIN IEF cell (Bio-Rad, Hercules, CA, USA) according to the protocol suggested by the manufacturer. Following IEF, the strips were equilibrated in solution A, containing 6 m-urea, 2 % SDS, 30 % glycerol, 1 % dithiothreitol and 50 mm-Tris (pH 8·8) for 15 min, and then in solution B, same as A, replacing dithiothreitol with 2·5 % iodoacetamide, for an additional 15 min. Equilibrated IPG strips were then rinsed with electrophoresis buffer. The strips were placed on an 8 % (w/v) 20 × 20 cm SDS-polyacrylamide gel for resolution in the second dimension. Thereafter, two-dimensional gel electrophoresis was performed at a constant voltage of 15 mA per gel for 16 h; separated gels were then visualised using Ag staining(Reference Kim, Hwang and Baek33, Reference Kumar, Rahman and Lee34).
Image acquisition
Gels were scanned on a UMAX PowerLook 1120 (Maxium Technologies, Inc., Taipei, Taiwan), and the resulting images were converted to the tagged image file format before analysis. Intensity calibration was performed using an intensity step wedge before the gel image. Comparison of images was performed using a modified version of ImageMaster 2D software version 4.95 (Amersham Biosciences). A reference gel was selected at random from gels of the control group for each experiment, and spots detected from other gels in the control dataset were matched with those in the selected reference gel. Relative optical density and relative volume were also calculated in order to correct for differences in gel staining. Each spot intensity volume was processed by background subtraction and total spot volume normalisation; the resulting spot volume percentage was used for comparison(Reference Kim, Hwang and Baek33).
Enzymatic digestion of protein in gel
Using modified porcine trypsin, protein spots were enzymatically digested in gel in a manner similar to that described previously by Shevchenko et al. (Reference Shevchenko, Tomas and Havlis35). Gel pieces were washed with 50 % acetonitrile (ACN) to remove SDS, salts and stains. The gel was then dried in order to remove the solvent, rehydrated with trypsin (8–10 ng/ml) and incubated for 8–10 h at 37°C. The proteolytic reaction was terminated by the addition of 5 ml of 0·5 % trifluoroacetic acid. Tryptic peptides were recovered by combining the aqueous phase from repeated extraction of gel pieces with 50 % ACN. After concentration, the peptide mixture was redissolved in the buffer and desalted using C18ZipTips (Millipore, Watford, Herts, UK), and peptides were eluted with 1–5 ml of ACN. An aliquot of this solution was mixed with an equal volume of a saturated solution of α-cyano-4-hydroxycinnamic acid in 50 % ACN, and 1 μl of the mixture was spotted onto a target plate(Reference Kim, Hwang and Baek33, Reference Kumar, Rahman and Lee34).
Protein identification
For protein identification by peptide mass fingerprinting, protein spots were excised, digested with trypsin (Promega, Madison, WI, USA), mixed with α-cyano-4-hydroxycinnamic acid in 50 % ACN–0·1 % trifluoroacetic acid and subjected to matrix-assisted laser desorption/ionisation time-of-flight analysis (Ettan MALDI-TOF Pro; Amersham Biosciences, Piscataway, NJ, USA), as described by Fernandez et al. (Reference Fernandez, Gharahdaghi and Mische36). Spectra were collected from 350 shots per spectrum over the m/z range 600–3000 and calibrated by two-point internal calibration using trypsin autodigestion peaks (m/z 842·5099 and 2211·1046). Peak list was generated using the Ettan MALDI-TOF Pro Evaluation Module (version 2.0.16). Threshold used for peak-picking was as follows: 5000 for minimum resolution of monoisotopic mass, 2·5 for signal:noise ratio. The search program MASCOT, developed by Matrix Science (London, UK; http://www.matrixscience.com), was used for protein identification by peptide mass fingerprinting. The following parameters were used for database search: trypsin as the cleaving enzyme; a maximum of one missed cleavage; iodoacetamide (cystine) as a complete modification; oxidation (methionine) as a partial modification; monoisotopic masses; a mass tolerance of ± 0·1 Da. MASCOT probability-based molecular-weight-search score was calculated for peptide mass fingerprinting. Protein score is − 10 × log(P), where P is the probability that the observed match is a random event, and protein scores >61 are considered significant (P < 0·05)(Reference Kim, Hwang and Baek33, Reference Kumar, Rahman and Lee34).
Immunoblot analysis
Tissue lysates were prepared with radioimmunoprecipitation assay buffer (Sigma-Aldrich), homogenised and centrifuged at 12 000 g for 20 min. The extract was diluted in sample buffer (50 mm-Tris, pH 6·8, 2 % SDS, 10 % glycerol, 0·1 % bromophenol blue and 5 % β-mercaptoethanol) and heated for 5 min in a boiling bath. Samples were then subjected to SDS-polyacrylamide gel for electrophoresis and transferred to PolyScreen membranes (NEN, Boston, MA, USA). The membranes were subsequently blocked with 5 % non-fat dry milk in Tris-buffered saline (10 mm-Tris–HCl, 150 mm-NaCl, pH 7·5) containing 0·1 % Tween-20 (TBS-T). After washing with TBS-T, the membranes were probed with a primary antibody. The following antibodies were used in the present study: anti-rabbit adenosine monophosphate-activated protein kinase (AMPK); p-AMPK; acetyl-CoA carboxylase (ACC); p-ACC; FAS; CPT1 (Santa Cruz Biotechnology, Santa Cruz, CA, USA); anti-goat CES3; argininosuccinate synthetase 1 (ASS1); MDH (Santa Cruz Biotechnology); anti-mouse β-actin (Santa Cruz Biotechnology). After washing with TBS-T, the membranes were incubated for 2 h with horseradish peroxidase-conjugated anti-rabbit IgG, anti-goat IgG and anti-mouse IgG secondary antibody (1:1000; Santa Cruz Biotechnology), and was developed using enhanced chemiluminescence (Intron, Seoul, Republic of Korea). Western blot was analysed by scanning with a UMAX PowerLook 1120 (Maxium Technologies, Akron, OH, USA) and digitalisation using image analysis software (KODAK 1D, Eastman Kodak, Rochester, NY, USA).
Statistical analysis
All experimental results were compared by one-way ANOVA using the Statistical Package of Social Science (version 14.0K; SPSS, Chicago, IL, USA) program. Data are expressed as means with their standard errors. Group means were considered significant at P < 0·05, as determined by the technique of protected least-significant difference when ANOVA indicated an overall significant treatment effect (P < 0·05)(Reference Kumar, Rahman and Lee34).
Results
High-fat diet-induced obesity-prone and obesity-resistant phenotypes
Rats were randomly divided into two groups, with eight rats fed a LFD as the control group and thirty-seven rats fed a HFD, and the latter was subdivided into OP (n 6) and OR rats (n 6) according to their body-weight gain. Changes in body weight between the groups during the experimental period are shown in Fig. 1(a). Body weights of the rats were much the same at the beginning of the present study; however, they began to diverge after 4 weeks, such that OP rats were heavier (P < 0·01) than the normal controls and OR rats at all subsequent time points. Consequently, the total body weight of OP rats was higher by an average of approximately 25 % compared with OR rats (Fig. 1(b)). The concentration of plasma HDL-cholesterol was significantly lower in OP rats compared with that of OR rats, whereas TAG, glucose and NEFA levels were remarkably higher in OP rats than those in normal and OR rats (Table 2). Hepatic lipid levels showed a tendency to be higher in OP rats compared with normal and OR rats, and they were higher in OR rats than in normal rats (Table 2). In addition, activities of hepatic lipid metabolic enzymes were investigated in each group. Consequently, while CPT activity was significantly lower in OP rats compared with normal and OR rats, FAS, malic enzyme and β-oxidation activities were slightly higher in OP rats compared with those in OR rats, even though they did not reach statistical significance (Table 3).
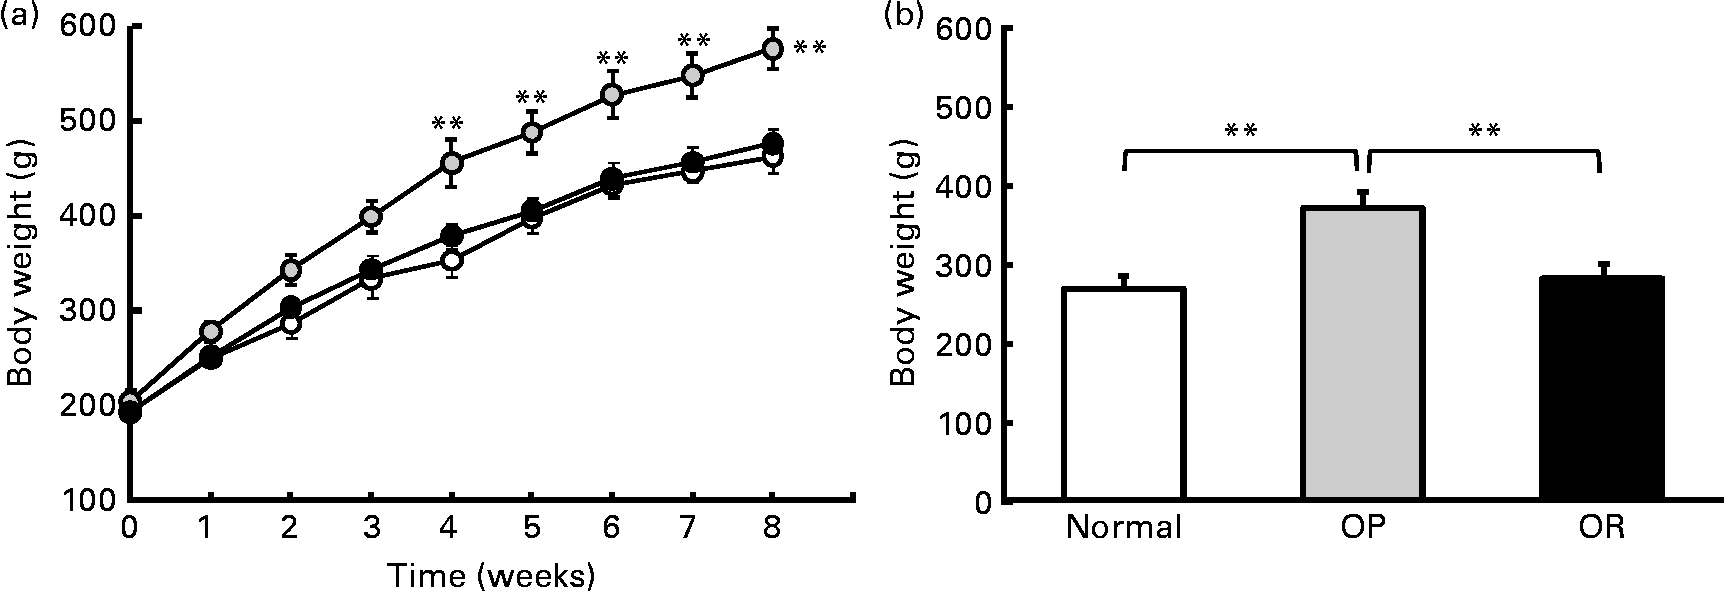
Fig. 1 High-fat diet (HFD)-induced obesity-prone (OP) and obesity-resistant (OR) phenotypes. (a) Body-weight profiles of normal rats fed a standard diet (low-fat diet) (![]() ) and OP (
) and OP (![]() ) and OR (
) and OR (![]() ) rats fed a HFD. (b) Total body-weight gain of normal, OP and OR rats (six animals per group). Values are means (six animals per group), with their standard errors represented by vertical bars (estimated using the ANOVA test). Mean values were significantly different between each group: **P < 0·01.
) rats fed a HFD. (b) Total body-weight gain of normal, OP and OR rats (six animals per group). Values are means (six animals per group), with their standard errors represented by vertical bars (estimated using the ANOVA test). Mean values were significantly different between each group: **P < 0·01.
Table 2 Plasma biochemical parameters and hepatic lipid profiles in normal, obesity-prone (OP) and obesity-resistant (OR) rats
(Mean values with their standard errors of three separate experiments)
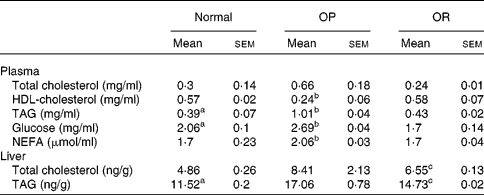
a,b,c Mean values with unlike superscript letters were significantly different between each group (P < 0·05).
Table 3 Hepatic lipid metabolic enzyme activity in normal, obesity-prone (OP) and obesity-resistant (OR) rats
(Mean values with their standard errors of three separate experiments)
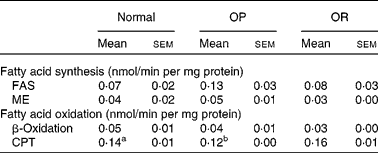
FAS, fatty acid synthase; ME, malic enzyme; CPT, carnitine palmitoyltransferase.
a,b Mean values with unlike superscript letters were significantly different between each group (P < 0·05).
Analysis of two-dimensional gel electrophoresis images of rat liver proteome
Liver proteins isolated from the most representative nine rats in the normal (n 3), OP (n 3) and OR groups (n 3) were individually arrayed using two-dimensional gel electrophoresis. In order to obtain more accurate results, two-dimensional gel electrophoresis analysis was performed twice on the proteins of each group; thus, a total of eighteen gels were used. Liver proteins were separated using IEF on an IPG strip (pH 3–10) for the first dimension and 8 % (w/v) SDS-PAGE gel for the second dimension. As a result, expression levels of approximately 400 spots were detected, ranging from 20 to 240 kDa mass between pH 3 and 10 (Fig. 2). Positions of all identified proteins on two-dimensional gel electrophoresis gels were in the expected range of their theoretical pI and molecular weights (Table 4). It was found that a total of eleven proteins were up-regulated, whereas seventeen proteins were down-regulated upon HFD feeding.

Fig. 2 Representative two-dimensional gel electrophoresis gel images of liver protein homogenate. Proteins were extracted and separated on IPG strips (pH 3–10) for the first dimension, followed by 8 % (w/v) PAGE for the second dimension. Differentially expressed proteins are indicated by arrows. Protein numbers in gels are listed in Table 4. MW, molecular weight.
Table 4 List of identified differentially expressed liver proteins in normal, obesity-prone (OP), and obesity-resistant (OR) rats fed a high-fat diet
(Mean values with their standard errors)

Mr, relative molecular mass; BCS1, butyryl coenzyme A synthetase 1.
Mean values were significantly different for normal, OP and OR rats: * P < 0·05, ** P < 0·01.
† Accession numbers are the NCBInr database accession numbers.
‡ The nominal mass is the integer mass of the most abundant naturally occurring stable isotope of an element. The nominal mass of a molecule is the sum of the nominal masses of the elements in their empirical formula.
§ Peptides are the number of m/z values matched from an in silico digest v. the number of m/z values unmatched.
∥ MASCOT probability-based molecular-weight search score calculated for peptide mass fingerprinting. Protein score is − 10 × log(P), where P is the probability that the observed match is a random event; it is based on the NCBInr database using the MASCOT searching program as MS/MS data and protein scores >61 are significant (P < 0·05).
¶ No. in gel refers to numbers in two-dimensional gel electrophoresis image of Fig. 2.
Changes in liver protein levels between obesity-prone and obesity-resistant rats
Image analysis and further statistical analysis allowed detection and identification of forty proteins whose differences showed prominence between the normal group and the HFD-fed groups (OP and OR). Among the forty differentially expressed spots, twelve proteins were significantly changed upon HFD feeding between the OP and OR groups: five proteins including esterase 22 (Es22) precursor ( − 3·14-fold, P = 0·0002), ASS1 ( − 1·83-fold, P = 0·0007), α1-anti-trypsin (A1AT) precursor ( − 2·58-fold, P = 0·0002), epoxide hydrolase 2 (EH2), cytoplasmic, isoform CRA-b ( − 3·37-fold, P = 0·0002) and malate dehydrogenase (MDH), cytoplasmic ( − 1·68-fold, P = 0·0006) were decreased, whereas seven proteins including glycogen phosphorylase (GP), liver form (2·21-fold, P = 0·0003), carboxylesterase 3 (CES3; 1·96-fold, P = 0·07 × 10− 3), aryl sulfotransferase (AST; 1·46-fold, P = 0·003), ornithine carbamoyltransferase (OCT) precursor (2·1-fold, P = 0·0002), butyryl coenzyme A synthetase 1 (BCS1; 2·08-fold, P = 0·0003), heat shock cognate 71 kDa protein (heat shock protein 70 (HSP70); 1·76-fold, P = 0·0003) and esterase D (ESD)/formylglutathione hydrolase (1·37-fold, P = 0·003) were increased in OP rats compared with normal and OR rats (Figs. 3 and 4; Table 4).

Fig. 3 Significantly increased liver proteins in obesity-prone (OP) rats compared with control and obesity-resistant (OR) rats. Zoom-in-gel images of each protein are shown with their average expression levels in three rats in each group. Values are means of volume density (%) of target spot in each group, with their standard errors represented by vertical bars. Mean values were significantly different for the expression level between each group, indicated by P values (ANOVA test). GP, glycogen phosphorylase; CES3, carboxylesterase 3; AST, aryl sulfotransferase; OCT, ornithine carbamoyltransferase; BCS1, butyryl coenzyme A synthetase 1; HSP70, heat shock proteins 70; ESD, esterase D.

Fig. 4 Significantly decreased liver proteins in obesity-prone (OP) rats compared with control and obesity-resistant (OR) rats. Zoom-in-gel images of each protein are shown with their average expression levels in three rats in each group. Values are means of volume density (%) of target spot in each group, with their standard errors represented by vertical bars. Mean values were significantly different for the expression level between each group, indicated by P values (ANOVA test). Es22, esterase 22; ASS1, argininosuccinate synthetase 1; A1AT, α1-anti-trypsin; EH2, epoxide hydrolases 2; MDH, malate dehydrogenase.
Validation of proteomic data using Western blot analysis
Although the present proteomic data indicated differential expression of proteins among the experimental groups, we could not exclude the possibility of technical errors and artificial effects in proteomic analysis. To address this issue, the expression patterns of some potential marker proteins, including CES3, MDH and ASS1, were further confirmed by immunoblot analysis. As shown in Fig. 5(a), expression levels of all tested proteins were firmly consistent with those of the proteomic study.

Fig. 5 Validation of (a) proteomic data for some proteins of interest and (b) differential expression patterns of seven metabolic liver proteins in normal, obesity-prone (OP) and obesity-resistant (OR) rats by immunoblot analysis. Band density was calculated by ImageMaster 2D software version 4.95, and relative intensity (%) demonstrated that values of target proteins were normalised to those of β-actin. Mean values were significantly different: *P < 0·05, **P < 0·01. CES3, carboxylesterase 3; MDH, malate dehydrogenase; ASS1, argininosuccinate synthetase 1; CPT1, carnitine palmitoyltransferase 1; AMPK, adenosine monophosphate-activated protein kinase; p-AMPK, phosphorylated-AMPK; ACC, acetyl-CoA carboxylase; p-ACC, phosphorylated-ACC; FAS, fatty acid synthase; UCP2, uncoupling protein 2.
Differential expression of lipogenic- and β-oxidation-related proteins between obesity-prone and obesity-resistant rats by Western blot analysis
We also examined differential expression patterns for some lipogenic- and β-oxidation-related proteins in the liver of each group, which could not be detected by proteomic analysis (Fig. 5(b)). FAS and ACC (active form p-ACC) were markedly decreased in OR rats, whereas AMPK (active form p-AMPK) was highly activated in OR rats, suggesting that fatty acid synthesis was obviously suppressed in the liver tissues of OR rats. CPT1, which is a rate-limiting enzyme in β-oxidation of fatty acid, was highly expressed in the OR rats compared with OP and normal rats. Unexpectedly, levels of uncoupling protein 2 (UCP2), as a negative regulator of reactive oxygen species production, in OP rats were higher than those in OR rats.
Discussion
In the present study, to address the question of which metabolic changes cause reduced adiposity and resistance to obesity in HFD-fed rats, the effect of the HFD on the expression of proteins in rat liver was analysed using a proteomic approach. Although several hypotheses have been proposed so far, the mechanisms underlying inter-individual susceptibility to DIO remain unclear. We therefore employed a proteomic approach for the examination of global protein expression change in the liver of rats fed a HFD, and the results were interpreted as showing a link to the propensity of obesity susceptibility.
To date, some proteomic studies of liver proteins in response to a HFD have been reported, focusing on the inflammation and cellular stress-related pathways(Reference de Roos, Rungapamestry and Ross26), the lipogenic pathway(Reference Jiang, Wang and Yu25) and non-alcoholic fatty liver disease(Reference Zhang, Yang and Guo23). Differential hepatic protein profiling in response to a HFD in mice has been established by Sanchez et al. (Reference Sanchez, Converset and Nolan37) who found that two proteins (glutathione S-transferase Yc and peroxiredoxin 1) were down-regulated and three proteins (glutathione synthatase, Se-binding protein 1 and glucose-regulated protein 75) were up-regulated upon HFD feeding in the liver of C57BL/6 mice. They drew a conclusion that HFD feeding led to an increase in the hepatic supply of NEFA, resulting in an increased production of mitochondrial reactive oxygen species and consequent up-regulation of proteins involved in the protection of oxidative stress. The down-regulation of some anti-oxidative proteins in the HFD-fed group from the present results (catalase) and those of Sanchez and colleagues (glutathione S-transferase Yc and peroxiredoxin 1) suggests that these proteins are probably not the determinants of obesity susceptibility.
Recently, Li et al. (Reference Li, Xie and Lin13) established integrated transcriptomic and metabolomic profiling of OP and OR rats fed a HFD. They drew a conclusion that OP rats may be involved in an increased activity of the sympathetic nervous system and the Krebs cycle, an increased production of ketone bodies and an adaptive regulatory process to store excess lipids in the liver through the reverse cholesterol transport process. Unfortunately, we failed to link the present proteomic results to their transcriptomic and metabolomic data due to a limited number of genes commonly showing differential expression between OP and OR rat liver, as described below.
The present proteomic study revealed that a total of twelve proteins were significantly expressed between OP and OR rats. Most of these proteins were previously unrecognised for differential expression in rodent liver in response to a HFD. Therefore, we considered these proteins as potential marker proteins for determination of phenotypes in the liver of OP and OR rats, which are discussed below in detail.
Proteins up-regulated in obesity-prone and down-regulated in obesity-resistant rat liver upon high-fat diet feeding
A total of seven proteins found in the liver tissue and identified for the first time in the present study showed up-regulation in OP rats while being maintained at low levels in normal and OR rats. Of particular interest in the present study was the up-regulation of GP, a key glycogenolytic enzyme, upon HFD feeding. In the diabetic liver, glucose production is increased, in part due to elevated glycogenolysis as a consequence of the enhanced activity of GP(Reference Moller38, Reference Zibrova, Grempler and Streicher39). In addition, hepatic GP activity was higher in obese Zucker rats than in lean animals, which suggested that enhanced glycogenolysis resulting from elevated GP levels might be a consequence of hepatic insulin resistance or of the dysregulation of an insulin counter-regulatory hormone(Reference Alemzadeh, Holshouser and Massey40). Moreover, increased GP activity has been reported to be a major contributing factor to impaired glycogen synthesis in hepatocytes from Zucker fatty fa/fa rats and could contribute to the lipogenic state(Reference Aiston, Peak and Agius41). The present findings from proteomic analysis are in line with these results showing that protein levels of GP in OP rats were also increased, suggesting that reduced levels of GP in OR rats would play a suppressive role in obesity development mediated by attenuation of insulin resistance.
Increased accumulation of fat in OP rats would subsequently promote expression of CES3, which converts a carboxylic ester to an alcohol and a carboxylate, and has recently been suggested to play a role in lipolysis(Reference Lehner and Verger42). Jernas et al. (Reference Jernas, Olsson and Arner43) recently demonstrated that expression of the CES1 gene is highly regulated in human adipose tissue, with increased levels in obese subjects and decreased levels during weight loss. CES3 has been recognised as having a major role in non-hormone-sensitive lipase activity in adipocytes and mediates some or all hormone-sensitive lipase-independent lipolysis in adipocytes(Reference Soni, Lehner and Metalnikov44). However, the correlation between CES3 expression and lipolysis in the liver of rodents or human subjects has not yet been reported. The present proteomic analysis of liver also pointed out for the first time that OR rats showed lower CES3 expression than OP rats. There appears to be no requirement for an increase in the level of CES3 in OR rats, indicating lower fat accumulation in these rats.
A significant up- and down-regulation of AST was observed in OP and OR rats, respectively. AST from rat liver is known to catalyse the reactions for the formation of sulphate esters, which is a major metabolic pathway for substrates bearing hydroxyl functional groups and serves as a means for the preparation of lipophilic xenobiotics for excretion(Reference Duffel and Jakoby45). A previous report has demonstrated that decreased AST expression is associated with resistance to rat hepatocarcinogenesis(Reference Ringer, Norton and Howell46). However, the metabolic function of AST in relation to obesity has not yet been addressed. The present proteomic analysis found for the first time that protein levels of AST were higher in OP rats and showed a progressive increase with weight gain while showing a decrease in both normal and OR rats. This led us to hypothesise that AST might be a plausible marker protein for indication of susceptibility to obesity.
We also found for the first time that increased levels of the OCT precursor are supposed to reflect the increased risk for obesity because significantly higher levels were detected in the liver of OP rats. OCT is one of the key enzymes in the urea cycle that catalyses the reaction between carbamoyl phosphate and ornithine to form citrulline and phosphate in the mitochondria of mammalian tissues(Reference Wraith47). Considering the function of this enzyme, no explanation for the difference in OCT precursor expression between OP and OR rats can be found in the present proteomic study. The present result is in line with the finding of Yamini et al. (Reference Yamini, Staples and Hansen48), showing that OCT levels were significantly affected by phenotype (obese greater than lean) of rats fed a diet containing high levels of carbohydrates(Reference Yamini, Staples and Hansen48). It has been postulated that high levels of OCT in the liver of OP rats might originate from accumulation of a higher concentration of NH3 in obese subjects.
Another interesting result from the present proteomic study is the appearance of high levels of BCS1 in OP rats. BCS1 belongs to the family of ligases whose other names in common use are acyl-CoA synthetase medium-chain family member 1 (ACSM1) and butyrate-CoA ligase. BCS1 was thought to function as an acyl-CoA synthetase, which is involved in the fatty acid metabolism(Reference Haketa, Soma and Nakayama49). Overexpression of acyl-CoA synthetase induces lipid deposition in hepatic cells and in the liver of rodents in vivo (Reference Li, Mashek and An50), and is an indicator of hypertension in rats(Reference Haketa, Soma and Nakayama49). In the present study, increased levels of BCS1 in the liver of OP rats probably resulted from high fat accumulation in obese subjects with a hypertensive state, suggesting that ACSM1 can be used as a marker protein for prediction of obesity risk.
Increased expression of some HSP in obese rodent models or human subjects has been reported in many earlier studies(Reference Schlesinger51, Reference Kim, Sohn and Ahn52). HSP are a class of functionally related proteins whose expression is increased when cells are exposed to elevated temperatures or other stress. Among them, HSP70 is a constitutively expressed chaperone that is also inducible by heat shock stress. It binds to nascent polypeptides to facilitate correct folding and also participates in the formation and repair of higher-order protein structures(Reference Tsukahara, Yoshioka and Muraki53, Reference Egerton, Moritz and Druker54). HSP70 has been used as a molecular target for diagnosis and treatment of several diseases(Reference Gaston55). In the present study, levels of HSP70 were higher in OP rats, whereas reduced levels were found in normal and OR rats. Previously, we also found a significant increase in HSP27 in HFD-induced obese rat skeletal muscle(Reference Kim, Joo and Choi56). The present study for the first time provides a link of this protein to risk of obesity, particularly to strong predictors of susceptibility to obesity.
Of particular interest to us in the present study was the up-regulation of ESD upon HFD feeding. ESD is a member of the non-specific esterase family, whose members are defined by their reaction with synthetic O-acyl ester substrates(Reference Lee, Wheatley and Benedict57). Findings showing that the highest levels of this enzyme were found in liver compared with other tissues implied that ESD might play a role in the detoxification process(Reference Lee, Wheatley and Benedict57). Due to its polymorphic nature, ESD has been used as a genetic marker for the diagnosis of hereditary retinoblastoma(Reference Lee, Wheatley and Benedict57). To date, no evidence has linked its expression to obesity development. In the present study, OP rats showed higher ESD expression than normal and OR rats, implying their potential role in obesity. However, the physiological significance of this change remains to be determined.
Proteins down-regulated in obesity-prone and up-regulated in obesity-resistant rat liver upon high-fat diet feeding
Analysis of liver samples resulted in the identification of five proteins that were down-regulated upon HFD feeding in OP rats but up-regulated in normal and OR rats. Most of these proteins were previously not recognised for differential expression in the liver in response to a HFD. In the present study, the level of difference in two esterases (ESD and Es22) failed to show any consistent pattern between OP and OR rats in response to HFD feeding. We detected down-regulation of the Es22 precursor in OP rats but not in OR rats. However, as mentioned earlier, the expression pattern of ESD was the opposite. Since Es22 is an enzyme that hydrolyses retinyl ester-stored excess dietary vitamin A after esterification with fatty acids, overexpression of Es22 attenuates the formation of cellular retinyl ester stores. In hepatocytes, retinyl esters are hydrolysed, and unesterified retinol is associated with retinol-binding protein 4 for secretion, which is one of the key players in insulin resistance(Reference Schreiber, Taschler and Wolinski58). Consistent with this, abnormal expression of this enzyme may be closely linked to causes of metabolic diseases such as diabetes and obesity. The present proteomic analysis revealed that protein levels of the Es22 precursor were decreased in the liver of OP rats compared with those in OR and normal rats, suggesting the possibility that this protein caused reduced adiposity and resistance to obesity development in OR rats.
ASS1 is a main rate-limiting enzyme in the urea cycle and plays a role in NH3 detoxification, which occurs in the liver(Reference Husson, Brasse-Lagnel and Fairand59). In the present study, the results of the down-regulation of ASS1 argue strongly against the result of the up-regulation of another urea cycle enzyme OCT in obese rats(Reference Engel, Hohne and Haberle60). This opposite regulation mode implies that the urea cycle is not an influencing factor in determining obesity susceptibility despite the significantly differential expression between OP and OR rats. To the best of our knowledge, there is no report to correlate ASS expression with obesity or other metabolic syndromes.
A significant down-regulation of the A1AT precursor in OP rats upon HFD feeding is an important outcome of the present study. A1AT is a serine protease inhibitor that is synthesised in and secreted from the liver(Reference McLean, Greene and McElvaney61), and has been reported to play important roles in immunoregulation, anti-inflammatory response and liver function(Reference Kaushal, Annamali and Blomenkamp62, Reference Nemeth63). For example, A1AT deficiency is associated with liver diseases such as cirrhosis. A1AT is favoured over restitution as the protease released by leucocytes during the inflammatory response to hepatocytic necrosis; therefore, it may play a role in the prevention of cirrhosis(Reference McLean, Greene and McElvaney61). The present proteomic analysis revealed down-regulation of the A1AT precursor in the liver of OP rats. This is the first finding to suggest the possibility that maintenance of high levels of A1AT in the liver of rodents may cause resistance to obesity.
We also found that down-regulation of EH2 and MDH indicates a higher risk for obesity development. EH2 belongs to the family of EH whose main functions include detoxification, catabolism and regulation of signalling molecules(Reference Decker, Arand and Cronin64). Although detoxifying activity is one of the main functions of EH, interestingly, yet paradoxically, inhibition of EH has been reported to be a potential therapeutic treatment for several diseases(Reference Morisseau and Hammock65). As signalling lipids, lipid-derived epoxides have diverse functions in the regulatory processes, such as cell proliferation, control of blood pressure and inflammatory processes. Therefore, abnormal regulation of EH can cause dysfunction of the liver.
MDH catalyses the oxidation of cytoplasmic malate to oxaloacetate and thereby produces reducing equivalents(Reference Schmid, Converset and Walter66). The cytoplasmic form of MDH is involved in de novo fat synthesis by providing extra mitochondrial-reducing equivalents from the oxidation of malate. Its activity has been reported to be significantly lower in adipose tissue of obese mice compared with their lean littermates(Reference Sanchez, Converset and Nolan37, Reference Hastings and Hill67). Taken together, the suppressive role of these two proteins under HFD conditions suggests their potential as biomarkers for risk of obesity.
Difference in lipogenic and β-oxidation enzymes between obesity-prone and obesity-resistant rats
It is recognised that feeding the HFD to rats increases uptake of lipids in the liver and increases hepatic synthesis of NEFA, as well as decreases NEFA β-oxidation in the liver(Reference Lavoie and Gauthier68). In the present study, down-regulation of AMPK and CPT1 as well as up-regulation of ACC and FAS in the liver of OP rats is the key result. We focused on the difference in the expression of AMPK, which plays an important role in the regulation of energy homeostasis. A recent study has indicated that AMPK is a key modulator of lipid metabolism(Reference Lage, Dieguez and Vidal-Puig69). The pathway that is central to the integrated effects of AMPK in liver tissues in the reduction of obesity risk and insulin resistance is the stimulation of fatty acid oxidation(Reference Kahn, Alquier and Carling70). In the liver, AMPK phosphorylates ACC, activates malonyl-CoA decarboxylase and suppresses the gene expression of lipogenic enzymes, such as ACC1 and FAS(Reference Woods, Azzout-Marniche and Foretz71). Activation of AMPK stimulates hepatic lipid oxidation mainly through a reduction in malonyl-CoA and thereby inhibits CPT1, a rate-limiting step for the entry of long-chain fatty acyl-CoA into the mitochondria for β-oxidation(Reference Lage, Dieguez and Vidal-Puig69, Reference Kahn, Alquier and Carling70, Reference Nguyen, Leray and Diez72). In the present study, we observed a reduction in the protein content of activated AMPK in the liver of OP rats fed a HFD, which thereby resulted in decreased β-oxidation of fatty acids (Fig. 5).
Collectively, susceptibility to obesity development in rats under HFD may, at least in part, result from differences in the regulation of key lipogenic and β-oxidation enzymes. In this regard, we hypothesised that OP rats undergo slow fat oxidation, thereby leading to excessive accumulation of dietary fat in liver tissues, compared with OR rats. To test this hypothesis, we next examined the expression patterns of UCP2 between the OP and OR groups by Western blot analysis. Although UCP2 activity has been recognised as an intracellular regulator of oxidative stress and thermogenesis, its exact role remains controversial(Reference Baffy73, Reference Horimoto, Fulop and Derdak74). UCP2 is identified as a fatty acid-responsive mitochondrial inner membrane carrier protein showing a wide tissue distribution with a substantially increased presence in fatty liver(Reference Baffy73). The role of UCP2 in energy dissipation differs among tissues, and the contribution of UCP2 to uncoupling of oxidative phosphorylation in hepatocytes is limited(Reference Horimoto, Fulop and Derdak74). UCP2 as a negative regulator of reactive oxygen species production has successfully been tested in a variety of experimental settings. The absence of UCP2 was associated with increased oxidative stress(Reference Horimoto, Fulop and Derdak74–Reference Petzke, Riese and Klaus77). In the present study, in line with earlier findings, higher UCP2 expression was observed in the liver of rats fed a HFD (OP rats). However, interestingly, OR rats showed the lowest UCP2 expression among the three groups, suggesting an alleviated state of oxidative stress. Taken together, it can be suggested that UCP2 in hepatocytes did not contribute to the prevention of HFD-induced obesity.
Acknowledgements
The present study was supported by the Midcareer Researcher Programme (grant no. R01-2008-000-10277-0) and SRC programme (Center for Food and Nutritional Genomics: grant no. 2010-0001888) of the National Research Foundation of Korea funded by the Ministry of Education, Science and Technology. The authors declare that they have no conflict of interest. X. W. and J.-W. C. carried out the proteomic analysis and data analyses and interpretation. J. I. J., D. H. K., T. S. O. and D. K. C. established the obesity animal model. J. W. Y. is the project leader who was responsible for the planning of the present study and for writing the manuscript.


