


Nutritional factors during pregnancy influence fetal growth and neonatal outcomes. Furthermore, neonatal outcomes such as birth weight, size for gestational age or Ponderal Index affect perinatal morbidity, persistent short stature and are associated with fat mass and risk of metabolic syndrome later in life( Reference Whincup, Kaye and Owen 1 – Reference Roth and DiVall 4 ).
The fetus relies entirely on maternal vitamin D stores, and neonatal plasma concentration of 25-hydroxyvitamin D (25(OH)D) corresponds to 60–70 % of maternal stores( Reference Streym, Moller and Rejnmark 5 , Reference Weinert and Silveiro 6 ). As vitamin D deficiency is relatively common among women of child-bearing age, the prevalence of vitamin D deficiency in newborns is also relatively high( Reference Holick 7 ). Studies have shown that women with higher vitamin D status tend to give birth to heavier and longer babies and may be less likely to give birth to small-for-gestational-age (SGA) infants( Reference Gernand, Simhan and Klebanoff 8 , Reference Leffelaar, Vrijkotte and van Eijsden 9 ). On the other hand, two recent cohort studies did not find any association between umbilical cord blood or maternal 25(OH)D concentrations and neonatal anthropometric measures such as birth weight and Ponderal Index( Reference Dalgård, Petersen and Steuerwald 10 , Reference Kiely, O’Donovan and Kenny 11 ). Other studies have shown that vitamin D deficiency in pregnancy was associated with an increased risk of macrosomia and postnatal overweight( Reference Morales, Rodriguez and Valvi 12 ), as well as increased fat mass at ages 4 and 6 years( Reference Crozier, Harvey and Inskip 13 ), whereas a recent study did not find any association between 25(OH)D concentration at birth and the risk of overweight at the age of 7 years( Reference Jensen, Lundqvist and Sørensen 14 ).
Recent reviews and meta-analyses on the association between 25(OH)D during pregnancy and neonatal outcomes highlight heterogeneity between studies and conflicting results( Reference Kiely, O’Donovan and Kenny 15 , Reference Karras, Anagnostis and Naughton 16 ). In addition, most previous studies assessed 25(OH)D status in maternal blood during pregnancy, and a few have used measurements of cord blood 25(OH)D at delivery in relation to neonatal outcomes( Reference Weinert and Silveiro 6 , Reference Pérez-López, Pasupuleti and Mezones-holguin 17 – Reference Zhu, Tong and Hu 21 ). No previous study has used newborns’ 25(OH)D measurements of capillary blood from dried blood spots (DBS) to study the relation between vitamin D stores and neonate anthropometric outcomes. We had the opportunity to access comprehensive registers in combination with systematically collected biological material from neonates, which offered the possibility to study such associations in Denmark.
The aim of this study was therefore to examine the associations between neonatal 25(OH)D3 concentration measured from DBS and gestational age at birth, birth weight, Ponderal Index and size for gestational age among a large random sample of neonates born in Denmark.
Methods
Population
Using the Danish Personal Civil Registration (CPR) numbers, a random sample of 2865 individuals born in Denmark from 1 May 1981 to 31 December 2002 was selected from the Danish Civil Registration System. In addition, using the CPR numbers, individuals in the sub-cohort were linked to the Biological Specimen Bank for Neonatal Screening at Statens Serum Institut (SSI) for retrieval of DBS.
The initial criteria for being included in the study were that the individuals were required to be born in Denmark, and have accessible and sufficient biological material available from the DBS for the vitamin D analyses. Children from multiple pregnancies were included.
A flow chart of the selection of the included subjects is presented in Fig. 1.
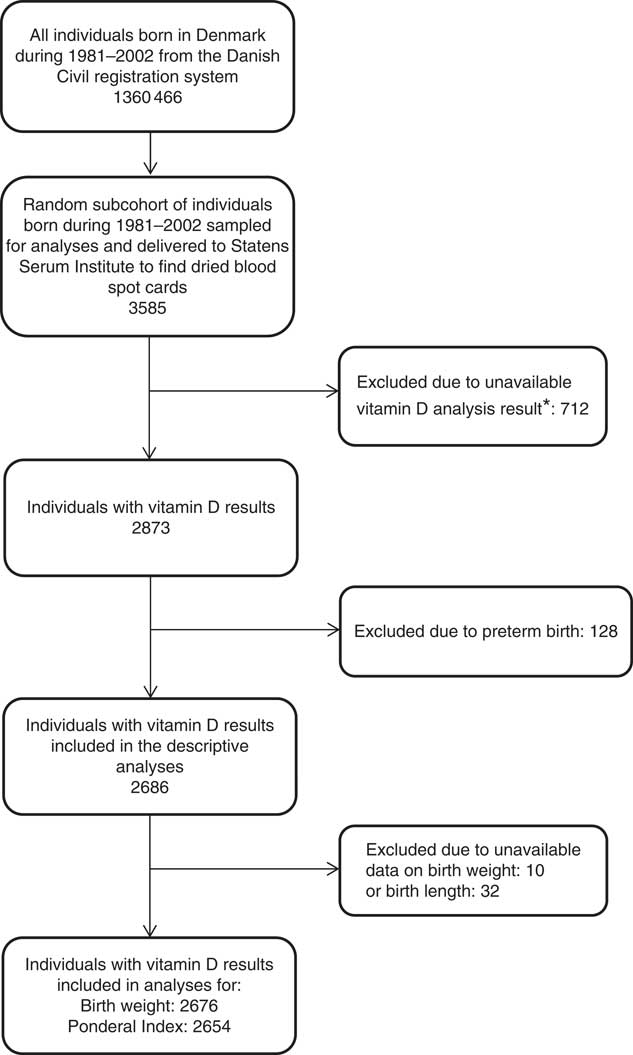
Fig. 1 Flow chart of the study population. *Dried blood spot cards were either not found, there was insufficient material for analysis or the analysis failed.
Neonatal vitamin D measures
In Denmark, every newborn undergoes heel-prick collection of capillary blood stored on filter paper (DBS card) in connection with a routine screening for congenital disease within 5–7 d after birth until 2009 and within 48–72 h after birth thereafter. The remaining blood on the DSB cards is then stored at the Biological Specimen Bank for Neonatal Screening at the SSI( Reference Nørgaard-Pedersen and Hougaard 22 ) at −20°C in a locked freezer. The concentrations of 25(OH)D2 and 25(OH)D3 were assessed from one 3·2-mm punch, taken half-way from the centre in the residual of the DBS card. Regardless of temperature and light exposure, storage times of the DBS cards for more than 20 years are not expected to bias inter-individual variation in concentrations( Reference Eyles, Anderson and Ko 23 ).
The sample preparation and assays were performed by the SSI using a highly sensitive liquid chromatography tandem mass spectroscopy assay( Reference Eyles, Anderson and Ko 23 ). The CV% for intra-assay and inter-assay variation for 25(OH)D2 ranged from 4 to 8 % and 9 to 18 %, respectively. For 25(OH)D3, the intra-assay and inter-assay CV% ranged from 7 to 12 % and 7 to 20 %, respectively, which is considered an acceptable precision for intra-assay and inter-assay analyses( Reference Eyles, Anderson and Ko 23 ). Laboratory investigators were blinded to the season of birth, as well as the outcome measurements. Currently no quality-assurance programmes for 25(OH)D measures in DBS were found, but the SSI laboratory participates in the Vitamin D External Quality Assessment Scheme with the equivalent-serum method( Reference Carter, Berry and Durazo-Arvizu 24 ).
The majority (91 %) of 25(OH)D2 concentrations were below the detection limit of 3 nmol/l, which led us to omit these analyses, and consequently only the concentrations of 25(OH)D3 (detection limit of 4 nmol/l) are reported here. These results are probably owing to the very few natural dietary sources for vitamin 25(OH)D2 and the fact that in Denmark vitamin 25(OH)D2 supplements are not recommended (25(OH)D3 supplements are recommended). To approximate sera values, the 25(OH)D3 concentrations have been corrected using an algorithm that takes into account the neonatal haematocrit (HCt) fraction for capillary blood: serum 25(OH)D3 (nmol/l)=DBS 25(OH)D3 (nmol/l)×1/(1−0·61 (HCt fraction))( Reference Eyles, Anderson and Ko 23 , Reference Kayiran, Ozbek and Turan 25 ). Serum 25(OH)D3 concentration was expressed in nmol/l and used as a continuous variable.
Anthropometric variables
Information from each individual on gestational age and anthropometric measures at birth was retrieved from the Danish Medical Birth Register (DMBR) maintained by Denmark Statistics. Gestational age at birth was based on gestational weeks. Birth weight in grams was used.
Owing to possible multicollinearity between birth weight and length, the Ponderal Index was used as an indicator of fetal growth. The Ponderal Index compares birth weight with length and is an assessment of fetal growth. To calculate Ponderal Index, the following formula was used: ((body weight in grams×100)/(birth length in cm3)). The mean Ponderal Index among term infants is usually about 2·5 g×100/cm3 ( Reference Roje, Banovic and Tadin 26 , Reference Juhl, Olsen and Andersen 27 ).
Another clinically relevant assessment of fetal growth is the use of categories of size for gestational age at birth, which, unlike birth weight that is independent of gestational age, provide additional information about fetal growth adjusted for sex and gestational age at birth using population references. To classify infant size in relation to gestational age, at first, the relevant International Fetal and Newborn Growth Consortium for the 21st Century (INTERGROWTH-21) references were considered to be used. However, they were found to largely overestimate the number of infants born large for gestational age (LGA) in our data; hence, Danish references were preferred( Reference Villar, Ismail and Victora 28 , Reference Marsal, Persson and Larsen 29 ). Those below the 10th percentile were considered SGA infants, and those above the 90th percentile of birth weight were considered LGA infants, adjusted for sex-specific gestational age using Danish references( Reference Marsal, Persson and Larsen 29 ).
Covariates
The DMBR includes information on maternal demographics and pregnancy characteristics such as maternal place of origin, maternal smoking status during pregnancy, maternal age, maternal education and parity. Maternal place of origin was dichotomised into European v. Non-European (according to maternal place of birth). Manual data collection regarding maternal smoking during pregnancy started in 1991, and women were categorised as either smoking or non-smoking during pregnancy. Since 1997, data were collected electronically and further categories were added: unknown, mother not smoking, mother smokes, mother stopped smoking in the first trimester, mother stopped smoking after the first trimester and mother smokes up to 5, 6–10, 11–20 or >20 cigarettes/d. Combining this information, maternal smoking was categorised into ever smoking (women who ever smoked during their pregnancy), never-smoking (women who never smoked during their pregnancy) or unknown. Maternal age at time of delivery was used as a continuous variable. Maternal education was categorised into Primary school, High school and University based on the highest education achievement level. On the basis of date of birth of the children, we defined season of birth as follows: Winter-born, between November and January; Spring-born, between February and April; Summer-born, between May and July; and Autumn-born, between August and October. Categorisation was based on the seasonal variation in serum 25(OH)D concentration among individuals from countries in northern latitudes( Reference Godang, Froslie and Henriksen 30 , Reference Hyppönen and Power 31 ). The reporting of parity changed during the study period. From 1973 to 1996, the DMBR only included information on live and still births, and to estimate parity we used the summarised estimates of total births and the actual birth. From 1996, parity was dichotomised into primiparous and multiparous.
Statistics
Analyses were restricted to children born at term, defined as between 37 and 44 weeks of gestation.
Restricted cubic spline regression models and likelihood ratio tests were used to assess possibility of non-linear associations between 25(OH)D3 and gestational age at birth, birth weight and Ponderal Index. Multinomial regression analyses were used to assess the associations between neonatal 25(OH)D3 and categories of size for gestational age (SGA and LGA). All regression models were adjusted for maternal place of origin, maternal smoking, maternal age, maternal education, year of birth and season of birth based on theoretical and biological plausibility. Sensitivity analyses defining gestational age based on gestational week −1 were run, as data on gestational age in the DMBR were previously found to be overestimated by 1 week (systematic error) compared with medical records( Reference Kristensen, Langhoff-Roos and Skovgaard 32 ). The associations between parity and neonatal vitamin D, gestational age at birth, birth weight and Ponderal Index is not yet well established. However, parity could potentially be a confounder; hence, sensitivity analyses adding parity to the model were performed.
The analyses and the graphics were produced using the statistical software package Stata 13 (2013, StataCorp LP; www.stata.com). Bases for the splines were computed by the ‘mkspline’ command. All splines had three knots, and the locations of the knots were at the 10th (concentration: 7·6 nmol/l), 50th (concentration: 23·7 nmol/l) and 90th (concentration: 51·8 nmol/l) percentiles of 25(OH)D3.
The significance level for all tests was set at 0·05.
The Danish National Committee on Biomedical Research Ethics Permission, as well as the steering committee from the biobank, gave permission to access and analyse the DBS samples from the Biological Specimen Bank for Neonatal Screening (J. no. H-3-2011-126). Permission from the Danish Data Protection Agency to merge biobank information with the information from the registers was granted (J. no.: 2012-41-116).
This study is part of the D-tect project, which is registered on clinicaltrials.gov: NCT03330301
Results
Vitamin D (25(OH)D3) measurements were available for a total of 2873 newborns. After exclusion of individuals born preterm, 2686 25(OH)D3 measurements were available (Fig. 1). The mean concentration of 25(OH)D3 was 27·2 (sd 18·3) nmol/l (ranging from 0·4 to 110 nmol/l).
The baseline characteristics of the study population are presented in Table 1.
Table 1 Maternal and offspring characteristics (Mean values and standard deviations; numbers and percentages)
AGA, appropriate for gestational age; SGA, small for gestational age; LGA, large for gestational age.
25-hydroxyvitamin D3 and gestational age at birth
The mean gestational age at birth was 39·8 (sd 1·3) weeks, ranging from 37 to 44 (n 2686).
Assessment of the fitted spline (Fig. 2) suggested an inverse linear association between 25(OH)D3 and gestational age at birth, which was confirmed by the statistical tests. The likelihood ratio test of an overall association indicated that the null hypothesis (the model including 25(OH)D3 is not better than the null model) could be rejected (P=0·003), and the likelihood ratio test of non-linearity indicated that the spline regression model did not fit the data better than the linear one (P=0·71). The linear model resulted in an inverse association between 25(OH)D3 concentration and gestational age at birth, with a decrease of 0·006 (95 % CI−0·009, −0·003, P<0·001) weeks of gestation per 1 nmol/l increase in 25(OH)D3 concentration (Table 2).
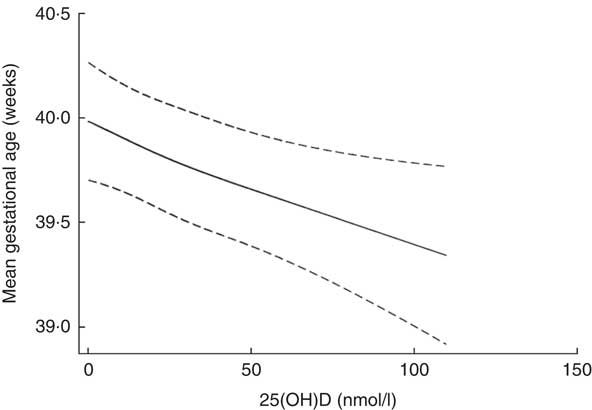
Fig. 2 Spline 25-hydroxyvitamin D3 (25(OH)D3) concentration (nmol/l) and gestational age (weeks) at birth after mutual adjustment for maternal place of origin, smoking, age, education, season and year of birth among a random sample of infants born at term (weeks 37–44) in the years between 1981 and 2002 in Denmark (n 2686).
Table 2 Multivariate linear regression analyses of the association between 25-hydroxyvitamin D3 (25(OH)D3) concentration (nmol/l) and gestational age at birth in weeks among a random sample of infants born at term (weeks 37–44) in the years between 1981 and 2002 in Denmark (n 2686)Footnote * (Coefficients with their standard errors and 95 % confidence intervals)
Ref., referent values.
* Analyses were performed after mutual adjustment for maternal place of origin, smoking, age, education, season and year of birth.
25-Hydroxyvitamin D3 and birth weight
The mean birth weight was 3532 (sd 507) g (n 2676). Boys had a higher mean birth weight than girls, 3612 (sd 512) g and 3448 (sd 487) g, respectively (P<0·001). Assessment of the fitted spline (Fig. 3) showed an inverted U-shaped association between 25(OH)D3 and birth weight, which was confirmed by the statistical tests. The likelihood ratio test of an overall association indicated that the null hypothesis could be rejected (P=0·04) and the likelihood ratio test of non-linearity indicated that the spline regression model fitted the data better than the linear one (P=0·01).
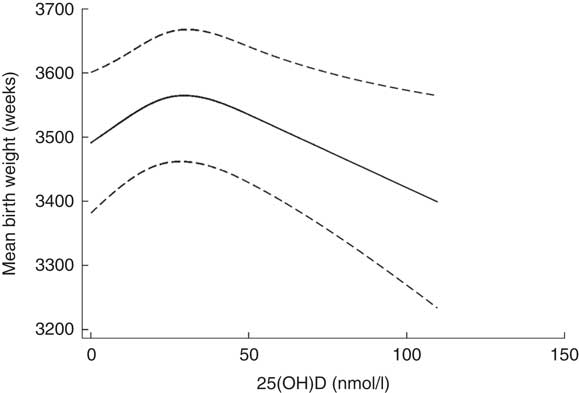
Fig. 3 Spline of 25-hydroxyvitamin D3 (25(OH)D3) (nmol/l) and birth weight (g) after mutual adjustment for maternal place of origin, smoking, age, education, season and year of birth among a random sample of infants born at term (weeks 37–44) in the years between 1981 and 2002 in Denmark (n 2676).
25-Hydroxyvitamin D3 and Ponderal Index
The mean Ponderal Index was 2·5 g×100/cm3 (sd 0·3), ranging from 1·8 to 3·5 g×100/cm3 (n 2654). Assessment of the fitted spline (Fig. 4) shows an inverted U-shaped association between 25(OH)D3 and Ponderal Index, which was confirmed by the statistical tests. The likelihood ratio test of an overall association indicated that the null hypothesis could be rejected (P=0·04) and the likelihood test of non-linearity indicated that the spline regression model fitted the data better than the linear one (P=0·01).
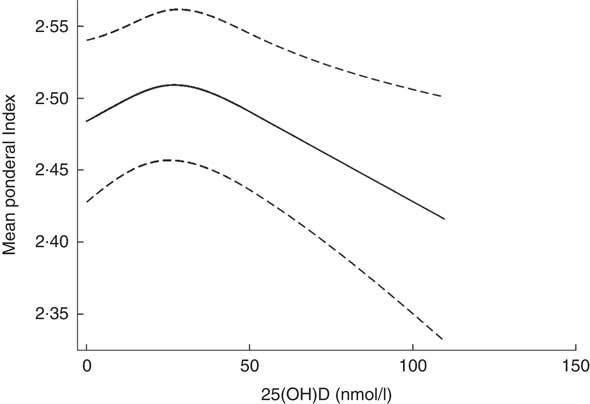
Fig. 4 Spline 25-hydroxyvitamin D3 (25(OH)D3) (nmol/l) and Ponderal Index (g×100/cm3) after mutual adjustment for maternal place of origin, smoking, age, education, season and year of birth among a random sample of infants born at term (weeks 37–44) in the years between 1981 and 2002 in Denmark (n 2654).
25-Hydroxyvitamin D3 and size for gestational age
Most infants were adequate for gestational age (AGA) (n 2046), 330 were SGA (12 %) and 280 were LGA (11 %). 25(OH)D3 concentrations differed between SGA (26·2 (sd 17·9)), AGA (27·2 (sd 18·5)) and LGA (29·2 (sd 17·9)) infants. However, the results from the multinomial regression analyses showed that the relative risk ratio of being SGA or LGA compared with AGA was not associated with 25(OH)D3 concentration (P=0·6) (Table 3).
Table 3 Multinomial regression analyses of 25-hydroxyvitamin D3 (25(OH)D3) concentration (nmol/l) and size for gestational age among a random sample of infants born at term (weeks 37–44) in the years between 1981 and 2002 in Denmark (n 2656) (Relative risk ratios (RRR) with their standard errors and 95 % confidence intervals)
SGA, small for gestational age; AGA, appropriate for gestational age; Ref., referent value; LGA, large for gestational age.
* Adjusted for maternal place of origin, smoking, age, education, season and year of birth.
Results from sensitivity analyses defining gestational age based on gestational week −1, and from including parity as a confounder, were essentially similar (online Supplementary Material).
Discussion
Using a large and randomly selected population-based sample of infants born in Denmark, we found that neonatal 25(OH)D3 concentration was significantly associated with gestational age at birth, birth weight and Ponderal Index, but not associated with size for gestational age. Notably, our analyses were restricted to infants born at term, as the underlying causes of preterm births such as infections, diabetes, high blood pressure, stress or nutritional status may influence maternal and fetal pregnancy outcomes and vitamin D concentrations( 33 ).
Gestational age
Our results suggested an inverse linear association between fetal 25(OH)D3 and gestational age, indicating that lower vitamin D does not seem to be related to a suspension of gestation in babies born at term. Our findings are supported by results from previous studies. For instance, Hossain et al.( Reference Hossain, Hussain-kanani and Shah 34 ) found higher vitamin D concentrations from cord blood among Pakistani neonates born before 37 weeks of gestation than among neonates born at later gestation. In addition, the authors reported a decrease in maternal serum concentrations of 25(OH)D with longer duration of gestation. Another longitudinal study among 141 Danish women reported that 25(OH)D concentration increased between weeks 18 and 32 and decreased from 32 to 8 weeks postpartum among healthy pregnant women( Reference Milman, Hvas and Bergholt 35 ). As maternal and fetal 25(OH)D concentrations are correlated( Reference Streym, Moller and Rejnmark 5 , Reference Weinert and Silveiro 6 ), it is likely that both maternal and fetal vitamin D concentrations fluctuate by gestational weeks following a similar pattern. Decreasing concentrations of neonatal vitamin D with longer duration of gestation might be explained by a decreasing efficiency of the decidua to transfer 25(OH)D3 from the mother to the fetus. This fluctuation might also be owing to maternal physiological variation in vitamin D concentrations during pregnancy, because of changes in maternal plasma vitamin D binding protein and variations in intestinal absorption of vitamin D( Reference Hossain, Hussain-kanani and Shah 34 – Reference Kachkache, Rebut-Bonneton and Demignon 36 ). In addition, the concentration of the active form of vitamin D (1,25-dihydroxycholecalciferol (1,25(OH)D)) increases during gestation( Reference Specker 37 ), and as 25(OH)D has a shorter half-life when 1,25(OH)D concentration increases, 25(OH)D concentration tends to decrease. However, the aetiology behind the changes in 25(OH)D during pregnancy remains controversial( Reference Figueiredo, Cocate and Adegboye 38 ). Furthermore, in late gestation, mothers seem to have less outdoor activities and therefore potentially less skin synthesis of vitamin D through sun exposure( Reference Borodulin, Evenson and Wen 39 ).
The association between 25(OH)D and gestational age at birth might be bidirectional. Indeed, higher neonatal 25(OH)D concentrations may shorten gestational length among infants born at term, but longer gestational length may also lower neonatal 25(OH)D concentrations. In the present study, establishing a causal pathway was not possible.
Further basic studies on maternal–fetal vitamin D variations and placental transfer at different stages of gestation are needed to clarify the underlying mechanisms involved, as they still remain unclear( Reference Nguyen, Yong and Chollangi 40 ). However, at present, the restricted possibility to access direct information on vitamin D status of the human fetus limits our possibility for understanding fetal physiology( Reference Salle, Delvin and Lapillonne 41 ).
Birth weight and Ponderal Index
A significant non-linear association was found between neonatal 25(OH)D3 and birth weight, as well as between neonatal 25(OH)D3 and Ponderal Index. These results are in accordance with results from a study including 1491 Chinese neonates, also finding an inverted U-shaped association between 25(OH)D from cord blood and birth weight( Reference Zhu, Tong and Hu 21 ) and another study from the USA finding a non-linear association between maternal 25(OH)D and birth weight( Reference Gernand, Simhan and Klebanoff 8 ), thus suggesting that higher vitamin D concentrations do not seem to benefit fetal growth, or may have dual biological effects on fetal growth( Reference Zhu, Tong and Hu 21 ). However, contrary to our findings, as well as to those of Zhu et al. and Gernand et al., Shor et al. and Eggemoen et al. did not find an association between maternal vitamin D and birth weight. However, in these two latter studies, analyses were limited to using linear models( Reference Gernand, Simhan and Klebanoff 8 , Reference Zhu, Tong and Hu 21 , Reference Shor, Barzel and Tauber 42 , Reference Eggemoen, Jenum and Mdala 43 ). Furthermore, another Danish study( Reference Lykkedegn, Beck-Nielsen and Sorensen 44 ) found a U-shaped association between cord 25(OH)D and birth weight. Multiple causes might explain the inconsistent findings, such as difference in birth period (1981–2002 v. 2010–2012), possible lifestyle changes between 1981 and 2012, sample selection (representative sample v. healthy women), 25(OH)D concentrations (27·2 (sd 18·3) v. 47·0 (sd 21·7) nmol/l) and methodological differences (DBS v. cord blood; adjustment for different confounders; residual confounding). In regard to Ponderal Index, no associations were found in the studies by Eggemoen et al. and Gernand et al.( Reference Gernand, Simhan and Klebanoff 8 , Reference Eggemoen, Jenum and Mdala 43 ). These discrepancies might be owing to different study designs, analytic methods and lack of power, but may also relate to the relative difficulty of measuring the crown–heel length of newborns. As cubic length is used to calculate Ponderal Index, even small measurement errors can have substantial influence on the accuracy of the Ponderal Index( Reference Corkins, Lewis and Cruse 45 ).
Size for gestational age
There was no association between 25(OH)D3 and the categories of size for gestational age. These results are consistent with our findings of an inverted U-shaped association between 25(OH)D3 and birth weight, which indicates that vitamin D effects on fetal growth might be dual. Conflicting findings on this association are, however, present in the literature. Narrative and systematic reviews and meta-analyses indicate that an association between 25(OH)D and the risk of SGA from observational studies exist, but not from randomised trials( Reference Aghajafari, Field and Rabi 20 , Reference Karras, Anagnostis and Petroczi 46 – Reference Chen, Zhu and Wu 48 ). The discrepant results might be owing to differences in study designs, exposure and/or outcome definitions and measurements, as well as study populations.
Strengths and limitations
The strengths of this study lie in the large sample of individuals randomly selected among the entire Danish population with neonatal biological measurements of 25(OH)D3 from DBS, as well as the use of the high-quality register data from the DMBR, where demographic data, birth weight and parity have shown good precision compared with medical records( Reference Kristensen, Langhoff-Roos and Skovgaard 32 ). Data on gestational age in DMBR, compared with medical records, were found to overestimate actual gestational age by 1 week( Reference Kristensen, Langhoff-Roos and Skovgaard 32 ), and to account for this, sensitivity analyses were run. In addition, another strength of this study is that multinomial and spline regression analyses with adjustment for a large number of confounders, including year of birth to account for secular changes in birth weight in Denmark between 1981 and 2002( Reference Schack-Nielsen, Mølgaard and Sørensen 49 ), were performed. The study has also limitations. First, measures of 25(OH)D, birth weight and gestational age were collected within 7 d after birth; hence, a cause–effect direction could not be established. Second, information on maternal vitamin D concentrations, breast-feeding, maternal weight or BMI, outdoor activity and dietary intake were not available; hence, they could not be included as covariates in our statistical models. Third, adjustment for smoking during pregnancy might not be comprehensive, as information about maternal smoking status was missing for more than 40 % of individuals and reporting bias may have occurred. The current results might only be generalised to populations with similar characteristics as the Danish population.
Conclusion
Overall, this large study conducted in a random subset of the Danish population suggests that neonatal 25(OH)D3 concentration is inversely associated with gestational age at birth; the later the gestational age, the lower the concentrations. In addition, our results suggest that neonatal 25(OH)D3 concentration has an inverted U-shaped association with birth weight and Ponderal Index, which are known to be correlated with many subsequent health outcomes such as obesity and type 2 diabetes, and is not associated with size for gestational age (SGA and LGA).
Randomised clinical trials are needed to draw firm conclusions regarding the causal direction of the associations found.
Acknowledgements
The study was part of the 4-year project ‘D-tect’ funded by the Programme Commission on Health, Food, and Welfare under the Danish Council for Strategic research (grant no. 0603-00453B). The Danish Diabetes Academy supported by the Novo Nordisk Foundation. The Lundbeck Foundation (grant no. R170-2014-643). The funders had no role in study design, data collection and analysis, decision to publish or preparation of the manuscript.
B. L. H. designed the study. A. K., P. F. and B. L. H. formulated the research question. R. J., J. M. G. and A. C. provided feedback on the study design. A. K. and P. F. analysed the data. A. K. and M. N. H. wrote the manuscript. All authors read and provided written feedback on the manuscript.
The authors declare that there are no conflicts of interest.
Supplementary material
For supplementary material/s referred to in this article, please visit https://doi.org/10.1017/S0007114518000879


