


CVD is the number one cause of death worldwide(1). LDL-cholesterol in the circulation is one of the most important modifiable risk factors for CVD(Reference Tardif, Heinonen and Orloff2). HDL are responsible for reverse cholesterol transport from peripheral tissues to the liver and are associated with reduced risk(Reference Tardif, Heinonen and Orloff2).
Fish consumption is associated with reduced risk of CVD(Reference Mozaffarian and Rimm3–Reference Tørris, Småstuen and Molin5). This is partly due to the TAG-lowering effect of the n-3 PUFA EPA (20 : 5n-3) and DHA (22 : 6n-3), abundant in fatty fish(Reference Lund6–Reference Rundblad, Holven and Bruheim8). In addition, n-3 PUFA may act through mechanisms such as reduced blood pressure, inflammation, thrombosis and arrhythmia(Reference Mozaffarian and Wu7). Although n-3 PUFA effects on LDL and HDL cholesterol have been minor and inconsistent(Reference Rundblad, Holven and Bruheim8–Reference Schwab, Lauritzen and Tholstrup10), new methodology may provide new insight to the field of lipid metabolism and health by identifying potential novel risk markers(Reference Schwab, Lauritzen and Tholstrup10). Lipoproteins can be divided into subclasses based on their size and density(Reference Feingold, Grunfeld, Feingold, Anawalt and Boyce11). Some subclasses have been associated with increased risk of CVD, such as increased levels of small LDL and reduced levels of large HDL(Reference Krauss12); however, whether this contributes to improved risk prediction remains unclear(Reference Nordestgaard, Langlois and Langsted13).
In addition to n-3 PUFA, fish and seafood are good sources of dietary protein and a variety of micronutrients such as iodine, selenium, vitamin B12 and vitamin D(Reference Lund6). Due to the beneficial health effects of fish, most countries’ food-based dietary guidelines recommend consuming fish on a regular basis. According to the European Food Safety Authority, food-based dietary guidelines for fish consumption range from 100 to 300 g/week in most countries(14). The Nordic Nutrition Recommendations recommend including both fatty and lean fish in the diet(15), and the Norwegian food-based dietary guidelines(16) recommend a total intake of 300–450 g fish per week, including at least 200 g fatty fish. Norwegian adults, aged 18–70 years, have a mean weekly intake of 450 (men) and 300 (women) g fish(Reference Totland, Melnæs and Lundberg-Hallen17).
In intervention studies, fatty fish consumption improves concentration and lipid content of lipoprotein subclasses(Reference Erkkila, Schwab and Lehto18–Reference Raatz, Johnson and Rosenberger22). In subjects with increased cardiovascular risk, both particle size, concentration and lipid content of HDL particles are increased(Reference Erkkila, Schwab and Lehto18–Reference Manninen, Lankinen and de Mello20). In healthy or overweight middle-aged or elderly adults, particle size and concentration of VLDL are decreased(Reference Li, Lamon-Fava and Otvos21,Reference Raatz, Johnson and Rosenberger22) . More studies determining the long-term effects of fish consumption on lipoprotein profiling have been warranted(Reference Erkkila, Schwab and Lehto18).
HDL has an anti-atherosclerotic function that has been ascribed to the cholesterol efflux ability(Reference Bhatt and Rohatgi23). Animal studies have shown improved macrophage efflux after supplementation with EPA and DHA, likely mediated through activation of genes involved in reverse cholesterol transport, suggesting a clear link between increased n-3 fatty acid intake and cholesterol efflux(Reference Kasbi Chadli, Nazih and Krempf24). Since HDL particles are under continuous remodelling in the plasma, thereby influencing their functionality, it is of interest to see if intake of fatty fish and a high n-3 intake influence the HDL subclass particle concentrations and composition.
Therefore, the aim of the present exploratory study was to investigate the association between fatty fish consumption and lipoprotein subclass particle concentrations and composition and certain plasma metabolites in healthy adults, with emphasis on HDL particle concentration and composition. We hypothesised that high consumers of fatty fish had a more favourable HDL subclass profile than low consumers.
Methods
Participants
The participants in this exploratory cross-sectional study were healthy adults originally recruited to two ongoing randomised controlled trials at the University of Oslo and Oslo and Akershus University College in the period from 2012 to 2016(Reference Rundblad, Holven and Bruheim8,Reference Ulven, Leder and Elind25) . The participants who met to a screening visit prior to these two randomised controlled trials were included in the present study. Advertisements in social media, local newspapers and among employees at the University College and local research institutes were used to recruit participants to both studies. In addition, in one of the studies, invitations were sent by regular post to adults 18–70 years in Skedsmo municipality, Akershus County, Norway. Persons who were interested in participating in the trials were interviewed by telephone. In one of the trials, due to the design of the randomised controlled trials, persons who reported a habitual weekly consumption of one meal of fatty fish or less were invited to the screening visit. In both studies, participants who were regularly using n-3 supplementation were asked to refrain from taking supplements before the screening visit. Thus, the participants in this cross-sectional study were non-users or had refrained from taking n-3 supplements for at least 2 weeks before the visit to the study centre.
Both studies were conducted according to the guidelines laid down in the Declaration of Helsinki, and all procedures involving human subjects were approved by the Regional Ethics Committee for Medical Research in South East Norway. Written informed consent was obtained from all participants. The studies were registered at www.clinicaltrials.gov (ClinicalTrials.gov identifier: NCT02568228 and NCT01679496).
Dietary assessment
We assessed habitual dietary intake through a semi-quantitative FFQ designed to capture dietary habits during the last year(Reference Carlsen, Karlsen and Lillegaard26). The FFQ included questions about intake of 270 food items, including six questions about cold cuts and spreads made of fish, twelve questions about fish eaten for dinner and four questions about use of cod liver oil, cod liver oil capsules or fish oil capsules. The options for frequency of consumption ranged from several times per d to once a month, with options for portion sizes based on household units such as slices, pieces and spoons.
Weekly intake (g/week) of fatty fish included items eaten as bread spread, in salad, as lunch or dinner or as part of a mixed dish such as fish cakes or fish soup. In mixed dishes, only the fish part of the dish was included. The fatty fish species reported in the FFQ, and thus included in the present study, were salmon, trout, herring, mackerel, anchovy and sardine.
Clinical assessment
Fasting body weight was measured on a digital scale (Soehnle Professional) in light clothing without shoes. Height was measured using a standardised stadiometer (Holtain Limited) to the nearest millimetre with one decimal accepted.
Blood sampling and laboratory analysis
Venous blood samples were drawn after an overnight fast (≥12 h). Participants were instructed to avoid vigorous physical activity and alcohol consumption the day before blood sampling. Serum was obtained from silica gel tubes (Becton Dickinson Vacutainer Systems) that were kept at room temperature for 30 min until centrifugation (1500 g, 15 min). Plasma was obtained from EDTA tubes (Becton Dickinson Vacutainer Systems), immediately placed on ice and centrifuged within 10 min (1000/2000 g, 4°C, 15 min) and stored at –80 °C until shipped on dry ice for plasma metabolite analysis in 2017.
Plasma metabolite quantification
We used a high-throughput NMR spectroscopy platform (Nightingale Health, Finland) to quantify a large number of plasma metabolites. The platform quantifies absolute concentrations of routine lipids, total lipid composition and particle concentrations for fourteen lipoprotein subclasses, fatty acids (FA) and various low-molecular weight metabolites such as glycolysis precursors, ketone bodies and amino acids. The method has been described previously(Reference Soininen, Kangas and Wurtz27). Shortly, the plasma samples were stored in a freezer at –80°C. The frozen samples were thawed in a refrigerator (+4°C) overnight before they were gently mixed and centrifuged at 3400 g to remove possible precipitate. Aliquots of each sample (300 μl) were mixed with 300 μl sodium phosphate buffer (75 mm Na2HPO4 in 80 %/20 % H2O/D2O, pH 7·4). The NMR data were measured using a Bruker AVANCE III spectrometer operating at 500·36 MHz. The measurement temperature was constant at 310·1 K, and the shimming was performed automatically. Representative CV for the measurements have been published previously(Reference Kettunen, Demirkan and Würtz28,Reference Holmes, Millwood and Kartsonaki29) . The fourteen lipoprotein subclasses were defined by average particle diameter as extremely large VLDL (XXL-VLDL, >75 nm) with a possible contribution of chylomicrons, five VLDL subclasses: extra-large (XL, 64·0 nm), large (L, 53·6 nm), medium (M, 44·5 nm), small (S, 36·8 nm) and extra small (XS, 31·3 nm), intermediate density lipoproteins (28·6 nm), three LDL subclasses (L, 25·5 nm, M, 23·0 nm and S, 18·7 nm) and four HDL subclasses (XL, 14·3 nm, L, 12·1 nm, M, 10·9 nm and S, 8·7 nm). The average sizes of VLDL, LDL and HDL particles were calculated by weighting subclass diameter with the corresponding concentration(Reference Soininen, Kangas and Wurtz27).
Statistical analyses
Descriptive data are presented as means and standard deviations, and as medians and quartiles (Q1, Q3) for continuous variables or as frequencies and percentages for categorical variables. Participants who had not completed the FFQ and participants with an energy intake below 4000 kJ and above 20 000 kJ were excluded from the analyses. We split the participants into tertiles (three groups) of fatty fish consumption and focused on the lower and upper tertiles, hereafter called low consumers and high consumers of fatty fish. Differences in descriptive variables between low- and high consumers of fatty fish were tested with the t test for normally distributed variables, Mann–Whitney for variables with skewed distribution and Fisher’s exact test for categorical variables. All NMR metabolomics data were scaled to mean = 0 and sd = 1. Differences in NMR metabolomics variables between high consumers and low consumers, with low consumers as the reference group, were tested with a linear regression model (NMR metabolomics outcome variable – fatty fish group (high v. low) + covariates) adjusted for age, sex, BMI, study, total energy intake (kJ), intake of n-3 FA from supplements (as g of EPA + DPA + DHA/d) and alcohol. In adjustments for multiple testing, a false discovery rate less than 25 % was considered significant. In addition, we analysed differences in NMR metabolomics variables in the whole study population (n 517), with a linear regression model using fatty fish consumption as a continuous variable (NMR metabolomics outcome variable – fatty fish consumption (g/week) + covariates). Statistical analyses were performed in R (R Foundation for Statistical Computing)(30).
Results
Participant characteristics
In the two studies, a total of 552 participants attended the screening visits. After excluding participants not completing the FFQ, having a too low or too high energy intake or missing plasma samples for NMR, 517 participants were divided into tertiles of fatty fish consumption (Fig. 1). The participants were aged 55 years (Q1–Q3 50–62), had a BMI of 25·9 (sd 4·0) kg/m2 and 56 % were women (Table 1). Energy intake was 10 750 (sd 3152) kJ/d, and median weekly consumption of fatty fish was 162 g (Q1–Q3 83–255) and lean fish 108 g (Q1–Q3: 43–231). Low consumers of fatty fish (n 171) had a fatty fish consumption below 107 g/week (median intake of 58 g/week), and high consumers (n 171) had a consumption above 223 g/week (median intake of 294 g/week. Compared with the low consumers, the high consumers of fatty fish had lower BMI and were predominantly men and thus had a higher total energy intake. Furthermore, the high consumers had higher HDL-cholesterol and lower high-sensitivity C-reactive protein than the low consumers. The high consumers of fatty fish also had a higher consumption of lean fish, higher habitual use of n-3 supplements and higher contribution of energy from protein, fat, MUFA, PUFA, EPA and DHA and a lower contribution of energy from carbohydrates than the low consumers. The groups were similar with respect to age, tobacco use, lipid-lowering therapy, contribution of energy from saturated fat and serum TAG, total- and LDL-cholesterol.

Fig. 1. Flow diagram of the study participants.
Table 1. Characteristics of all participants, and of participants in the lowest and highest tertiles of fatty fish consumption*
(Mean values and standard deviations; median values and quartiles (Q1–Q3); frequencies and percentages)

hsCRP, high-sensitivity C-reactive protein; E%, percentage of total energy intake.
* Differences in descriptive variables between low- and high consumers of fatty fish were tested with t test for normally distributed variables, Mann–Whitney for variables with skewed distribution and Fisher’s exact test for categorical variables.
† P for difference between low- and high consumers of fatty fish. A P < 0·05 was considered significant.
‡ Missing three values.
§ Missing five values.
‖ Missing one value.
¶ Missing two values.
NMR measures in high and low consumers of fatty fish
We report on 138 plasma metabolites from each blood sample quantified by the NMR metabolomics platform. Fatty fish consumption as a continuous variable correlated significantly with fatty fish consumption based on tertiles (R 2 0·74, P < 0·001) (online Supplementary Fig. S1). Figs. 2 and 3 and online Supplementary Figs. S2 and S3 show log-transformed and SD-scaled differences in high consumers of fatty fish compared with low consumers (black line). Estimates on the right side of the zero line indicate higher level in high consumers, whereas estimates on the left side of the zero line indicate lower level in high consumers. The differences are summarised below.
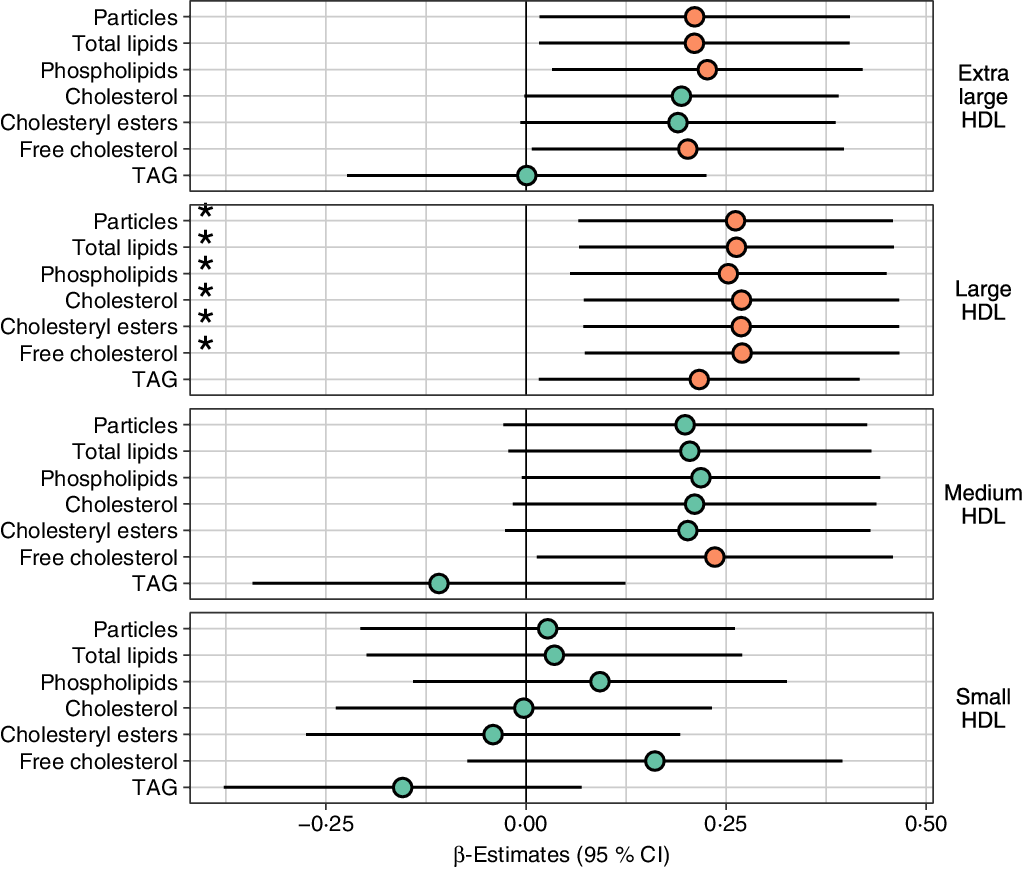
Fig. 2. Lipid levels in HDL subclasses in high consumers of fatty fish relative to low consumers. Concentrations of HDL subclass particles and their lipids in high consumers of fatty fish relative to low consumers of fatty fish analysed with a linear regression model adjusted for age, sex, BMI, study, energy intake, alcohol intake and use of n-3 supplements. Prior to modelling, outcomes were normalised to a standard normal distribution (centred to mean = 0 and scaled to standard deviation = 1); the regression estimates (95 % CI) can be interpreted as sd difference between high and low fatty fish consumers. * Variables that are significantly (P < 0·05) associated with fatty fish consumption as a continuous variable, adjusted for age, sex, BMI, study, energy intake, alcohol intake and use of n-3 supplements. P value: ![]() , ≥0·05;
, ≥0·05; ![]() , <0·05.
, <0·05.

Fig. 3. HDL diameter and other HDL-related measures in high consumers of fatty fish relative to low consumers. Average HDL diameter and levels of various HDL-related measures in high consumers of fatty fish relative to low consumers of fatty fish analysed with a linear regression model adjusted for age, sex, BMI, study, energy intake, alcohol intake and use of n-3 supplements. Prior to modelling, outcomes were normalised to a standard normal distribution (centred to mean = 0 and scaled to standard deviation = 1); the regression estimates (95 % CI) can be interpreted as sd difference between high and low fatty fish consumers. * Variables that are significantly (P < 0·05) associated with fatty fish consumption as a continuous variable, adjusted for age, sex, BMI, study, energy intake, alcohol intake and use of n-3 supplements. C, cholesterol. P value: ![]() , ≥0·05;
, ≥0·05; ![]() , <0·05.
, <0·05.
Lipoprotein particle concentration, lipid levels and lipid-related measures
High consumers of fatty fish had higher particle concentrations and content of total lipids, phospholipids and free cholesterol in L- and XL-HDL particles than low consumers (Fig. 2). Furthermore, high consumers had higher content of total cholesterol, cholesteryl esters and TAG in L-HDL particles and free cholesterol in M-HDL particles (Fig. 2). The high consumers of fatty fish also had larger HDL diameter and higher levels of ApoA1 and cholesterol in HDL and HDL2 particles and reduced ApoB:ApoA1 ratio (Fig. 3). These differences remained significant after adjusting for multiple comparisons (false discovery rate < 25 %, online Supplementary file 1; Table 1), except free cholesterol in XL-HDL and M-HDL and ApoA1. Although there were no significant differences, the particle concentrations and lipid content of VLDL and LDL were lower between high- and low consumers of fatty fish (online Supplementary Figs. S2 and S3). Overall, most of these data were confirmed using fatty fish consumption as a continuous variable. The associations were attenuated for the following measures: particle concentration and lipid content in XL-HDL, TAG in L-HDL, free cholesterol in M-HDL, HDL diameter, ApoA1 and cholesterol in HDL and HDL2 particles. In contrast, the findings were strengthened for the VLDL measures.
Fatty acids, amino acids, glucose metabolites and miscellaneous measures
As expected, analysis of FA showed higher degree of unsaturation, higher levels of DHA and n-3 FA and higher ratios of DHA:FA and n-3 FA:FA in high consumers of fatty fish. Total FA did not differ between the groups (Fig. 4). All significant differences remained significant after adjusting for multiple comparisons (false discovery rate < 25 %, online Supplementary file 1; Table 1). These data were confirmed using fatty fish consumption as a continuous variable, in addition to higher PUFA:FA ratio and lower MUFA:FA ratio. High consumers of fatty fish had lower levels of tyrosine and higher levels of valine than low consumers (Fig. 5), although only valine remained significant after adjusting for multiple comparisons. Using fatty fish consumption as a continuous variable, the effect on tyrosine was attenuated. When comparing low v. high consumers, we found no differences among the other amino acids, glucose metabolites or other metabolites. Using fatty fish consumption as a continuous variable, we found that fatty fish consumption was associated with higher levels of acetoacetate and 3-hydroxybuturate and lower levels of glycoprotein acetyls (Fig. 5). There was also a significant positive correlation between DHA plasma concentrations measured with NMR spectroscopy and DHA intake from fish calculated from the FFQ (R 2 0·14, P < 0·001) (online Supplementary Fig. S4).

Fig. 4. Fatty acids in high consumers of fatty fish relative to low consumers. Fatty acid levels and ratios in high consumers of fatty fish relative to low consumers of fatty fish analysed with a linear regression model adjusted for age, sex, BMI, study, energy intake, alcohol intake and use of n-3 supplements. Prior to modelling, outcomes were normalised to a standard normal distribution (centred to mean = 0 and scaled to standard deviation = 1); the regression estimates (95 % CI) can be interpreted as sd difference between high and low fatty fish consumers. * Variables that are significantly (P < 0·05) associated with fatty fish consumption as a continuous variable, adjusted for age, sex, BMI, study, energy intake, alcohol intake and use of n-3 supplements. FA, fatty acids; Unsaturation, estimated degree of unsaturation; LA, linoleic acid. P value: ![]() , ≥0·05;
, ≥0·05; ![]() , <0·05.
, <0·05.

Fig. 5. Amino acids, glucose metabolites and miscellaneous measures in high consumers of fatty fish relative to low consumers. Levels of amino acids and other metabolites in high consumers of fatty fish relative to low consumers of fatty fish analysed with a linear regression model adjusted for age, sex, BMI, study, energy intake, alcohol intake and use of n-3 supplements. Prior to modelling, outcomes were normalised to a standard normal distribution (centred to mean = 0 and scaled to standard deviation = 1); the regression estimates (95 % CI) can be interpreted as sd difference between high and low fatty fish consumers. * Variables that are significantly (P < 0·05) associated with fatty fish consumption as a continuous variable, adjusted for age, sex, BMI, study, energy intake, alcohol intake and use of n-3 supplements. P value: ![]() , ≥0·05;
, ≥0·05; ![]() , <0·05.
, <0·05.
Discussion
In the present study of healthy adults, we investigated the associations between fatty fish consumption and plasma metabolites, including lipoprotein subclass particle concentrations and composition. We found that high consumers of fatty fish had higher particle concentrations and content of total lipids, free cholesterol and phospholipids in L- and XL-HDL particles and higher content of total cholesterol, cholesteryl esters and TAG in L-HDL particles than low consumers of fatty fish.
To the best of our knowledge, this is the first comprehensive lipid and metabolite profiling in healthy adults with low and high consumption of fatty fish. The high consumers of fatty fish in our study had a fatty fish consumption in line with the recommendations in Nordic Nutrition Recommendations (NNR) and the Norwegian food-based dietary guidelines.
Our results on lipoprotein subclasses in healthy adults are in line with results from clinical trials assessing the effects of fatty fish consumption on lipoprotein subclasses in subjects with increased risk of CVD. By using the same NMR technology platform as in the present study, a clinical trial found that consuming fatty fish at least four times/week for 8 weeks increased HDL particle size compared with lean fish and lean meat in subjects with CHD(Reference Erkkila, Schwab and Lehto18). Total lipids, cholesterol and cholesteryl esters in XL-HDL increased in participants eating fatty fish.
Similar results are observed in other intervention studies using the same NMR technology platform(Reference Lankinen, Kolehmainen and Jaaskelainen19,Reference Manninen, Lankinen and de Mello20) . In subjects with impaired glucose tolerance, eating fatty fish four times/week for 12 weeks, the researchers observed a shift towards larger HDL particles, increased concentration of cholesterol in HDL and HDL2 particles and total lipids and phospholipids in L-HDL(Reference Manninen, Lankinen and de Mello20). A former study from our group including subjects with increased plasma TAG, with three fish meals per week for 8 weeks (mostly fatty fish), showed increased HDL3-cholesterol and TAG in LDL particles(Reference Rundblad, Holven and Bruheim8). Lankinen et al. (Reference Lankinen, Kolehmainen and Jaaskelainen19) showed that increased fatty fish consumption in subjects with impaired glucose tolerance, who had underwent a 12-week intervention with whole grain, fatty fish and bilberries, was associated with increased HDL particle size, increased concentrations of L- and XL-HDL and increased concentrations of L-HDL lipid components.
Two other clinical trials have used another NMR technology platform(Reference Li, Lamon-Fava and Otvos21,Reference Raatz, Johnson and Rosenberger22) . When compared with an average American diet, healthy adults following the National Cholesterol Education Program Step 2 high fish diet, or National Cholesterol Education Program Step 2 low fish diet for 24 weeks(Reference Li, Lamon-Fava and Otvos21), the high fish diet (mostly fatty fish) reduced M- and S-VLDL. In addition, the consumption of the low fish diet, but not the high fish diet, was associated with reduced concentrations of the large-sized HDL particles. Moreover, in overweight adults, consuming 90, 180 or 270 g salmon twice/week for 4 weeks, reduced VLDL particle size and concentration of L-VLDL and TAG content of VLDL particles, whereas the LDL particle size and concentration of L-LDL increased in a dose-dependent manner(Reference Raatz, Johnson and Rosenberger22). The findings on VLDL and LDL are in line with our findings, although our findings were NS. This may be due to a larger variation in the intake of fatty fish among the participants in the present cross-sectional study.
A Finnish cross-sectional study found that higher habitual fish consumption in young adults was related to favourable subclass distributions of VLDL and HDL(Reference Bogl, Pietiläinen and Rissanen31). This is in line with a cross-sectional study on Alaska natives, where higher dietary intake of n-3 PUFA was associated with larger HDL particle size and concentration of L-HDL and smaller VLDL particle size and lower concentration of L-VLDL(Reference Annuzzi, Rivellese and Wang32).
In addition to altered HDL-cholesterol-related lipoprotein profile, we found lower plasma levels of tyrosine and higher levels of the branched chain amino acid valine in high consumers of fatty fish than in low consumers. In contrast to our findings, a study within the EPIC-Oxford cohort found higher plasma concentrations of tyrosine in fish eaters and vegetarians than in meat eaters and vegans(Reference Schmidt, Rinaldi and Scalbert33). Both adjusting for multiple comparisons and using fatty fish consumption as a continuous variable, the effect on tyrosine was attenuated. Little is known about the importance of circulating amino acids in relation to cardiovascular risk; however, increased concentrations of branched chain amino acid in observational studies have been associated with poor metabolic health and future diabetes risk(Reference Lynch and Adams34,Reference Ahola-Olli, Mustelin and Kalimeri35) and in clinical studies positively related to insulin resistance, HbA1c and carotid intima media thickness(Reference Lynch and Adams34,Reference Wolak-Dinsmore, Gruppen and Shalaurova36) . This finding needs to be further investigated to understand if increased fish intake leads to metabolic alterations due to increased intake of these amino acids from fish.
In line with plasma concentration of hsCRP using fatty fish consumption as a continuous variable, we found lower levels of glycoprotein acetyls, which reflects the amount of N-acetyl groups in circulating glycoproteins involved in acute-phase inflammatory responses. This observation may be due to the increased plasma DHA and n-3 FA among those consuming high amounts of fatty fish, as these FA have anti-inflammatory function(Reference Calder37). Glycoprotein acetyls associate with both hsCRP levels and CVD risk(Reference Akinkuolie, Buring and Ridker38). In addition, higher plasma concentrations of glycoprotein acetyls are associated with reduced life expectancy(Reference Gruppen, Connelly and Sluiter39). Glycoprotein acetyls predict CVD and all-cause mortality and seem to reflect cumulative chronic inflammation(Reference Ritchie, Würtz and Nath40). Fish intake, as part of an anti-inflammatory diet, has also previously been associated with lower level of glycoprotein acetyls(Reference Davis, Liu and Kerr41).
We have previously shown that both HDL3 levels and gene expression of the cholesterol efflux regulatory protein ABCA1 in peripheral blood mononuclear cells were increased after intake of fish(Reference Rundblad, Holven and Bruheim8,Reference Rundblad, Holven and Bruheim42) . Moreover, animal studies have shown improved macrophage efflux after supplementation with EPA and DHA, probably mediated through activation of genes involved in reverse cholesterol transport such as ABCA1, ABCG1, ABCG5, ABCG8 and SR-B1, suggesting a molecular link between increased n-3 fatty acid intake and cholesterol efflux(Reference Kasbi Chadli, Nazih and Krempf24). The anti-atherosclerotic function of HDL has been ascribed to the cholesterol efflux ability, and recently, a meta-analysis showed that greater HDL efflux capacity was associated with lower risk of CVD(Reference Soria-Florido, Schröder and Grau43). HDL particles are under continuous remodelling in the plasma, which will influence their functionality and lead to variability in the composition of HDL particles. Further research to characterise HDL particles composition and functionality will lead to deeper understanding of how these processes are regulated.
The main limitations of the present study are measurement errors due to the nature of the dietary assessment method and that we cannot infer causality due to the observational design. Another limitation is the lack of measurements of HDL functionality, which could have given a better explanation and mechanistic insight into the impact of fish intake and the role of HDL on cholesterol efflux and cardiovascular risk. Strengths of the study include collection of several data on relevant lifestyle characteristics and anthropometry and adjusting for them in the analyses. We did not exclude participants using statins from our analyses, but statin use did not differ between the groups. Other strengths of the study include the large sample size and use of NMR technology to measure lipoproteins and other metabolites.
In conclusion, the present study suggests that high consumers of fatty fish have a more favourable HDL-cholesterol-related lipoprotein profile than low consumers of fatty fish, which may contribute to reduced CVD risk. In addition, consumption of fatty fish is associated with reduced levels of glycoprotein acetyls, which support the possible anti-inflammatory effect of n-3 PUFA. Thus, these data support the current dietary recommendation of two to three fish meals per week, of which at least one should be from fatty fish.
Acknowledgements
The authors gratefully acknowledge the participants who volunteered to the present study. The authors thank Anne Marte Wetting Johansen for valuable assistance with the FFQ.
The present study was supported by the University of Oslo, Throne Holst Foundation for Nutrition Research and Norwegian Seafood Research Fund (FHF).
K. S. H., A. R., K. B. H. and S. M. U. conceived and designed the study, K. S. H. and A. R. conducted the research, K. S. H., A. R., I. O., J. J. C., K. B. H. and S. M. U. performed statistical analyses and interpreted the results, K. S. H., K. B. H. and S. M. U. wrote the paper and had the primary responsibility for final content. All authors have critically reviewed the manuscript.
During the past 5 years, S. M. U. has received research grants from Mills DA, TINE BA and Olympic Seafood, none of which is related to the content of this manuscript. During the past 5 years, K. B. H. has received research grants or honoraria from Mills DA, TINE BA, Olympic Seafood, Amgen, Sanofi and Pronova, none of which is related to the contents of this manuscript. K. S. H., A. R., I. O. and J. J. C. have no conflicts of interest.
Supplementary material
For supplementary material/s referred to in this article, please visit https://doi.org/10.1017/S0007114520002305


 Open access