


Vitamin D plays a particularly crucial role during childhood because the requirement for Ca increases during this period of rapid bone growth( Reference Molgaard, Thomsen and Michaelsen 1 ). Furthermore, circulating vitamin D concentrations have been found to be inversely associated with extra-skeletal outcomes such as cardio-metabolic health in children( Reference Williams, Fraser and Sayers 2 – Reference Petersen, Dalskov and Sorensen 5 ). Vitamin D status is measured by serum 25-hydroxyvitamin D (25(OH)D) concentration, and the primary source of vitamin D is the synthesis that occurs in the skin upon exposure to UVB sunlight, while intake through diet, supplements and fortified foods are considered to be secondary sources( Reference Holick 6 ). However, a certain complexity is present at northern latitudes where cutaneous vitamin D synthesis is negligible during winter and early spring( Reference Webb, Kline and Holick 7 , Reference Kimlin 8 ). Accordingly, Scandinavian children’s 25(OH)D levels are found to fluctuate throughout the year, with nadir in winter and peak in summer( Reference Andersen, Brot and Jakobsen 9 – Reference Madsen, Rasmussen and Andersen 12 ). As a result, season is an important determinant of vitamin D status at these latitudes( Reference Petersen, Damsgaard and Dalskov 13 ).
Genetic variation is indicated to be an additional determinant of serum 25(OH)D concentration. Nevertheless, the magnitude of the genetic contribution to 25(OH)D concentration is uncertain and has, in adult and family studies, been reported to range from 29 to 80 %( Reference Berry and Hypponen 14 ). Several gene variants involved in synthesis, transportation and activation of vitamin D have been associated with serum 25(OH)D. These include Cytochrome P450 subfamily IIR1 (CYP2R1), which encodes an enzyme undertaking hepatic 25-hydroxylation of vitamin D; 7-dehydrocholesterol reductase (DHCR7), which encodes the 7-dehydrocholesterol (7-DHC) removing enzyme, a substrate needed for cutaneous vitamin D synthesis; group-specific complement (GC), which encodes vitamin D binding protein (DBP); and vitamin D receptor (VDR), which mediates the actions of active vitamin D (1,25-dihydroxyvitamin D)( Reference Wang, Zhang and Richards 15 , Reference McGrath, Saha and Burne 16 ). Associations between various SNP in these genes and serum 25(OH)D concentrations have been investigated previously from September to April in children living at Scandinavian latitudes( Reference Pekkinen, Saarnio and Viljakainen 17 – Reference Nissen, Vogel and Ravn-Haren 19 ), observing significant differences in serum 25(OH)D concentrations between genotypes from September to March( Reference Pekkinen, Saarnio and Viljakainen 17 , Reference Nissen, Rasmussen and Ravn-Haren 18 ) but not April( Reference Nissen, Vogel and Ravn-Haren 19 ). Interestingly, studies in adults and families living at northern latitudes have likewise indicated that associations between genotypes and serum 25(OH)D concentrations differ between seasons. A study of vitamin D3 fortification in Danish families observed that rs10741657 and rs10766197 in CYP2R1, and rs842999 and rs4588 in GC were strongly associated with serum 25(OH)D concentrations among all participants at autumn baseline, whereas no such associations were observed in the control group at study end in mid spring( Reference Nissen, Vogel and Ravn-Haren 19 ). A cross-sectional Swedish study (60°N) in adult twin pairs observed that half of the variability in summer serum 25(OH)D concentrations was explained by genetic factors, whereas this estimate was considerably lower in winter( Reference Snellman, Melhus and Gedeborg 20 ). In a Canadian longitudinal adult study (43°N), it was found that GC rs4588 was associated with 25(OH)D concentration in autumn (accounting for approximately 7 % of the 25(OH)D variation) but not associated with 25(OH)D concentration in winter( Reference Gozdzik, Zhu and Wong 21 ). And in an American cross-sectional study (42–46°N) on 1204 postmenopausal women, Engelman et al. observed that rs11023374, rs10500804, rs2060793 and rs11023380 in CYP2R1, and rs4588 and rs7041 in GC were strongly associated with serum 25(OH)D concentrations during summer but not winter. In this study, an interesting gene–season interaction effect was also observed with the association between rs7041 and serum 25(OH)D( Reference Engelman, Meyers and Iyengar 22 ). These studies suggest genetic variants in vitamin D-related genes to be a determinant of serum 25(OH)D concentrations in some, but not all, seasons at northern latitudes. To further explore the public health relevance of these observations, it is of great interest whether common genetic variants are associated with lower serum 25(OH)D concentrations across the year in general. Hence, there is a need for association analyses on longitudinal data collected across several seasons at northern latitudes, particularly among children.
In a sample of healthy Danish 8–11-year-old children, the aim of the present repeated measurement study was to (1) investigate associations between selected SNP and serum 25(OH)D concentrations across a school year; and (2) investigate whether associations between season and serum 25(OH)D were modified by these SNP.
Methods
Study design and subjects
The study was based on data from the OPUS School Meal Study, a large cluster-randomised controlled cross-over trial conducted from August 2011 to June 2012. The aim of the trial was to assess the impact of providing school meals on the basis of the New Nordic Diet to third and fourth grade children. The two primary outcomes were the metabolic syndrome score and a measure of the children’s concentration performance. The design of the OPUS School Meal Study has been described in detail elsewhere( Reference Damsgaard, Dalskov and Petersen 23 ). In total, nine representative Danish schools were enrolled in the study and participants were recruited from these schools from May to October 2011. Written information about the study was sent to families of all third and fourth grade children at the schools and the families were invited to an information meeting. Because of the logistical considerations, the schools started consecutively in the study so that baseline ran from late August to November. At each school, a number of measurements were taken three times in each participating child during the study: at baseline, at month 3 (crossover) and at month 6 (completion). These three repeated measurements were used in the present longitudinal study, and they approximately represented autumn (30 August to 28 November), winter (29 November to 12 March) and spring (13 March to 30 June). We have previously established that there was no overall effect of the OPUS School Meal intervention on the children’s serum 25(OH)D concentrations, whereas a small and unexpected positive intervention effect was seen in the children’s parathyroid hormone (PTH) concentrations( Reference Petersen, Damsgaard and Dalskov 24 ).
Ethics statement
This study was conducted according to the guidelines laid down in the Declaration of Helsinki. All procedures involving human subjects were approved by the Regional Committee on Biomedical Research Ethics of the Capital Region of Denmark (H-1-2010-124), and the study was registered at www.clinicaltrials.gov (no. NCT 01577277). Written informed consent for participation was obtained from all parents/legal guardians of all children (n 834), corresponding to 82 % of the 1021 children invited.
Socio-demographic characteristics and puberty stage
Information about demographic and socio-economic characteristics was collected at baseline by an in-depth 2-h personal interview with the child and parents. The highest education level attained in the household was used to categorise parental educational level into lower secondary education (≤10 years), upper secondary education, vocational education, short higher education, bachelor’s degree or equivalent, or master’s degree or above (≥17 years). Children were categorised into ‘immigrants/descendants’ if all grandparents and ≥1 parent were born outside Denmark. Although not identical, this classification was based on the definitions of immigrants and descendants used by Statistics Denmark( 25 ). Finally, pubertal status was self-evaluated by the child and parents based on breast development in girls and pubic hair in boys (Tanner stages), as validated by Morris & Udry( Reference Morris and Udry 26 ). Registrations were dichotomised into a variable indicating entered puberty (Tanner stage ≥2) (yes/no).
Vitamin D intake
Before each of the three measurements in the study period, the children, aided by their parents, recorded their daily intake of food and beverages for 7 consecutive days using the Web-based Dietary Assessment Software for Children developed specifically for children aged 8–11 years old in the OPUS School Meal Pilot Study( Reference Biltoft-Jensen, Trolle and Christensen 27 ). Intake data was processed by the General Intake Estimation System, originally developed for the Danish National Survey of Diet and Physical Activity 2003–2008 (Division of Nutrition, The National Food Institute, Technical University of Denmark, Denmark)( Reference Pedersen, Fagt and Groth 28 ). The software was validated in the OPUS School Meal Pilot Study, although not specifically for vitamin D intake( Reference Biltoft-Jensen, Hjorth and Trolle 29 , Reference Biltoft-Jensen, Bysted and Trolle 30 ). Energy intake (EI) relative to estimated BMR was evaluated following the equations by Henry( Reference Henry 31 ), and energy under- (EI/BMR≤1·05) and over-reporters (EI/BMR≥2·28)( Reference Black 32 ) were excluded from the dietary variables, as were children who recorded their diet for less than 4 d. The daily intake of dietary supplements was recorded separately during the dietary recordings. This data allowed the intake of supplements containing vitamin D, including multivitamins, to be added up on a yes/no basis for each day of dietary recording. Energy over- and under-reporters and children who recorded their diet for less than 4 d were not excluded from data on vitamin D supplement intake. In the present study, data on intake of supplements containing vitamin D was expressed as a percentage (days with supplement intake/total number of days of dietary recording).
Physical activity and school settings as proxy measurement of sunlight exposure
To measure physical activity, the children were asked to wear an accelerometer (ActiGraph GT3X+ Tri-Axis Accelerometer Monitor) in an elastic belt fitted tightly at the right hip for the same 7 d and eight nights as the dietary recordings, and they were asked to only remove it during water activities (i.e. showering or swimming). Analyses of the physical activity data are described in detail elsewhere( Reference Hjorth, Chaput and Michaelsen 33 ). The variable for time spent in moderate-to-vigorous physical activity (MVPA) (≥2296 counts per min) was applied in the present study. School settings differed between the nine schools. Therefore, information about the approximate number of minutes per week that classes spent on walking outdoors between classrooms or other school facilities during school days (outdoors walks between classrooms) was obtained from a questionnaire completed by the principal of each school.
Anthropometry and ethnicity
Anthropometric measurements took place the week after each of the three assessments of dietary intake and physical activity. They were conducted during morning hours after the child had been fasting since midnight, had emptied the bladder, and was wearing only light clothing. Height was measured in centimetres to the nearest 1 decimal using a transport stadiometer (CMS Weighing Equipment LTD). Height was derived as the mean of three consecutive measurements with the child in standing position, holding his head in the Frankfurter plane. Body weight was measured in kilograms to the nearest first decimal place using a digital scale (Tanita BWB 800 S). BMI was calculated as body weight (kg)/height (m2), and sex- and age-adjusted z-scores for BMI were calculated using WHO AnthroPlus software( 34 ). The OPUS School Meal Study also included dual-energy X-ray absorptiometry (DXA) scans of each child. In relation to DXA scans, the ethnicity of each child was recorded by an investigator based on physical presence and statement of the child. Ethnicity was recorded according to the terminology of the Lunar Prodigy Pro™ (GE Medical Systems) DXA scanner with Encore™ software – that is, Caucasian, Asian, African, Latin or Other. These recordings were applied for ethnicity categorisation in the current study. Children recorded as Caucasian were named white ethnicity. These also included children from Turkey, the Middle East, Pakistan and India. Because of small numbers in the four non-Caucasian groups, ethnicity was categorised as white ethnicity (yes/no).
Measurement of 25-hydroxyvitamin D and parathyroid hormone concentrations
Blood sampling was conducted at the same occasions as anthropometric measurements. Local anaesthetic patches were offered to the children to reduce discomfort, and blood was sampled by venepuncture after an overnight fast from all children at one school before moving on to the next school. Blood with EDTA was centrifuged at 2500 g for 10 min at room temperature and buffy coats were stored at −80°C until DNA analysis. Blood collected in serum tubes was centrifuged after 30 min of coagulation at room temperature and was stored at −80°C for later analyses of 25(OH)D and intact PTH (iPTH). Serum 25(OH)D concentrations (D2+D3) were assessed by automatic chemiluminescence immunoassay technology (CLIA) on DiaSorin LIAISON (DiaSorin AB) at the Department of Clinical Biochemistry, Aalborg University Hospital, Aalborg, Denmark (a laboratory participating in the vitamin D External Quality Assessment Scheme)( Reference Carter, Berry and Gunter 35 ). Before analysis, serum was thawed at room temperature for 30 min before centrifugation at 4000 rpm for 3 min. Serum iPTH concentrations were determined using CLIA technique on ADVIA Centaur XP (Siemens Healthcare). For each analysis, all samples were run on the same device with the same reagent lot, all samples from each child were analysed on the same day, and all samples from each school were analysed in one assay. The inter- and intra-assay CV were 5·4 and 7·6 % for 25(OH)D) and 7·4 and 7·9 % for iPTH.
SNP selection and genotyping
We included SNP from several vitamin D-related genes. All SNP had to be located in/near genes involved in vitamin D metabolism, and selection was based on literature search for previous evidence of associations with serum 25(OH)D in genome-wide and children’s studies, particularly Scandinavian children( Reference Wang, Zhang and Richards 15 , Reference Pekkinen, Saarnio and Viljakainen 17 , Reference Nissen, Rasmussen and Ravn-Haren 18 , Reference Ahn, Yu and Stolzenberg-Solomon 36 , Reference Zhang, Wang and Liu 37 ). In total, eleven SNP were included, of which seven were based on evidence of associations in Danish children and four on genome-wide studies: CYP2R1: rs10500804, rs10741657, rs1562902 and rs10766197; 7-dehydrocholesterol reductase/nicotinamide adenine dinucleotide synthetase-1 (DHCR7/NADSYN1): rs12785878 and rs3829251; GC: rs2282679, rs842999, rs4588 and rs7041; and VDR: rs757343. DNA extraction and genotyping were performed at LGC Genomics (LGC Genomics Ltd) using KASP™ genotyping technology, which facilitates bi-allelic discrimination through competitive PCR and incorporation of a fluorescent resonance energy transfer quencher cassette. The genotypes were called at LGC Genomics using Kraken software with visual quality control of all calls. Call rates for all SNP were 100 % for samples and 0 % for non-template controls. No deviations from Hardy–Weinberg equilibrium (HWE) were observed. In some cases, genotyping was impossible due to poor DNA quality. Children were excluded from the data analysis if they did not have data on at least one of the included SNP or did not have all three repeated measurements of serum 25(OH)D across the school year.
Statistical analyses
Pearson’s correlation coefficients were used to assess the degree of linkages between SNP within the same gene. HWE was assessed by using χ 2 tests with Bonferroni’s correction (P-value 0·05/8 SNP=0·006)( Reference Rodriguez, Gaunt and Day 38 ). For a haplotype analysis of GC rs7041 and rs4588, the children were allocated to the GC haplotypes: GC1f, GC1s and GC2. This was done by their respective SNP in rs7041 and rs4588 as follows: rs7041-T and rs4588-C (GC1f); rs7041-G and rs4588-C (GC1s); and rs7041-T and rs4588-A (GC2). When combining GC1f and GC1s allele carriers, the combined genotypes were: GC11 (GC1s-1s, GC1s-1f, GC1f-1f); GC21 (GC2-1s, GC2-1f); and GC22 (GC2-2), as described by Abbas et al. ( Reference Abbas, Linseisen and Slanger 39 ) and Lauridsen et al. ( Reference Lauridsen, Vestergaard and Hermann 40 ). Linear mixed effects models were used to investigate the association of each SNP with serum 25(OH)D concentrations and for the haplotype analysis. For all mixed models, school, grade, class and subject were included as random effects to account for the dependency structures imposed by the hierarchical design. On the basis of thorough baseline analysis of serum 25(OH)D determinants that has previously been conducted in this sample of children( Reference Petersen, Damsgaard and Dalskov 13 ), the following covariates were included as fixed effects: age, sex, outdoor walks between classrooms (min/week), MVPA (min/d), approximated season in which each of the three measurements was conducted (autumn/winter/spring), dietary vitamin D intake, intake of supplements containing vitamin D (days with supplement intake per total number of days of dietary recording), immigrant/descendant background (yes/no), white ethnicity (yes/no), entered puberty (i.e. Tanner stage≥2) (yes/no), parental education level and BMI-for-age z-scores( Reference Petersen, Damsgaard and Dalskov 13 ). In addition, adjustment for the intervention (school meal/control) and the order of school meal/control periods of the original study was included in these association analyses. This allowed us to combine data from all measurements across the school year and thus obtain longitudinal data and maximise power in the present study. SNP and season interactions were also investigated in case an association between the corresponding SNP and serum 25(OH)D was observed. This analysis was conducted by augmenting the adjusted linear model with the interaction term between the specific SNP and season. Finally, where such interactions were observed, additional analyses were then conducted in a similar model but with PTH as the outcome. All interaction effects were assessed by likelihood-ratio tests. Assumptions underlying statistical models were checked by visual inspection of residual and normal probability plots, and outcomes were transformed as appropriate. Significance was established at P<0·05. The statistical analyses were carried out using STATA (version 12.1; StataCorp LP).
Results
Characteristics of the study population
Out of 834 children, 642 children had all three repeated measurements of serum 25(OH)D and data on at least one of the included SNP. The characteristics of this study population are shown in Table 1. Two 25(OH)D samples (at the second measurement in winter) were under the detection limit of 10 nmol/l, and they were included in analyses with the value equal to half of the detection limit (5 nmol/l). Two PTH samples (one at baseline in autumn and one at the third measurement in spring) were below the detection limit of 0·265 pmol/l, and they were likewise assigned the value equal to half of the detection limit (0·135 pmol/l) in the analyses. One baseline PTH sample of 109 pmol/l (25(OH)D=89·1 nmol/l) was excluded from data as an extreme outlier.
Table 1 Baseline characteristics of the study population (Mean values and standard deviations; medians and 25th–75th percentiles)

uw, Underweight; nw, normal weight; ow, overweight; ob, obesity.
* Based on age- and sex-specific cut-offs defined to pass through BMI of 18·5, 25 and 30 kg/m2 at age 18 years, as described by Cole et al. ( Reference Cole, Flegal and Nicholls 41 , Reference Cole, Bellizzi and Flegal 42 ).
† Entered puberty defined as Tanner stage≥2 as validated by Morris & Udry( Reference Morris and Udry 26 ).
‡ A: ≤lower secondary education, B: higher secondary education, C: vocational education, D: short higher education, E: bachelor’s degree or equivalent, F: ≥master’s degree.
§ Excluding intake from supplements, excluding over- and under-reporters and excluding children who recorded dietary intake for <4 d.
|| Percentage of children who recorded intake of vitamin D containing supplements (including multivitamins) for ≥1 d during baseline dietary recordings.
The unadjusted mean 25(OH)D concentration in autumn, winter and spring was 61·1(sd 18·4), 46·6 (sd 17·9) and 48·9 (sd 17·9) nmol/l, respectively, whereas PTH was 3·3 (sd 1·5), 3·8 (sd 1·6) and 4·0 (sd 1·9) pmol/l, respectively (Table 2). An overall inverse association (adjusted for school, grade, class and subject) between serum 25(OH)D and PTH was observed (P<0·001) – that is, 1 nmol/l increase of 25(OH)D was associated with a 0·026 pmol/l decrease in PTH (95 % CI −0·023, −0·030).
Table 2 Unadjusted 25-hydroxyvitamin D (25(OH)D) and parathyroid hormone (PTH) concentrations according to each of the three measurements (Mean values and standard deviations)
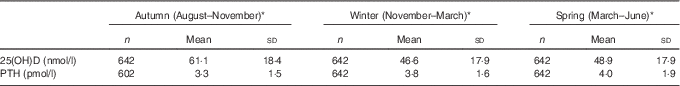
* Season (monthly interval wherein first, second and third measurement was conducted, respectively).
Associations between selected SNP and serum 25-hydroxyvitamin D concentrations across the school year
The following SNP were highly correlated: rs10500804 and rs10766197 (P=0·864) in CYP2R1; rs2282679 and rs4588 (r 0·986) in GC, and rs842999 and rs7041 (r 0·937) in GC (online Supplementary Tables S1–S3). To establish which of these SNP had the strongest association to serum 25(OH)D, we assessed the association between one SNP and serum 25(OH)D while adjusting for the correlated SNP. In CYP2R1 the strongest association was observed with rs10500804 (P=0·002) compared with the association with rs10766197 (P=0·51). In GC the strongest association was observed with rs4588 (P=0·044) compared with rs2282679 (P=0·36), and with rs7041 (P<0·001) compared with rs842999 (P=0·10). Therefore, only CYP2R1 rs10500804, and GC rs4588 and rs7041 were included in further analyses.
We found associations between serum 25(OH)D concentrations and all included SNP in CYP2R1 and GC, whereas no associations were observed with SNP in DHCR7/NADSYN1 or VDR. For all SNP in GC an increasing number of minor alleles was associated with lower serum 25(OH)D concentrations across the school year (Table 3). Likewise, an increasing number of minor alleles of rs10500804 in CYP2R1 was associated with lower serum 25(OH)D concentrations. However, for CYP2R1 rs1562902 and rs10741657, minor alleles homozygosity was associated with higher concentrations of serum 25(OH)D compared to children with major alleles homozygous genotypes (Table 3). For all associated SNP, mean serum 25(OH)D concentrations <50 nmol/l (across the three seasons) were observed for children who were homozygous for the risk allele.
Table 3 Basic characteristics of the SNP (ordered by position) and their association with serum 25-hydroxyvitamin D (25(OH)D) concentrations (Mean values and standard deviations; β values and 95 % confidence intervals)

MAF, minor allele frequency; HWE, Hardy–Weinberg equilibrium; Gt, genotype; CYP2R1, cytochrome P450 subfamily IIR1; Ref., referent value; DHCR7/NADSYN1, 7-dehydrocholesterol reductase/nicotinamide adenine dinucleotide synthetase-1; GC, group-specific complement; VDR, vitamin D receptor.
* χ 2 Test of deviation from Hardy–Weinberg equilibrium, Bonferroni P of 0·05/8 SNP=0·006.
† Association between genotype and serum 25(OH)D concentrations across the school year (three repeated measurements in each child (in autumn, winter and spring, respectively)) with major homozygosity as reference, and with school, grade, class and subject as random effects and parental education, intake of supplements containing vitamin D (days with supplement intake/total number of days of dietary recording), moderate-to-vigorous physical activity, outdoors walks between classrooms, immigrant/descendant background (yes/no), white ethnicity (yes/no), sex, age, dietary vitamin D intake, BMI-for-age, the original study intervention, and order of intervention as fixed effects. In the adjusted analyses, n 586–598.
‡ Pairwise Pearson’s correlation between CYP2R1 rs10500804 and rs10766197 (r 0·8644); therefore, only rs10500804 included.
§ Pairwise Pearson’s correlation between GC rs2282679 and rs4588 (r 0·986); therefore, only rs4588 included.
‖ Pairwise Pearson’s correlation between GC rs842999 and rs7041 (r 0·937); therefore, only rs7041 included.
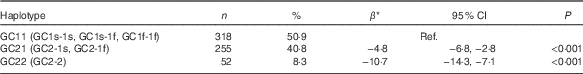
Group-specific complement haplotype analysis of rs7041 and rs4588
We found children with the GC11 haplotype (n 318) to have higher serum 25(OH)D concentrations across the school year than children with the GC21 (P<0·001) (n 255) and GC22 (P<0·001) (n 52) haplotypes (Table 4). In addition, the children with GC21 had higher serum 25(OH)D concentrations, compared with the children with GC22 (5·9 nmol/l; 95 % CI 2·2, 9·5; P=0·002). The GC22 haplotype included children who were homozygous for the risk alleles of both GC rs7041 and rs4588; hence, these results were consistent with the results from the analyses of the individual SNP. Data on haplotype allocation are presented in the online Supplementary Table S4.
Table 4 Group-specific complement (GC) rs7041 and rs4588 haplotypes associations with serum 25-hydroxyvitamin D (25(OH)D) concentrations (Mean values and standard deviations; β values and 95 % confidence intervals; n 625)
Ref., referent value.
* Association between haplotype and serum 25(OH)D concentrations across the school year (three repeated measurements in each child (in autumn, winter and spring, respectively)), and with school, grade, class and subject as random effects and parental education, intake of supplements containing vitamin D (days with supplement intake/total number of days of dietary recording), moderate-to-vigorous physical activity, outdoor walks between classrooms, immigrant/descendant background (yes/no), white ethnicity (yes/no), sex, age, dietary vitamin D intake, BMI-for-age, the original study intervention and order of intervention as fixed effects.
Were associations between season and serum 25-hydroxyvitamin D modified by the SNP?
We found the association between season and serum 25(OH)D concentration to be modified by GC rs7041 (P interaction =0·044). This effect modification was observed as an absence of increase in serum 25(OH)D concentration from winter to spring among children with minor alleles homozygosity (2·5 nmol/l; 95 % CI −1·0, 6·0; P=0·164) compared with the two other genotypes groups, that both experienced an increase in serum 25(OH)D concentration (both P<0·001, for winter compared with spring) (Table 5). We did not find an association between GC rs7041 and serum PTH nor did we find an interaction effect between GC rs7041 and season in the analysis with PTH. No interactions with season were found for the other included SNP (online Supplementary Table S5).
Table 5 Effect modification of associations between season and serum 25-hydroxyvitamin D (25(OH)D) concentration by each genetic variation in group-specific complement (GC) rs7041 with winter 25(OH)D concentrations as reference (Mean values and standard deviations; β values and 95 % confidence intervals)
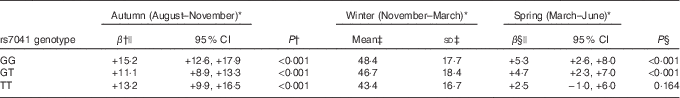
* Season (monthly interval wherein first, second and third measurement was conducted, respectively).
† Difference between autumn and winter serum 25(OH)D concentrations for the rs7041 major alleles homozygote GG, the heterozygote GT, and the minor alleles homozygote TT genotype, respectively, with lowest denominator as reference (i.e. winter concentration).
‡ Unadjusted mean and sd of serum 25(OH)D in winter for the respective genotype.
§ Difference between winter and spring serum 25(OH)D concentrations for the rs7041 major alleles homozygote GG, the heterozygote GT, and the minor alleles homozygote TT genotype, respectively, with winter concentration as reference.|| Adjusted for school, grade, class and subject as random effects and parental education, intake of supplements containing vitamin D (days with supplement intake/total number of days of dietary recording), moderate-to-vigorous physical activity, outdoors walks between classrooms, immigrant/descendant background (yes/no), white ethnicity (yes/no), sex, age, dietary vitamin D intake, BMI-for-age, the original study intervention and order of intervention as fixed effects, including the significant interaction term between the GC rs7041 SNP and season.
Discussion
In the present longitudinal study, an increasing number of minor alleles of CYP2R1 rs10500804 and of GC rs4588 and rs7041 were associated with lower concentrations of serum 25(OH)D across the school year. The estimated difference from major to minor alleles homozygosity of these SNP ranged from −5·8 to −10·6 nmol/l. In contrast, minor alleles homozygosity of CYP2R1 rs10741657 and rs1562902 was associated with higher concentrations of serum 25(OH)D in the range of 5·2–7·6 nmol/l compared with homozygosity of the major alleles. We consider these observed differences to be substantial. Indeed, a difference of 10·6 nmol/l is comparable with the approximated seasonal difference of 12·2 nmol/l observed in the children’s mean 25(OH)D concentrations between autumn and spring, as shown in Table 2. Moreover, an overall increase of 5·2–7·6 nmol/l would be sufficient to elevate mean serum 25(OH)D concentrations in the winter (unadjusted mean 46·6 nmol/l) and spring (unadjusted mean 48·9 nmol/l) above the commonly applied vitamin D sufficiency level of 50 nmol/l( Reference Braegger, Campoy and Colomb 43 , Reference Ross, Manson and Abrams 44 ). Children who were homozygous for the GC rs4588 minor allele had the lowest mean serum 25(OH)D concentration of all genotypes, at 43·2 nmol/l across the school year. Although not very far from the 50 nmol/l cut-off, our observations raise concern, as persistent vitamin D insufficiency could be related to adverse health outcomes in growing children( Reference Braegger, Campoy and Colomb 43 ). The result must naturally be considered in combination with other determinants of low serum 25(OH)D. These have previously been investigated in this sample of healthy Danish children, where as much as 28 % were reported to be vitamin D insufficient during autumn( Reference Petersen, Damsgaard and Dalskov 13 ).
CYP2R1 encodes the key enzyme responsible for converting vitamin D to 25(OH)D in the liver( Reference Berry and Hypponen 14 ). Hence, it is highly plausible that SNP in this gene affect 25(OH)D synthesis and thereby serum concentration. GC encodes the DBP that binds and transports vitamin D and its metabolites in the body( Reference Wang, Zhang and Richards 15 ). It has been estimated that as much as 90 % of all circulating vitamin D is bound to DBP( Reference Powe, Evans and Wenger 45 ). As 25(OH)D bound to DBP appears less susceptible to hydroxylation and degradation, it has been suggested that an important function of DBP is to act as a 25(OH)D depot to stabilise and maintain 25(OH)D concentration( Reference Berry and Hypponen 14 ). In this way, GC SNP also appear plausible candidates to affect serum 25(OH)D concentration.
To our knowledge, we are the first to report association analyses on the basis of longitudinal data from repeated measurements in three seasons across a school year in children living at northern latitudes. The observed associations between GC SNP and serum 25(OH)D are consistent with previous studies among Danish and Finish children. Here, minor alleles of rs4588 were likewise associated with lower serum 25(OH)D concentrations( Reference Pekkinen, Saarnio and Viljakainen 17 – Reference Nissen, Vogel and Ravn-Haren 19 ). In comparison with our study, notable differences are that two of these studies are cross-sectional( Reference Pekkinen, Saarnio and Viljakainen 17 , Reference Nissen, Rasmussen and Ravn-Haren 18 ) and that 25(OH)D measurements in one study were conducted in late summer only( Reference Nissen, Rasmussen and Ravn-Haren 18 ). These studies did not evaluate rs7041. Two large genome-wide association studies have, however, found GC rs2282679 (the near proxy for rs4588 in our study) and rs7041 to be the vitamin D-related SNP most strongly associated with serum 25(OH)D( Reference Wang, Zhang and Richards 15 , Reference Ahn, Yu and Stolzenberg-Solomon 36 ). The directions of these associations were detailed for GC rs2282679 only. One study reported an increasing number of minor alleles in rs2282679 to be associated with higher risk of vitamin D insufficiency (serum 25(OH)D<50 nmol/l)( Reference Wang, Zhang and Richards 15 ), and the other study reported that individuals who are homozygous for the minor allele of rs2282679 have lower serum 25(OH)D than individuals who are homozygous for the major allele( Reference Ahn, Yu and Stolzenberg-Solomon 36 ). Hence, the directions of this proxy SNP are similar to our findings.
Likewise, the associations we observed between CYP2R1 SNP and serum 25(OH)D are generally consistent with findings from previous studies. Indeed, genotypes of rs10741657 and rs1562902 were associated with serum 25(OH)D concentrations in a similar way in the previously mentioned cross-sectional study in Danish children( Reference Nissen, Rasmussen and Ravn-Haren 18 ). This study did not include rs10500804. However, one of the large genome-wide studies included the CYP2R1 rs10500804 and rs10741657 and likewise found these to be highly associated with serum 25(OH)D( Reference Wang, Zhang and Richards 15 ). Here, an increasing number of major alleles in rs10741657 were associated with a borderline (P=0·06) higher risk of vitamin D insufficiency (serum 25(OH)D <50 nmol/l), thereby indicatively similar to our findings. However, no such detailed data was reported on rs10500804( Reference Wang, Zhang and Richards 15 ).
Interestingly, we found the association between season and serum 25(OH)D concentration to be modified by GC rs7041. This modification was observed as absence of an increase in serum 25(OH)D concentration from winter to spring among children who were homozygous for the minor allele compared with the two other genotype groups, who experienced highly significant increases in serum 25(OH)D concentrations between these two seasons. The Engelman et al. ( Reference Engelman, Meyers and Iyengar 22 ) study has previously investigated effect modifications regarding season, SNP and serum 25(OH)D in a somewhat comparable manner. This American cross-sectional study in postmenopausal women (42–46°N) included CYP2R1 rs10500804 and GC rs4588 and rs7041, and, similarly to our findings, observed an effect modification with rs7041 only (P interaction=0·01)( Reference Engelman, Meyers and Iyengar 22 ). It is during spring that the cutaneous synthesis of vitamin D becomes feasible again at northern latitudes, and we hypothesise that the major rs7041 allele might be associated with higher susceptibility to 25(OH)D synthesis from UVB sunlight than the minor allele. Indeed, strong evidence of SNP as effect modifiers of vitamin D sources on serum 25(OH)D concentrations has been found in Scandinavian intervention studies. A Norwegian vitamin D3 supplement trial found a significant relation between CYP2R1 rs10741657, GC rs2282679 and rs7041 genotypes and increase (Δ) in 25(OH)D( Reference Sollid, Hutchinson and Fuskevag 46 ). Also, without evaluation of GC rs7041, two Danish intervention studies found smaller end-study serum 25(OH)D concentrations in carriers of major alleles of CYP2R1 rs10741657 and of minor alleles of GC rs4588 compared with non-carriers, after treatment with artificial UVB irradiation and consumption of vitamin D3 fortified bread and milk( Reference Nissen, Vogel and Ravn-Haren 19 , Reference Nissen, Vogel and Ravn-Haren 47 ). We did not observe interaction effects with CYP2R1 rs10741657 and GC rs4588, but similarly to the directions in the intervention studies we did observe an increasing number of major alleles of CYP2R1 rs10741657 and increasing number of minor alleles of GC rs4588 to be associated with lower serum 25(OH)D concentrations across the three seasons. Hence, the observed associations between common genetic variants in vitamin D-related genes and serum 25(OH)D concentrations could be a result of genetic effect modifications of vitamin D sources on serum 25(OH)D.
Because of the inverse association between serum 25(OH)D and PTH, we hypothesised that genetic variations found to modify serum 25(OH)D concentration might also modify serum PTH. Yet, GC rs7041 was not found to be associated with PTH either with or without inclusion of the interaction term between season and rs7041. This indicates that other factors influence PTH levels, and our hypothesis could not be confirmed. The GC gene encodes DBP that transports vitamin D and its metabolites in the body, and the rs7041 minor allele has been associated with lower DBP levels. Yet, it has simultaneously been indicated that low serum 25(OH)D concentrations do not uniformly indicate vitamin D deficiency if accompanied by low DBP. In a study of 2085 healthy black and white Americans, it was suggested that low levels of DBP actually result in higher 25(OH)D bioavailability and, hence, provide protection against manifestations of vitamin D deficiency despite lower levels of total serum 25(OH)D( Reference Powe, Evans and Wenger 45 ). Also, a recent Norwegian study found that direct measurement of free 25(OH)D diminishes differences between DBP phenotypes compared with serum total 25(OH)D( Reference Sollid, Hutchinson and Berg 48 ). Based on this, it is speculated that children in our study with rs7041 minor alleles (and risk alleles of other GC SNP) might have levels of bioavailable 25(OH)D that are equivalent to the children with major alleles despite an overall lower level of the measured serum 25(OH)D. This might explain why we did not observe similar rs7041 modified seasonal differences in PTH levels as with serum 25(OH)D. However, the accuracy of the DBP assay applied in the American study has recently been called into question( Reference Denburg, Hoofnagle and Sayed 49 ), and the final answers regarding genetic differences in bioavailable 25(OH)D are still unclear.
In our study, we were able to adjust for several important factors. However, there is always a risk of residual confounding, and it is a limitation that our study did not include direct measurements of the children’s sun exposure or sunny vacations. Also, the descriptive nature naturally limits the ability to draw conclusions about causality. Data were obtained from a trial that was not designed to investigate seasonal effects, and data from the summer season are not present, which limits extrapolation to differences in serum 25(OH)D concentrations on an all-year basis. Yet, measurements ran across a school year of approximately 10 months and had 3-month intervals between measurements of each child. Therefore, we believe seasonal variation to be well captured by the available serum 25(OH)D measurements. Our hypothesis and observation of a SNP modification is supported by findings in observational studies and in randomised controlled trials, although some are with different SNP. The interaction analyses were applicable considering the aim and longitudinal design. It parallels the approach by Engelman et al.( Reference Engelman, Meyers and Iyengar 22 ) but differs in study design (longitudinal v. cross-sectional). Naturally, the risk of type II error should be considered. Slightly fewer children were homozygous for the minor allele of GC rs7041 compared with the two other genotype groups. Yet, our results of this interaction analysis are supported by the seasonal mean serum 25(OH)D concentrations of the rs7041 genotypes presented in Table 3 and by the observation of a similar modification by Engelman et al. ( Reference Engelman, Meyers and Iyengar 22 ). In view of the explorative nature of our study, we have opted for reporting P-values unadjusted for multiple comparisons in combination with cautious interpretation of results, particularly regarding the modification results, which need to be validated through similar trends in other studies. The robust findings throughout the analyses and comparable findings with other studies do not, however, suggest random findings. There are several strengths to the present study. We were able to adjust for the original intervention as well as for all the direct and proxy measurements of vitamin D determinants previously established in this study sample( Reference Petersen, Damsgaard and Dalskov 13 ). Indeed, the extent and validity of the collected data, such as ≥4 d of web-based dietary recordings and validated objective accelerometry measurements of physical activity, make the study unique. The large study sample combined with three repeated measurements of each child makes the study larger than any previous studies on vitamin D status and genetic variation conducted among Scandinavian children. Finally, the longitudinal design reduces the between-subject variation, which is profoundly relevant considering the complexity of serum 25(OH)D evaluation.
In conclusion, our results suggest that common genetic variants in CYP2R1 and GC are associated with substantially lower serum 25(OH)D concentrations across the year in children living at northern latitudes. Potentially, this is due to modified serum 25(OH)D responses to UVB sunlight exposure as observed with GC rs7041. This field has potential implications for public health recommendations and clinical practice guidelines regarding the achievement of adequate serum 25(OH)D concentrations between genotypes. Our results call for further longitudinal investigations into genetic associations with serum 25(OH)D and vitamin D-related health outcomes in children at northern latitudes.
Acknowledgements
The authors greatly thank all the children and their families, the school management, the teachers and all other staff at the schools as well as the OPUS study team (kitchen staff, dietitians, laboratory technicians and students) for their participation and contribution to the study.
The OPUS project ‘Optimal well-being, development and health for Danish children through a healthy New Nordic Diet’ was supported by a grant from the Nordea Foundation (grant no. 02-2010-0389). Danæg A/S, Naturmælk, Lantmännen A/S, Skærtoft Mølle A/S, Kartoffelpartnerskabet, AkzoNobel Danmark, Gloria Mundi and Rose Poultry A/S provided foods in kind for the study. Sources of funding and donation had no role in the trial design, conduct of the study, the collection, analysis or interpretation of data and findings, the preparation of the manuscript or the decision to publish.
C. M., K. F. M., A. A., I. T., L. B. S., C. T. D. and R. A. P. designed research; R. A., M. F. H., L. B. S., C. T. D. and R. A. P. conducted research; C. R. and R. A. P. analysed data; H. K. provided acquisition of data; L. H. L. provided substantial contribution to interpretation of data; R. A. P. wrote the article; R. A. P. had primary responsibility for the final content. All authors revised the paper critically and provided final approval.
The authors declare that there are no conflicts of interest.
Supplementary material
For supplementary material/s referred to in this article, please visit https://doi.org/10.1017/S0007114517000538


