


Non-communicable diseases (NCD) such as CVD and type 2 diabetes are the leading cause of global mortality in developed countries. Metabolic changes such as raised blood pressure, blood glucose and cholesterol as well as being overweight/obese are associated with increased risk of NCD, all of which can be modified by lifestyle(1). An important lifestyle modification to decrease the risk of developing NCD is diet. Dietary protein has been shown to modulate blood glucose response by stimulating insulin release via yet unclear mechanisms(Reference Gannon and Nuttall2) and to decrease energy intake associated with increased satiety signals(Reference Paddon-Jones, Westman and Mattes3). However, current industrialised nations mainly rely on animal-based protein, and such production practices are detrimental to the environment through fossil fuel usage, animal methane production, effluent waste, water and land consumption(Reference Swinburn, Kraak and Allender4). High red and processed meat intake is positively associated with diabetes, CVD, weight gain and total mortality, and its substitution of plant protein was associated with lower mortality(Reference Song, Fung and Hu5,Reference Godfray, Aveyard and Garnett6) . Therefore, sustainable meat alternatives with similar or healthier nutrition value are to be explored. On the other hand, dietary fibre intake (mainly from plant sources which have a lower environmental impact compared with meat and dairy products(Reference Davis, Sonesson and Baumgartner7)) has been shown to decrease blood glucose via delayed gastric emptying and gut microbiota fermentation(Reference Gill, Rossi and Bajka8). Total cholesterol and LDL-cholesterol have also been shown to decrease following interventions with fibre possibly via mechanisms such as decreased insulin secretion of hepatic cholesterol synthesis, prevention of bile salt reabsorption and increased SCFA production(Reference Gunness and Gidley9). Furthermore, dietary fibre intakes reduce the energy density of foods and delays gastric emptying, subsequently decreasing appetite, energy intake and ultimately modulating body weight(Reference Wanders, van den Borne and de Graaf10). In this context, mycoprotein is a fungal-based ingredient characterised by being high in both dietary fibre (66 % fungal β-glucan and 33 % chitin) and protein, and low in energy (Table 1). The protein content of mycoprotein has been shown to be as bioavailable as whole milk, chicken and eggs, and to stimulate muscle anabolism similarly to leucine-matched milk protein (ref Edwards, Monteyne, Dunlop). Mycoprotein-based foods are produced much sustainably in comparison with animal-derived proteins. For example, compared with beef mince, Quorn mince uses 89 % less carbon (16·21 v. 1·74 kg CO2e/kg), 94 % less land (0·0068 v. 0·00038 ha/kg) and 90 % less water (l/kg)(11).
Table 1. Nutritional composition of mycoprotein, Quorn and beef mince

* Source: Finnigan et al., 2017.
‡ Source: Sainsbury’s website.
Mycoprotein-based foods are commercially available under the brand name Quorn in seventeen countries across the world and are growing in popularity in the UK as meat replacements(Reference Finnigan, Wall and Wilde12). A recent systematic review suggested that an acute intake of mycoprotein increases insulin sensitivity and decreases energy intake in healthy lean and overweight individuals compared with matched animal-derived protein(Reference Cherta-Murillo, Lett and Frampton13). In addition, chronic mycoprotein interventions have resulted in a reduction in LDL-cholesterol and total cholesterol in both controlled and free-living settings(Reference Turnbull, Leeds and Edwards14–Reference Coelho, Monteyne and Dirks16). Although the mechanisms underpinning these effects are poorly understood, it is possible that the high fibre and protein content of mycoprotein may have contributed to these effects, although literature on the effects of fungal-derived chitin and β-glucan on blood glucose and lipids in humans is very scarce. Interestingly, it has been recently suggested that the unique food structure of mycoprotein (known as hyphae) may act as a mechanism underpinning the metabolic effects by acting in the upper gastrointestinal tract. In vitro evidence suggests that the hyphal structure can trap digestive enzymes such as amylase and bile salts during digestion, consequently decreasing starch hydrolysis and lipolysis, and hindering the digestion, absorption and appearance in blood of carbohydrates and lipids(Reference Colosimo, Warren and Edwards17). Other mechanisms underpinning the effects of mycoprotein on appetite and potentially on blood glucose control are the possibility that insoluble parts of mycoprotein (such as the fibre portion) can act as a substrate for gut microbiota fermentation and stimulate the production of SCFA, linked to glucose metabolism and appetite central regulation(Reference Byrne, Chambers and Morrison18), as shown in one in vitro study using healthy stool samples(Reference Harris, Edwards and Morrison19).
These studies investigated the effect of mycoprotein-based foods (referred hereon as mycoprotein) on NCD’s risk factors such as blood glucose, lipid profile and energy intake. However, the majority of these studies were well-controlled studies, primarily of an acute and controlled nature, which do not represent a free-living setting. We therefore investigated the association between mycoprotein intake and diet quality, energy and nutrient intake as well as NCD’s risk factors using data from a nationally representative cohort to provide insight into the impact of mycoprotein consumption on NCD’s risk in a free-living setting.
Methods
A cross-sectional analysis was performed and reported in line with the STROBE-Nut checklist(Reference Bottin, Swann and Cropp31).
The National Diet and Nutrition Survey Rolling Programme and study population
The National Diet and Nutrition Survey Rolling Programme (NDNS-RP) is a long-term governmental survey scheme to assess nutrient intake of free-living population households in the UK (England, Scotland, Wales and Northern Ireland) that are 1·5 years old or above. Between 2008 and 2017, people from the UK were randomly selected and invited to complete a four-consecutive day food diary, an interview (dietary habits, socio-demographic background and lifestyle), have anthropometric measurements undertaken and to provide overnight fasting blood (for non-diabetics, otherwise non-fasting samples were obtained) and urine samples. Food diary data were processed by trained coders and entered into the Medical Research Council human nutrition research dietary assessment system called ‘Diet In Nutrients Out’(20). Food composition from the Department of Health’s NDNS Nutrient Databank was used to calculate macro- and micronutrient intake. Composite items such as sandwiches and home-made meals were coded as individual foods. Two quality controls on the food diary-coded data were performed by editors independent of the coders. The first was aimed to identify missing data fields and assess the feasibility of maximum and minimum portion sizes entered within each subsidiary food group. This was undertaken on a random subsample (10 % of total diary sample). The second quality control was aimed to identify extreme high or low nutrient intakes (outside the 2·5 and 97·5 percentiles for their age and sex group as based on previous NDNS data). This quality check was performed by the editors, with extreme values being checked against the food diary entries. Further details on the NDNS-RP methodology are described elsewhere(Reference Bates, Lennox and Prentice21). In this study, the mean of the four consecutive days of reported dietary data was calculated and used for the analysis. The NDNS-RP was conducted according to the Declaration of Helsinki guidelines, and ethical approval was obtained by the local Research Ethics Committees of the areas covered by the survey. All participants gave informed consent. The cross-sectional analysis hereby reported includes data from adult participants (≥18 years old, n 5507), who participated in the study in the years 1–9 of the NDNS-RP (2008–2017).
Non-communicable diseases’ risk markers
NCD’s risk markers such as BMI (kg/m2), systolic and diastolic pressure (mmHg), total cholesterol (mmol/l), triacylglycerides (mmol/l), HDL-cholesterol (mmol/l), LDL-cholesterol (mmol/l), total cholesterol:HDL ratio, C-reactive protein (mg/l), fasting blood glucose (mmol/l) and glycated HbA1c (%) were included in this analysis. Body weight and height were measured using a portable stadiometer and a weight scale, respectively, which allowed the calculation of the BMI by the field researchers. Trained researchers took blood pressure from volunteers who rested in a sitting position after a 5-min rest. Measurements were taken in three occasions using Omron HEM907, and the mean value of second and third value readings was used for analysis. Protocol for blood sample collection, processing, analysis and quality controls is described elsewhere(Reference Huijbregts, Feskens and Räsänen22). Missing data for blood pressure, BMI and blood analytes were omitted, and only available data were included in the analysis. The sample size for each blood pressure and blood analyte is reported in the Tables reporting associations in the Results section.
Diet quality assessment
The quality of the diet was assessed by generating an indicator and a score based on the already existing healthy diet indicator (HDI)(Reference Sacks, Obarzanek and Windhauser23) and the dietary approaches to stop hypertension (DASH) score(Reference Stefler, Pikhart and Jankovic24). HDI was developed in 1997 reflecting the WHO dietary recommendations (1990) aimed at preventing the development of chronic diseases. HDI has been associated negatively with overall and NCD’s mortality(Reference Berentzen, Beulens and Hoevenaar-Blom25), but not with cancer risk(Reference Mellen, Gao and Vitolins26). HDI includes nutrients and foods such as SFA, PUFA, protein, complex carbohydrates, fibre, fruit, vegetables, pulses, nuts, seeds and total sugar score. DASH was established in 1995 with the initial aim to reduce blood pressure. DASH score(27) contemplates eight target nutrients such as total fat, saturated fat, protein, fibre, cholesterol, Ca, Mg and K. DASH scores ≥ 4·5 are considered to be DASH concordant. Cholesterol intake data were missing in the NDNS-RP database. For this reason, this nutrient was omitted in its calculation; therefore, for this study, DASH concordant score is considered to be ≥ 3·5.
Mycoprotein-based foods’ energy (kcal), weight (g) intake and mycoprotein consumers (>1 % kcal of four-consecutive day average energy intake from mycoprotein) were quantified prior to analysis. A quartile segregation of mycoprotein consumers was omitted because of the small sample size of mycoprotein consumers (n 191). Mycoprotein-based foods labelled with the name ‘Quorn’ included: dippers, goujons, burgers, mycoprotein and pieces, quarter pounder grilled, sausage, mini eggs, sliced meats for all years (1–9), in addition to vegetarian sausage roll, pie, bacon-style strips, cottage pie for most years (1–8), as well as breadcrumbs including nuggets, stir fried, lasagne for years 1–4.
Statistical analysis
Normality of the data was checked visually from the normal residual distributions Q-Q plots. Normally distributed data are presented as mean values with their standard errors, and non-normally distributed data are presented as medians and interquartile range for demographic variables, and as survey adjusted means with their standard errors for nutrients, diet quality scores and NCD’s risk factors for both non-consumers and consumers of mycoprotein-based foods. Measures on blood samples, anthropometric and blood pressure data were not available for all participants; however, comparisons and associations of these measurements with mycoprotein consumption were analysed only for the remaining participants described in the summary Tables in the Results section. To assess the association between mycoprotein consumption and demographic variables, a survey-adjusted general linear model was used. To assess the associations between mycoprotein consumption and nutrients, diet quality scores and NCD’s risk factors, a survey-adjusted general linear model with predictors for age, sex, BMI, ethnicity, region of residency, socio-economic and smoking status, and alcohol, energy density, total energy and fibre (except fibre from mycoprotein) intakes, and HDI was performed. For the association with alcohol, fibre, energy intake and energy density, the above adjusted model was not including the covariates alcohol, fibre, energy intake and energy density, respectively. Collinearity of variables was checked using variance inflation factor; values <10 were considered not collinear. Squared root transformation of skewed variables was performed. To assess differences between consumers and non-consumers, independent t tests were performed for the survey adjusted means with their standard errors. Survey weight factors for individuals (wti_), nurses (wtn_) and blood measurements (wtb_) were used for each specific survey year to control for any potential selection bias in the associations with nutrient intake, diet quality and body weight (wti_ used), blood pressure (wtn_ used) and blood markers (wtb_ used). Pre-processing of the data was performed using R Studio 1.3.1056 using the tidyverse, tidyr, reshape2 and dplyr packages, and statistical analysis was performed using the survey and svydiags package. A two-sided P-value of ≤0·05 was considered as statistically significant. A sensitivity analysis was performed to identify the differences between participants with full data set compared with those with missing data for blood, BMI and blood pressure. A t test considering unequal variance and one-way ANOVA was performed. The results are described in the Supplemental Materials Tables S1–S6.
Results
Demographic characteristics
Overall, 3·44 % of the adult UK sample population have been identified as mycoprotein consumers, of these 28·27 % are vegetarian, 0·5 % are vegan and 71·73 % are omnivores. 96·56 % of the adult UK sample population have been identified as non-mycoprotein consumers, and of these, 1·42 % were vegetarian, 0·15 % vegan and 98·41 % omnivores. The percentage of mycoprotein consumers in the population varied from survey year to year, with an overall 21·50 % increase in percentage of consumers from years 2008/2009 to 2016/2017 (Fig. 1). The change in total diet energy obtained from mycoprotein intake, the total grams of mycoprotein, total energy from mycoprotein and energy density from mycoprotein intake in the mycoprotein consumer group over the survey years is described in the Supplementary Table S7. The median age in mycoprotein consumers was lower than in non-mycoprotein consumers (−7 years). In mycoprotein consumers, the proportion of females was considerably higher than of men (+24 %), whereas in non-consumers, the difference is smaller (+16 %). White ethnicity was predominant over other ethnicities for both mycoprotein consumers (95 %) and non-consumers (92 %), and most of the population was representative of England region (67 % and 59 %, respectively). A higher proportion of mycoprotein consumers had higher (+6·3 %) or lower managerial (+6·2 %) professional occupations compared with non-consumers. A fewer proportion of smokers were found to be mycoprotein consumers compared with the non-consumers (−9 %). The survey-adjusted generalised linear model showed that mycoprotein consumption in adults was significantly associated with age (P < 0·001) and smoking status (P = 0·02). The demographic characteristics for both non- and mycoprotein-based foods adult consumers, as well as the associations between mycoprotein consumer group and demographic characteristics, are shown in Table 2.

Fig. 1. Percentage of mycoprotein consumers by survey years. Mycoprotein consumers constituted the 3·43% (2008–2009), 2·68% (2009–2010), 3·39% (2010–2011), 3·81% (2011–2012), 3·36% (2012–2013), 3·32% (2013–2014), 3·98% (2014–2015), 2·80% (2015–2016), 4·17% (2016–2017) of the sample population from each year.
Table 2. Characteristics of mycoprotein-based foods consumers compared with non-consumers in the UK adult population (>18 years old) based on National Diet and Nutrition Survey (NDNS) years 2008/2009–2016/2017
(Median and interquartile range (IQR), numbers and percentages, n 5507)
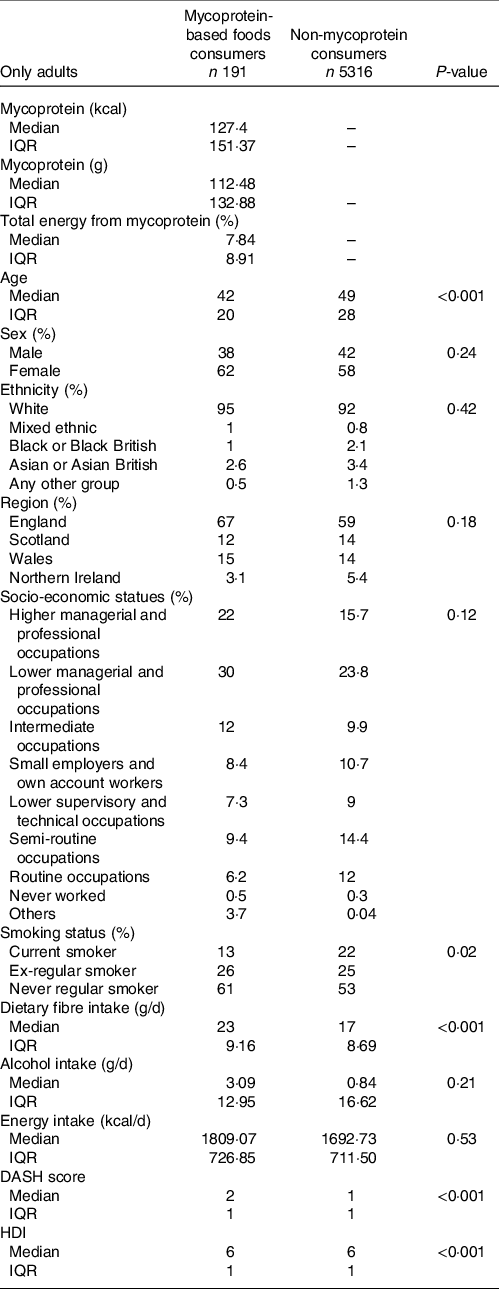
DASH, dietary approaches to stop hypertension; HDI, healthy diet index.
Survey-adjusted generalised linear model was used to investigate the association between being a mycoprotein consumer and demographic variables. No variables were used to adjust the model.
P-value ≤0·05 considered to be a significant association.
Nutrient intake and diet quality
Overall, the median consumption of mycoprotein in consumers is 127·4 kcal or of 112·48 g, contributing to a 7·84 % of the total energy (Table 2). The survey-adjusted means showed that mycoprotein consumers had a significantly higher intake CN6 PUFA (+6·46 %, P = 0·04), carbohydrate (+4·45 %, P < 0·001), starch (6·56 %, P > 0·00) and fibre (+22·18 %, P < 0·001) and lower intake of protein (−8·71 %, P = 0·00) and alcohol (−31·61 %, P = 0·04) relative to non-consumers. HDI median and DASH score were statistically significantly greater for mycoprotein consumers by +8·98 % and +23·33 %, (P < 0·001, both). The other variables were not statistically significantly different between the two groups. The nutritional intake for both non- and mycoprotein-based foods adult consumers is shown in Table 3.
Table 3. Nutrient values in UK adults (≥18 years) based on NDNS 2008/09-2016/17, in consumers of mycoprotein-based foods and non-consumers (N=5507) and association of mycoprotein consumers and nutrients.

CMUFA, monounsaturated fatty acids; CN6PUFA, CN6 poly unsaturated fatty acids; CN3PUFA, CN3 poly unsaturated fatty acids; HDI, healthy diet index; DASH, Dietary approaches to stop hypertension score; SE, standard error of the mean. Differences between consumers and non-consumers were tested using independent t tests assuming unequal variance. P-value ≤ 0.05 considered to be a statistically significant difference between consumers and non-consumers. Associations were obtained by performing a survey-adjusted generalised linear model with predictors: age, sex, BMI, ethnicity, region of residency, socio-economic and smoking status, alcohol, energy density, total energy, HDI, fibre (expect mycoprotein fibre). Energy density and energy intake were used for all measurements except for energy density (where energy density as predictor was omitted), energy (where energy intake as predictor was omitted), alcohol (where alcohol as a predictor was omitted), fibre (where fibre (except mycoprotein fibre) as a predictor was omitted), and HDI (where HDI as a predictor was omitted).
The associations between the mycoprotein consumer group and nutrient intake and diet quality are shown in Table 3. Mycoprotein consumers were statistically significantly associated with slightly increased food energy (kcal) (+0·22, P < 0·001) and total energy (kcal) (+3·09, P < 0·001), but reduced energy density (food kcal/g) (−0·08, P < 0·04). Furthermore, positive statistically significant associations between mycoprotein consumers and specific nutrients were found for CN6PUFA (+0·57 %, P < 0·04), CN3PUFA (+0·10 %, P < 0·04), starch (+1·97 %, P < 0·04) and fibre (g) (+3·17, P < 0·001). There were statistically significant associations between mycoprotein consumers and reduced intake of total sugars (−1·75 %, P < 0·001), non-milk extrinsic sugars (−3·20 %, P < 0·001), free sugars (−2·83 %, P < 0·001) and alcohol intake (g) (−1·35, P < 0·001). For healthy diet scores, mycoprotein consumers were statistically significantly associated with increased HDI (+0·19, P < 0·001) and DASH score (+0·26, P < 0·001), when adjusted for age, sex, BMI, ethnicity, region of residence, socio-economic and smoking status, alcohol, energy intake, energy density and non-mycoprotein fibre intake.
Non-communicable diseases’ risk markers
The NCD’s risk markers for both non- and mycoprotein-based foods adult consumers are shown in Table 4. Mycoprotein consumers had a lower BMI compared with non-consumers which was statistically significantly different (−4·77 kg/m2, P = 0·00). Other markers such as fasting blood glucose and HbA1c were lower in the mycoprotein consumer group, but it did not reach statistical significance. The remaining NCD’s risk markers studied were not shown to be statistically significantly different between the two groups.
Table 4. NCDs’ risk markers values in consumers of mycoprotein based foods and non-consumers in UK adults (≥18 years) based on NDNS 2008/09–2016/17, and association of mycoprotein consumers and NCD’s risk markers.

BMI, body mass index; WC, waist circumference; SBP, systolic blood pressure; DBP, diastolic blood pressure; TC, total cholesterol; TAG, triglycerides; HDL-C, high-density lipoprotein cholesterol; LDL-C, low-density lipoprotein cholesterol; CRP, C-reactive protein; FBG, fasting blood glucose; HbA1c, glycated haemoglobin A1c; SE, standard error of the mean; n, sample size. Differences between consumers and non-consumers were tested using independent t tests, assuming unequal variance. P-value ≤ 0.05 considered to be statistically significant difference between consumers and non-consumers. Associations were obtained by performing a survey-adjusted generalised linear model with predictors: age, sex, BMI, ethnicity, region of residency, socio-economic and smoking status, alcohol, energy density, total energy, HDI, fibre (expect mycoprotein fibre). For BMI, BMI as a predictor was omitted.
The associations between the mycoprotein intake and NCDs’ risk markers are shown in Table 4. Being a mycoprotein consumer was almost significantly associated with a lower BMI (−0·80 kg/m2, P = 0·05) when adjusted for age, sex, ethnicity, region of residency, socio-economic and smoking status, alcohol, non-mycoprotein fibre, energy density, total energy intake and HDI. Mycoprotein consumers were statistically significantly associated with lower fasting blood glucose (FBG) (−0·31 mmol/l, P = 0·00) and HbA1c (−0·06 %, P = 0·01) when adjusted for age, sex, BMI, ethnicity, region of residency, socio-economic and smoking status, alcohol, non-mycoprotein fibre, energy density, total energy intake and HDI. There was no statistically significant association between mycoprotein consumption and the rest of NCDs’ markers when adjusted for the aforementioned cofounders.
Discussion
Acute and chronic intervention studies suggest that mycoprotein may have a positive effect on glycaemia, insulinaemia, lipidaemia, appetite regulation and energy intake(Reference Cherta-Murillo, Lett and Frampton13–Reference Coelho, Monteyne and Dirks16). Nevertheless, the intake of mycoprotein in the free-living UK population and its association with demographics and nutritional profiles as well as with health parameters has never been investigated. In the present study, we aimed to investigate the association between mycoprotein intake and diet quality, energy, nutrient intake as well as NCD’s risk factors. The present cross-sectional study showed that mycoprotein consumers had a statistically significant higher intake of dietary fibre, total energy, DASH scores and HDI and lower BMI compared with non-consumers. Being a mycoprotein consumer was significantly positively associated with HDI, DASH score, fibre, PUFA, total and food energy intake but negatively associated with energy density, sugars, and alcohol intake, as well as lower FBG and HbA1c.
Being a mycoprotein consumer was associated negatively with energy density (kcal/g) intake. This finding is in contrast with the results of an acute feeding study in which overweight pre-menopausal females increased their intake choice of high energy density foods such as high-fat/high-sugar and low-fat/high-sugar foods, following mycoprotein intake compared with tofu and similarly to chicken(Reference Williamson, Geiselman and Lovejoy28). However, this study was performed in very controlled settings, potentially influencing participant’s choices in a free-living setting. Moreover, our results also showed that despite the negative association with energy density intake, mycoprotein consumer group has a slightly increased total and food energy intake. Altogether, this suggests increased eating rate in this group, which could be linked to a lack of a satiating macronutrients intake, such as protein, for which mycoprotein consumer’s intake was 8·71 % less than non-mycoprotein consumers. On the other hand, mycoprotein consumers obtained on average 22 % more dietary fibre, which is also known to be a satiating macronutrient, although it is possible that overall, mycoprotein consumers did not consume enough amount of satiating macronutrients, explaining their increased total energy intake. Our findings are surprising since mycoprotein is rich in dietary protein and fibre – two macronutrients that have a role at suppressing appetite and energy intake(Reference Williamson, Geiselman and Lovejoy28–Reference Swindell, Mackintosh and McNarry32) via a myriad of mechanisms. Clinical data from controlled studies have shown a consistent effect between acute mycoprotein intake (mean intake of 102·1 g) and reductions in appetite, energy intake post-24 h and at ad libitum (Reference Bottin, Swann and Cropp31,Reference Swindell, Mackintosh and McNarry32) . Energy intake is an important determinant of NCD’s risk, especially if it surpasses energy expenditure and it results in increased body weight and BMI. We also showed that on average, mycoprotein consumers had a lower BMI compared with non-consumers and BMI was almost significantly negatively associated with this consumer group. The more favourable BMI tendency suggests that the mycoprotein group may be more physically active, despite an association with higher energy intake, but this was not possible to assess as a standard measurement for such physical activity was missing for some survey years.
Overall, diet quality scores such as HDI and DASH score were positively associated with being a mycoprotein consumer and were significantly higher in the mycoprotein group by 8 and 23 %, respectively. This suggests that mycoprotein consumers in general have a healthier choice of foods, including foods aimed at modulating the risk for hypertension, which is a NCD’s risk marker. In particular, the nutrient intake mycoprotein consumers were associated with higher starch and CN3PUFA and CN6PUFA. Resistant starch (the fraction of starch that resists digestion and constitutes fibre) has been positively linked to improved NCD’s risk factors such as glycaemia, insulinaemia, bowel health, blood lipid profile, and increased satiety and reduced energy intake(Reference Nugent33). However, NDNS data do not provide details for resistant starch intake, opening an avenue for research. PUFA intake has been consistently shown to have favourable effects in glycaemic control, insulin resistance and insulin secretion(Reference Imamura, Micha and Wu34) and to be linked to improving cardiometabolic health(Reference Monnard and Dulloo35). Moreover, alcohol intake was negatively associated with being a mycoprotein consumer, possibly explaining the significantly lower tendency of an increased BMI in this group.
The mycoprotein consumer group had a significantly higher intake of dietary fibre (+22 %) compared with non-consumers, and being a consumer was significantly associated with a 3·71 g increase in fibre intake. Considering that mycoprotein-based foods have on average 6 % dietary fibre, it is estimated that mycoprotein intake contributed to 29 % of the total dietary fibre intake, giving a 6·74 g median increase in fibre intake in the consumer group. Mycoprotein consumers were estimated to eat 23 g of fibre/d on average, being closer to the Scientific Advisory Committee on Nutrition recommendations for fibre of 30 g/d(Reference Janelle and Barr36), compared with the non-consumers who had an average fibre intake of 17 g/d. This indicates that mycoprotein could possibly represent an important dietary element to increase one’s intake of fibre to meet the current dietary fibre intake daily recommendations. A recent systematic review and meta-analysis of epidemiological studies and randomised controlled trials (RCTs) with people with T2D showed that dietary fibre intake improved glycaemic control, blood lipids, body weight and inflammation, as well as a reduction in premature mortality, which are all linked to NCD’s risk prevention(Reference Reynolds, Akerman and Mann37). In line with this, in this study, we have reported that mycoprotein consumers were associated with lower FBG. There is controversy in regard to the validity of FBG as a clinical marker for NCD’s risks(Reference Cavalot, Petrelli and Traversa38), and other glycaemic measures such as oral glucose tolerance test or Hb1Ac are better at predicting NCD’s risk(Reference Hill and Blundell39). Even though oral glucose tolerance test data were not available in the NDNS database, HbA1c available data have shown to be strongly negatively associated with being a mycoprotein consumer, when adjusted for all cofounders, including healthy diet. These associations with glycaemia could be partly attributed to the effect of both the fibre content of mycoprotein and the unique hyphal food structure. Acute human trials have shown that while there is not a significant effect on postprandial blood glucose following mycoprotein intake, a reduced postprandial insulin is evident compared with macronutrient-matched chicken or soya(Reference Bottin, Swann and Cropp31,Reference Turnbull and Ward40) . Further analysis has shown significant increase in insulin sensitivity following doses ranging 44–132 g of mince mycoprotein in overweight and obese humans. However, it seems that these effects were not replicated in one chronic study where meat and fish were replaced for mycoprotein for 7 d in healthy participants(Reference Coelho, Monteyne and Dirks16). Although the current evidence from human trials is small and heterogenous, a recent in vitro study exploring the behaviour of mycoprotein during digestion as a mechanism underpinning postprandial metabolic response following mycoprotein intake showed a proportional inhibition of starch hydrolysis with increasing doses of mycoprotein. Moreover, using fluorescent microscopy, it was observed a physical entrapment of amylase enzyme within the hyphal structure, suggesting that during digestion, mycoprotein may delay carbohydrate digestion and absorption, reducing glycaemic response(Reference Colosimo, Warren and Edwards17).
The data from the present study showed that 3·44 % of the surveyed adult participants consumed mycoprotein-based foods (an average of 147 g/d, equivalent to 2 servings of mycoprotein and representing an average of 7·84 % of their total energy intake). However, the 4-d food diaries used in this study did not allow to differentiation between regular mycoprotein consumers to those ‘occasional’ mycoprotein consumers. A 21·50 % increase in total mycoprotein consumers was observed from years 2008/2009 to 2016/2017, indicating a growing trend of people interested in meat replacement products, possibly due to changes in knowledge, awareness, mycoprotein-based foods variety and availability, and/or marketing. This goes in line with the increase in flexitarian (primarily but not strictly vegetarian) people over the last years(Reference Dagevos41). The demographic profile of mycoprotein consumers was more likely to be women, white, younger, living in England, belong to a higher socio-economic status, have greater dietary quality scores and less likely to be current smokers relative to non-consumers. This is in line with studies showing that women consume on average less red meat compared with men(Reference Derbyshire42) and that a higher socio-economic status is related to a healthier consumer bias. However, this limited the demographic representativeness of our associations, as we may have not had sufficient data from other demographic groups to explore associations between mycoprotein intake and nutrient, diet quality intake and NCD’s risk markers.
Flexitarian diets have been shown to be linked to the improvement of a wide range of health outcomes, and this goes in hand with the increasing evidence that red and processed meat have a negative impact to both planet and human health. A total of 28·7 % of mycoprotein-based food consumers were self-classed as vegetarian or vegan; it is likely that a considerable proportion of consumers were flexitarian too. Mycoprotein-based foods seem to be an attractive alternative to aid the switch from animal-based protein to plant-based protein, as qualities such as meat-resembling taste and protein bioavailability are not compromised. Furthermore, as we have shown, mycoprotein is positively associated with higher diet quality scores and lower NCD’s risk factors. Therefore, we believe it is paramount to find ways to increase the acceptability of mycoprotein-based foods within demographic groups which are at a particularly higher risk of developing NCD (i.e. males, older individuals, Black, Asian or minority ethnicities) and have a lower tendency to consume mycoprotein. Of importance, these demographic groups constitute a large proportion of the population at risk of NCD’s and could obtain a potential benefit from mycoprotein-based foods. The reasons why there is a smaller representation of other demographic subgroups within the mycoprotein consumer group should be explored, although factors such as economic power and education could be involved. It has been reported that higher cost of healthy diets is related to the socio-economical differences in diet quality(Reference Darmon and Drewnowski43) and that non-white ethnicities and lower socio-economical spend on average less pence per person per week in meat and vegetables compared with white and higher socio-economical statuses(44). In general, mycoprotein-based products have matching costs (£5·67–£6·67/kg) to their animal-derived protein equivalents (£3·30–£8/kg) (UK retailer price). Seven portions (75 g each a day) of mycoprotein-based foods a week would represent an approximate cost 297 pence per person per week, which is within the average meat expenditure of non-white communities (299–303 pence per person per week), suggesting that the cost of mycoprotein products in the UK may not be the reason why non-white ethnicities are not consuming mycoprotein-based foods in comparison to white communities. For this reason, we think that finding ways to promote mycoprotein-based food within other demographic subgroups may potentially benefit healthy dietary intakes and decrease NCD’s risk at a population level.
This study has some intrinsic limitations derived from its cross-sectional design, such as the inability to infer cause-and-effect relationships as it would have been possible with longitudinal data (including measurements of the same individual over time). Also, NDNS diet data come from self-reported 4-d food diaries, which are well-known to not be an accurate measurement of food intake. Furthermore, even though we identified some significant associations with NCD’s markers and diet quality, we were not able to adjust for physical activity which may act as a potential confounder, as the NDNS database lacked a standard physical activity measurement for all survey years. Importantly, there was a substantial lack of data for some variables, specifically for blood markers and blood pressure, which is likely due to a refusal to have the nurse visit or due to unobtained results following blood sample analysis. These variables possessed almost 50 % of missing data for both consumer and non-consumer group. Post hoc analysis showed some statistically significant differences in nutrient intakes and proportion of ethnic groups between participants with and without missing data for blood markers, BMI and blood pressure, particularly for the non-consumer group. Consequently, the results of the present analysis may be biased as they fail to capture the whole cohort, also potentially leading to loss of power for some variables.
In conclusion, 3·44 % of the surveyed population were identified as mycoprotein consumers and these were likely to be women, white, younger, living in England, belong to a higher socio-economic status and less likely to be current smokers relative to non-consumers. Mycoprotein consumers had on average a higher intake of dietary fibre, total energy, DASH and HDI scores and lower BMI compared with non-consumers. There was a positive association with mycoprotein consumers and HDI, DASH score, fibre, total and food energy intake, but a negative association with energy density, sugars, alcohol intake, and FBG and HbA1c NCD’s risk markers. This suggests that mycoprotein-based foods can have a positive effect at reducing NCD’s risk and efforts should be made to promote mycoprotein-based foods consumption within demographic groups at risk of NCD. Further investigations are needed to contrast these findings using more complete databases or longitudinal studies.
Acknowledgements
We would like to thank Mathilde Gressier for her advice on the analysis, and Dr Tim Finnigan and Dr Emma Derbyshire for their insights on the discussion.
The Section for Nutrition Research, Department of Metabolism, Digestion and Reproduction at Imperial College London is funded by grants from the MRC, BBSRC, NIHR, an Integrative Mammalian Biology (IMB) Capacity Building Award, an FP7- HEALTH- 2009- 241592 EuroCHIP grant and is supported by the NIHR Biomedical Research Centre Funding Scheme. The views expressed are those of the author(s) and not necessarily those of the NHS, the NIHR or the Department of Health. This work was supported by an educational no-string grant from Quorn Foods Ltd, Stokesley, UK. The funder, Quorn Foods Ltd, had no influence over the design, analysis and write-up of manuscript of the present study.
The authors’ contributions are as follows: A. C. -M. formulated the research question, designed the study, obtained the data from the UK data archive, pre-processed, analysed, interpreted the data and wrote the article; G. S. F. supervised the study and contributed to the writing of the discussion. All authors approved the final version of the manuscript.
A. C. M. is funded by a non-string educational grant from Quorn Foods Ltd. G. S. F. is currently giving and has given consultant advice to Quorn Foods Ltd.
Supplementary material
For supplementary material referred to in this article, please visit https://doi.org/10.1017/S000711452100218X


