


Obesity is one of the most severe health issues(Reference Chooi, Ding and Magkos1,Reference Agha and Agha2) . It is a significant risk factor for many metabolic diseases, such as CVD, diabetes and certain types of cancer, and it is associated with high mortality. The prevalence of obesity, including severe obesity, is increasing worldwide, and interest in dietary and lifestyle guidelines for the prevention and treatment of obesity is growing(Reference Swinburn, Caterson and Seidell3).
Legumes are nutritionally recognised for their high protein content and soluble fibre(Reference Kim, Choi and Kim4). Diets rich in legumes are beneficial because legumes contain thirty different polyphenols that modulate nitric oxide-dependent arterial, immune and inflammatory functions(Reference Llorach, Favaria and Alonsoa5). Legumes also contain some precursors of bioactive peptides that play essential roles in metabolic pathways(Reference Malika and Myriern6). The effects of dietary fibre on serum lipoproteins received much attention, but other biofunctional components in legumes are likely involved in their potential bioactivity(Reference Ruscica, Pavanello and Gandini7).
There are numerous studies on dietary soya protein and lipid profiles, and some studies suggested that soya intake reduced CVD risk and oxidative stress via an antioxidant capacity(Reference Jenkins, Kendall and Vidgen8,Reference Wiseman, O’Reilly and Adlercreutz9) . Beneficial effects of non-soya legumes were also observed(Reference Salehi-Abargouei, Saraf-Bank and Bellissimo10,Reference Bazzano, Thompson and Tees11) . The impact of legume consumption on weight reduction(Reference Jang, Moon and Ko12) and favourable outcomes for type II diabetes(Reference Azadbakht and Esmaillzadeh13,Reference Azadbakht, Atabak and Esmaillzadeh14) are well reported. However, limited clinical trials evaluated the effects of legumes on weight control, and the results are controversial(Reference Alizadeh, Daneghian and Ghaffari15).
Adiponectin is an adipocytokine derived from adipose tissue that is closely related to obesity-related metabolic dysfunction because it plays a vital role in the regulation of lipid and glucose metabolism. Antioxidant-mediated adiponectin regulation by transcription factors, such as PPAR-γ and sterol regulatory element-binding protein(Reference Han, Quon and Kim16–Reference Detopoulou, Panagiotakos and Chrysohoou18), may be the potential mechanism of the favourable effects of legume consumption on weight control.
Legumes are rich in nutrients that have antioxidant effects. The link between the reduction in oxidative stress levels and weight loss was elucidated in several studies(Reference Choroma’ nska, My’sliwiec and Łuba19,Reference Navas-Carretero, Cuervo and Abete20) . 8-Epi-PGF2α is a secondary end product of peroxidation, and it is excreted in a stable form in urine(Reference Milne, Musiek and Morrow21,Reference Morrow22) . It is a reliable indicator of oxidative stress, and an increased urinary level of 8-epi-PGF2α was observed in subjects with abnormal glycaemic control or high oxidation states(Reference Ahn, Kim and Seo23). However, to our knowledge, no studies used 8-epi-PGF2α as an index of oxidative stress to examine the antioxidant effects of legume consumption.
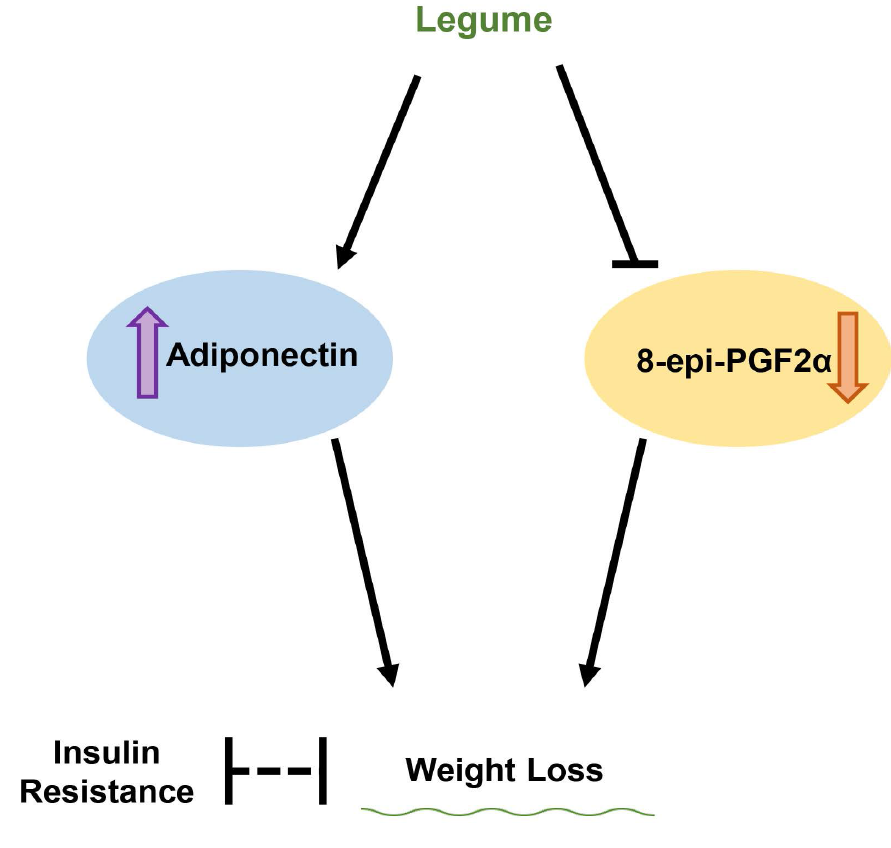
The present study performed a 12-week nutritional intervention to determine whether a diet enriched in legumes was associated with weight loss via the regulation of adiponectin and 8-epi-PGF2α in obese subjects. We also determined the mechanism of the effects of dietary legume consumption on weight loss.
Methods
Subjects and study design
A 12-week weight reduction programme was performed by the National Leading Research Laboratory of Clinical Nutrigenetics/Nutrigenomics at Yonsei University. Subjects with a BMI of 25 kg/m2 or higher based on the Asia-Pacific guideline(24) were recruited at the National Health Insurance Corporation Ilsan Hospital in Goyang, Korea between March 2011 and December 2012. People with a history of type 2 diabetes, CVD, thyroid disorders, liver or kidney disease or psychiatric problems and/or using any medications (e.g. antihypertensive, lipid-lowering, antiplatelet and antidiabetic) were excluded. Paper-based informed consent forms were obtained from all participants. The Institutional Review Board of Yonsei University approved the study protocol, which complied with the Declaration of Helsinki. The present study is also registered at ClinicalTrials.gov under NCT04392882 (retrospectively registered 19 May 2020).
The sample size was determined using the G * Power programme (Franz Faul) with an effect size of 0·3, statistical power of 80 %, a two-sided significance level of 0·05 and an allocation ratio of 1·4. The calculation of the effect size was based on a previous clinical trial(Reference Allison, Gadbury and Schwartz25) that showed significant changes in total body fat mass (%) with a 12-week legume-based diet. Considering a 10 % dropout rate, 400 participants were enrolled. The enrolled subjects (n 400) were randomly assigned to the legume-enriched diet (LD) group (n 168) or usual diet (UD) group (n 232) using a random number sequence generated in Microsoft Office Excel. The researchers were blinded until the intervention and assessment outcomes were collected. However, the registered dietitians were not blinded to manage the participants’ compliance.
Weight loss protocol and energy intake
One week before starting the 12-week programme, the enrolled subjects provided their UD information on a semiquantitative FFQ and 24-h recall method. Registered dietitians gave written and verbal instructions on completing a 3-d (two weekdays and one weekend day) dietary record. Individually planned diets were programmed for each subject based on their obtained nutritional data and referring to the Korean RDA (Korean Nutrition Society). The LD group was assigned to replace one-third of their refined rice intake with legumes as a carbohydrate source. We recommended beans, especially black soya beans, but the legume carbohydrate sources were not limited to black soya beans. The UD group was advised to consume their UD. Both groups were advised to increase their vegetable intake to at least six units (30–70 g/unit) per day to ensure a sufficient dietary fibre intake. The subjects were instructed to perform physical activity consisting of a regular 30-min walk after dinner each day.
A dietician interviewed participants biweekly via telephone to monitor compliance. Participants were asked whether they were following the programme well, including their dietary intake and physical activity. Standardised 3-d (two weekdays and one weekend day) dietary records were obtained from each participant at baseline and the 12-week follow-up visit. Dietary energy values and nutrient content were calculated using the Computer-Aided Nutritional Analysis Programme (CAN-pro 2.0; Korean Nutrition Society) based on the 3-d food records. A standardised physical activity record was also completed on the same day as the dietary record. The total energy expenditure of the subjects was calculated by multiplying the activity coefficient by the basal energy expenditure from the Harris–Benedict equation.
Anthropometric parameters, blood pressure and blood collection
All parameters were measured twice, at baseline (week 0) and follow-up (week 12). Body weights and heights were measured to calculate the BMI (kg/m2). Blood pressure was measured using an automatic BP monitor (TM-2654; A&D) after resting. After a fasting period of 12 h, venous blood specimens were collected in EDTA-treated or untreated tubes. Separated plasma and serum were stored at –70 °C until use in further analyses.
Serum glucose, insulin, lipid profiles, high-sensitivity C-reactive protein and urinary 8-epi-PGF2α
Detailed information about the assessments of levels of fasting glucose, insulin and serum high-sensitivity C-reactive protein (hs-CRP) is described in our previous study(Reference Kim, Kim and Yoo26). Analyses of TAG and total cholesterol levels were performed using a Hitachi 7150 Autoanalyzer (Hitachi Ltd.). HDL-cholesterol was separated from apoB-containing lipoproteins using dextran sulphate–Mg and measured enzymatically. LDL-cholesterol was estimated using the Friedewald formula in subjects with a serum TAG level ≤400 mg/dl. 8-Epi-PGF2α was measured in urine using an enzyme immunoassay (BIOXYTECH urinary 8-epi-PGF2α TM assay kit; OXIS International Inc.).
Insulin resistance and adiponectin
Insulin resistance (IR) was assessed using the homoeostasis model assessment (HOMA) formula: (fasting insulin (μIU/ml) × fasting glucose (mmol/l))/22·5. The plasma adiponectin concentration was measured using an enzyme immunoassay (Human Adiponectin ELISA kit; B-Bridge International Inc.) and Victor2 (Perkin Elmer Life Sciences).
Statistical analyses
We performed statistical analyses using SPSS ver 25.0 (SPSS Inc.). Before statistical analyses, the skewed variables were logarithmically transformed. To evaluate the differences in clinical variable levels between the two groups, independent t tests were used. For analysing differences between baseline/12-week follow-up time scales, paired t tests were used. Pearson’s correlation coefficients were used to investigate the relationships between variables over time.
Results
Among the enrolled subjects (n = 400), eight from the LD group and nine from the UD group dropped out during the intervention period for personal reasons or poor compliance, leaving 383 subjects.
Clinical characteristics and nutrient intake before and after dietary intervention
There were no significant differences in the clinical characteristics or nutrient intake between the two groups at baseline. At 12 weeks, weight (P < 0·001), BMI (P < 0·001), systolic blood pressure (P = 0·037) and diastolic blood pressure (P = 0·001) decreased compared with baseline in the LD group. Based on the daily nutrient intake results, energy intake (P < 0·001) and carbohydrate intake (P < 0·001) were reduced, and total energy expenditure (P < 0·001) and the intake of protein (P = 0·027), fat (P < 0·001) and fibre (P = 0·003) were increased in the LD group at 12 weeks compared with baseline. These patterns, except total energy expenditure (P < 0·001) and fibre intake (P = 0·037), were not present in the UD group at 12 weeks. Weight, BMI, energy, carbohydrate and fat intake showed significant differences at 12 weeks between the two groups and were different from baseline in both groups, but systolic blood pressure was significant only at 12 weeks (Table 1).
Table 1. Clinical characteristics and macronutrient indices at baseline and after the 12-week dietary intervention period of the participants
(Mean values with their standard errors of the mean)

*P < 0·05, **P < 0·01, ***P < 0·001 compared with baseline values in each diet group as tested using paired t test. P-values derived from independent t test.
† Tested using logarithmic transformation.
Serum glucose, insulin, lipid profiles, high-sensitivity C-reactive protein and 8-epi-PGF2α
At baseline, the two groups exhibited no significant differences in levels of serum glucose, insulin, hs-CRP, or 8-epi-PGF2α or lipid profiles. The LD subjects showed significantly decreased levels of glucose (P < 0·001), insulin (P < 0·001) and 8-epi-PGF2α (P = 0·021), and the level of HDL-cholesterol (P < 0·001) increased dramatically after the intervention (Table 2). There were no significant changes in the UD subjects. The levels of HDL-cholesterol (P = 0·003), glucose (P = 0·039) and insulin (P < 0·001) were significantly different at the end of the 12-week intervention between the two groups. The insulin level (P = 0·020) was significantly different between the two groups, and 8-epi-PGF2α tended to differ after the 12-week intervention period (Table 2).
Table 2. Effects of dietary intervention on lipid profiles and levels of glucose, insulin, hs-CRP and 8-epi-PGF2α at baseline and 12-week follow-up
(Mean values with their standard errors of the mean)
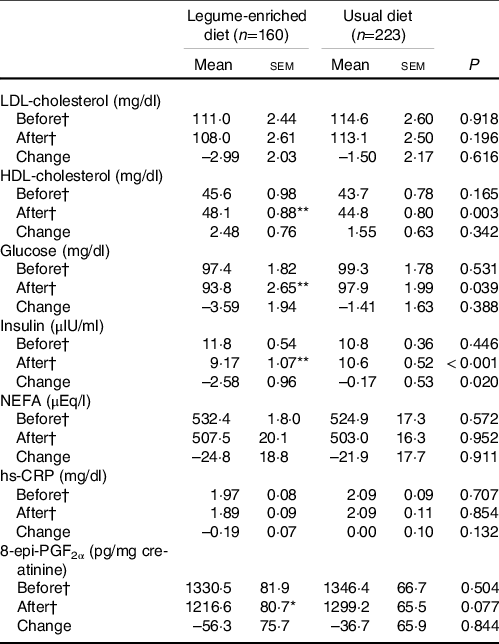
hs-CRP, high-sensitivity C-reactive protein.
*P < 0·05, **P < 0.001 compared with baseline values in each diet group as tested using paired t test. P-values derived from independent t test.
† Tested using logarithmic transformation.
TAG, homoeostasis model assessment-insulin resistance index and adiponectin
No significant between-group differences were found at baseline in TAG or adiponectin levels or the HOMA-IR index values. After the 12-week intervention, the TAG levels (P < 0·001) and HOMA-IR index values (P < 0·001) decreased significantly, and the adiponectin levels (P < 0·001) increased compared with baseline in the LD group. The UD group exhibited no differences (Fig. 1). The HOMA-IR index value was significantly different at 12 weeks between the LD and UD groups (P < 0·001) and changed from baseline (P = 0·016). The change in the level of adiponectin was significantly different at 12 weeks (P < 0·001) and differed from baseline (P < 0·001). The level of TAG only tended to differ between the two groups at the end of the 12-week follow-up (Fig. 1).

Fig. 1. Effects of legume consumption on the levels of TAG and adiponectin and the HOMA-IR index value. Mean ± SEM. §Tested using log transformation. *P < 0·001 compared with baseline values in each group as tested using paired t test. P-values derived from independent t test. P′ = after adjusting for baseline value. ‡
P < 0·001 comparison between two groups at the 12-week follow-up and †
P < 0·05, ††
P < 0·001 comparison between two groups at changed values tested using independent t test. HOMA-IR, homoeostasis model assessment-insulin resistance. ![]() , baseline;
, baseline; ![]() , 12-week.
, 12-week.
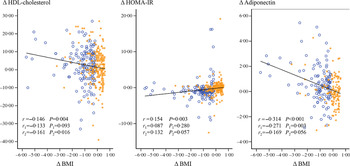
Correlations between changes in BMI, HDL-cholesterol, homoeostasis model assessment-insulin resistance index and adiponectin
Changes (Δ) in BMI and the HDL-cholesterol level (r = –0·146, P = 0·004) and BMI and the adiponectin level negatively correlated (r = –0·314, P < 0·001) in a linear manner in all subjects (Fig. 2). ΔBMI and ΔHOMA-IR index values showed a positive correlation (r = 0·154, P = 0·003). A negative correlation between ΔBMI and Δadiponectin (r = –0·271, P = 0·003) was observed only in the LD group. ΔBMI and ΔHDL-cholesterol negatively correlated in the UD group (r = 0·161, P = 0·016), and ΔBMI tended to be positively associated with the ΔHOMA-IR index value and negatively correlated with Δadiponectin (Fig. 2).

Fig. 2. Correlations between changes (difference from baseline) in BMI, the HOMA-IR index value, and the levels of HDL-cholesterol and adiponectin in 383 subjects. r = Pearson’s correlation coefficients in all subjects. r
1 = correlation coefficients in the LD group. r
2 = correlation coefficients in the UD group. HOMA-IR, homoeostasis model assessment-insulin resistance. ![]() , legume-enriched diet;
, legume-enriched diet; ![]() , usual diet.
, usual diet.
The relationships between adiponectin, high-sensitivity C-reactive protein, 8-epi-PGF2α, anthropometric biomarkers and biochemical markers before and after the 12-week intervention
The adiponectin level negatively correlated with weight (r = –0·150, P = 0·009), the levels of TAG (r = –0·202, P < 0·001), glucose (r = –0·140, P = 0·015) and insulin (r = –0·115, P = 0·048), the HOMA-IR index value (r = –0·150, P = 0·010) and the hs-CRP level (r = –0·129, P = 0·026) in all subjects at baseline and positively correlated with the levels of HDL-cholesterol (r = 0·162, P < 0·001) and LDL-cholesterol (r = 0·162, P = 0·005). The level of adiponectin negatively correlated with the levels of TAG (r = –0·349, P < 0·001), HDL-cholesterol (r = 0·189, P = 0·042) and insulin (r = –0·236, P = 0·012), and the HOMA-IR index value (r = –0·215, P = 0·022) in the LD group at 12 weeks. However, the adiponectin level negatively correlated with the levels of TAG and glucose (r = –0·193, P = 0·029; r = 0·204, P = 0·021, respectively) and positively correlated with the level of HDL-cholesterol (r = 0·352, P < 0·001) in the UD group at 12 weeks. The insulin level (r = 0·191, P = 0·019), HOMA-IR index value (r = 0·199, P = 0·015) and 8-epi-PGF2α level (r = 0·431, P < 0·001) positively correlated with the TAG level in the LD group at 12 weeks. These trends were similar in the two groups at 12 weeks. The 8-epi-PGF2α level positively correlated with the levels of glucose and insulin and the HOMA-IR index value (r = 0·264, P = 0·002; r = 0·219, P = 0·010; r = 0·264, P = 0·002, respectively) in the LD group at 12 weeks, and these relationships were also observed in the UD group. Unexpectedly, there were no significant correlations between the adiponectin, hs-CRP and 8-epi-PGF2α levels in either group, except for a negative correlation between the levels of Δhs-CRP and Δ8-epi-PGF2α (r = –0·172, P = 0·032) in the UD group (online Supplementary Fig. S1).
Correlations between changes in major indicators in the legume-enriched diet group by sex
The results of the between-group and within-group comparisons in the LD group by sex (males and females in the LD group) revealed a similar trend as all subjects (data not shown). However, notable differences between the two groups were found in the correlation analysis between the changes in the values of the major indicators. Among the changed values in females in the LD group, ΔBMI positively correlated with Δweight (r = 0·996, P < 0·001), ΔWHR (r = 0·399, P < 0·001), and ΔHDL (r = 0·217, P = 0·038) and negatively correlated with Δglucose (r = –0·215, P = 0·004), Δadiponectin (r = –0·298, P = 0·01) and Δ8-epi-PGF2α (r = –0·229, P = 0·039). However, ΔBMI in males in the LD group only showed correlations with ΔWHR (r = 0·544, P < 0·001) and Δsystolic blood pressure (r = –0·257, P = 0·036). ΔAdiponectin negatively correlated with ΔWT, ΔTAG and ΔLDL (r = –0·289, P = 0·013; r = –0·324, P = 0·005; r = –0·391, P = 0·001, respectively) in females in the LD group (Fig. 3).

Fig. 3. Correlations between changes (difference from baseline) in major indicators in the legume-enriched diet group by sex. (a) Male with legume-enriched diet. (b) Female with legume-enriched diet. r = Pearson’s correlation coefficients. Red represents a positive correlation, and blue represents a negative correlation.
Discussion
The present study demonstrated that a 12-week LD may improve clinical variables in obese subjects. After 12 weeks, the LD group had significant reductions in body weight and BMI. Conversely, significant differences were not observed in the UD group who consumed the UD with increased vegetables. Our results partially confirm some clinical studies(Reference Darmadi-Blackberry, Wahlqvist and Kouris-Blazos27). Papanikolaou and Fulgoni(Reference Papanikolaou and Fulgoni28) reported a relationship between bean consumption and obesity risk in approximately 8000 adult participants in the National Health and Nutrition Examination Survey (NHANES) 1999–2002 using 24-h dietary recall data. They found that people who consumed various beans or baked beans showed significantly lower body weight than people who had not consumed beans. The odds of being obese (BMI > 30 kg/m2) were also significantly lower in people who consumed a variety of beans and baked beans (OR = 0·78 and 0·77, respectively). However, Venn et al. showed a slightly different result. The incorporation of pulses and whole-grain foods into a weight loss programme resulted in an essential reduction in waist circumference compared with the control diet, but weight loss was not different between groups(Reference Venn, Perry and Green29).
After a 12-week intervention, energy intake (kcal), % carbohydrate intake and % fat intake were significantly different between the two groups in the present study. According to the Korea Health Statistics 2011: Korea National Health and Nutrition Examination Survey (KNHANES V-2), city populations consume approximately 19·6 % of total energy content from fat. Based on these data, our results showed significant differences between the LD and UD groups after the intervention (22·0 (sem 0·29) v. 19·7 (sem ± 0·21)). Because we instructed the LD group to replace one-third of a rice bowl with legumes, a dramatic decrease in the % carbohydrate was present. Replacing one-third of a bowl of rice per meal per day results in a 418.4 kJ (100 kcal) deficit because a bowl of rice has 1255.2 kJ (300 kcal) according to the food composition tables from the Rural Development Administration (8th Ed., 2011) of Korea(Reference Kang, Yoo and Kim30). Therefore, the increase in % fat observed in the LD group was due to the changes in the total energy intake (kcal), % carbohydrate and % protein, and it does not mean an absolute increase in fat intake by the LD group.
Notably, we demonstrated that a decrease in BMI correlated with an increase in the adiponectin level in obese subjects. Our results showed that plasma adiponectin levels negatively correlated with body weight, the HOMA-IR index value and the level of hs-CRP and positively correlated with the level of HDL-cholesterol, which are consistent with previous studies(Reference Menzaghi, Ercolino and Di Paola31,Reference Huang, Lue and Yen32) . Several studies reported that weight loss in massively obese subjects was associated with increases in serum adiponectin concentration (Reference Yang, Lee and Funahashi33,Reference Ng, Watts and Barrett34) . Yannakoulia et al. noted that whole-grain intake was associated with high adiponectin levels. In a cross-sectional study of 220 healthy Mediterranean women, adherence to a dietary pattern characterised by a high consumption of legumes, whole-grain cereals and low-fat dairy products was positively associated with adiponectin levels after controlling for potential confounders(Reference Yannakoulia, Yiannakouris and Melistas35). The LD group in our study also exhibited a significant decrease in the HOMA-IR index value and significant increase in adiponectin levels after the 12-week intervention. These data suggest that a more substantial amount of weight loss with legume consumption increased plasma adiponectin, which may control insulin and glucose metabolism.
Our sex-stratification analysis revealed that Δadiponectin increased significantly in females in the LD group compared with females in the UD group. However, no significant difference was found between males from the LD and UD groups. ΔBMI was substantially larger in females than males in the LD group. ΔBMI showed a negative correlation with Δadiponectin only in females in the LD group. Because sex hormones play a critical role in adipose tissue activity(Reference Selthofer-Relatić, Radić and Stupin36), adiponectin generally exists at a lower level in males than females. This phenomenon is also closely related to fat, especially visceral fat(Reference Gariballa, Alkaabi and Yasin37,Reference Bidulescu, Liu and Hickson38) . Bidulescu et al. (Reference Bidulescu, Liu and Hickson38) demonstrated an inverse relationship between abdominal visceral adipose tissue and serum adiponectin levels in African American females, but this association was not observed in males. Collectively, our results suggest that an LD helps reduce visceral and subcutaneous fat, especially in females. However, further research is needed to clarify the type of fat affected by legume consumption.
The significant decrease in 8-epi-PGF2α levels in the LD group may result from a meaningful legume effect in mitigating oxidative stress(Reference Landi, Pacifico and Piccolella39). Accumulated fat induces the production of reactive oxygen species and lipid peroxidation byproducts. Therefore, the considerable weight loss of the LD group may underlie the significant change in the 8-epi-PGF2α level. The 8-epi-PGF2α level positively correlated with the levels of glucose and insulin and the HOMA-IR index value in the LD group at 12 weeks. Reactive oxygen species are closely related to a proinflammatory state with increasing inflammatory cytokine secretion and macrophage infiltration. Therefore, our findings suggest that legume consumption, in addition to weight loss, may help prevent chronic disease by controlling inflammatory conditions.
Several limitations of this work need to be explained. The first is that participants’ dietary intake information was collected from self-reports. However, measurement errors from self-reported nutritional intake and lifestyle variables are relatively small(Reference Rimm, Giovannucci and Stampfer40). Second, the control group established in our study was not sufficient. Further intervention studies with a control group in which one-third of refined rice intake is replaced with foods other than legumes are essential to clarify the effect of the LD. Alternatively, intervention studies are needed to compare groups consuming legumes with groups without legume supplementation. Third, it is difficult to clarify the causal relationships of the observed changes in adiponectin, 8-epi-PGF2α and weight loss. The improvements in adiponectin and 8-epi-PGF2α might be directly affected by weight loss and might not be caused by legume consumption. However, several studies that shown that legumes could cause favourable metabolic changes, irrespective of weight loss (Reference Mirmiran, Hosseini and Hosseinpour-Niazi41,Reference Neuhouser, Schwarz and Wang42) , have indicated that legumes itself improve adiponectin and 8-epi-PGF2α, similar to our findings. These major metabolic changes that appear to result from legume intake have been shown to be associated with weight loss. However, the dose-dependent effects of legume consumption were not considered in the present study, so it is difficult to conclude that the observed metabolic changes were directly caused by legume consumption. Thus, we suggest the possibility that the weight loss induced by LD confers health benefits such as regulating the levels of adiponectin and 8-epi-PGF2α. Notably, the consumption of legumes induced significant changes in adiponectin levels in females. Unexpectedly, legume antioxidant-mediated adiponectin regulation, which may help with weight reduction, could not fully be elucidated in the present study because a direct correlation was not observed between the levels of adiponectin and 8-epi-PGF2α. We also suggest that the increases in plasma adiponectin induced by more considerable weight loss with LD supplementation may be related to a greater activation of IR. Further studies are needed to confirm the exact mechanism of legume weight reduction based on this evidence.
Declarations
Ethics approval and consent to participate: The Institutional Review Board of Yonsei University approved the study protocol, which was performed in compliance with the Helsinki Declaration.
Consent for publication: Paper-based informed consent forms, stored in a document system after obtaining the necessary signatures, were used to record the intent and willingness to participate in the research.
Availability of data and materials: The datasets generated and/or analysed during the present study are available from the corresponding author on reasonable request.
Acknowledgements
The authors thank the research volunteers who participated in the studies described in this article.
This research was supported by the Basic Science Research Program through the National Research Foundation of Korea funded by the Ministry of Science and ICT (2012M3A9C4048762 and NRF-2017R1C1B2007195) and Ministry of Education (NRF-2019R1I1A2A01061731).
Y. H., A. R. K., J. H. L. and M. K. analysed the data. J. H. L. and M. K. developed the study protocol and design. M. K. wrote the original draft. Y. H. and M. K. edited the manuscript. All of the authors read, commented on and contributed to the manuscript. J. H. L. and M. K. provided research funding and developed the study protocol. M. K. is the guarantor of this work, has full access to all data in the study and takes responsibility for the integrity of the data and the accuracy of the data analysis.
The authors declare that they have no competing interests.
Supplementary material
For supplementary material referred to in this article, please visit https://doi.org/10.1017/S0007114521000970


 Open access