


How do politicians learn about public preferences? Office-seeking officials have incentives to be informed (Downs Reference Downs1957; Geer Reference Geer1996; Pereira Reference Pereira2020). However, a growing literature suggests that learning about what voters want is more demanding than originally suggested (Butler and Nickerson Reference Butler and Nickerson2011; Druckman and Jacobs Reference Druckman and Jacobs2015). Representatives often have a distorted image of their constituents (Broockman and Skovron Reference Broockman and Skovron2018; Converse and Pierce Reference Converse and Pierce1986; Erikson, Luttbeg, and Holloway Reference Erikson, Luttbeg and Holloway1975; Holmberg Reference Holmberg1989; Kertzer et al. Reference Kertzer, Busby, Monten, Tama and Kafura2020; Miller and Stokes Reference Miller and Stokes1963). Therefore, a key ingredient for policy responsiveness is frequently missing. This leads to two crucial questions that I explore in this article: (1) why do politicians misperceive public preferences and (2) how can misperceptions be mitigated?
I explore two factors that may lead political elites to misperceive constituency preferences: inequalities in exposure and personal biases of legislators. First, representatives do not interact with all subconstituencies in the same way. More affluent and organized groups are more likely to make their voices heard in the policy-making process (e.g., Gallego Reference Gallego2007; Schlozman, Verba, and Brady Reference Schlozman, Verba and Brady2012).Footnote 1 This differential exposure to more-privileged subconstituencies can lead officials to rely disproportionately on these voices when forming opinions about public preferences. In short, inequalities in political resources across voters can generate distorted images of the constituency. Furthermore, legislators’ own personal background can also influence exposure. Policy makers are drawn disproportionately from more affluent segments of the electorate (Carnes and Lupu Reference Carnes and Lupu2015), and the social networks of public officials can shape their image of the constituency (Campbell Reference Campbell2013). Taken together, these arguments suggest that misperceptions can result from the type of information that is more accessible to politicians.
However, unequal exposure only tells part of the story. Personal biases of elected officials may also distort perceptions of public opinion. Representatives may be inclined to engage in social projection: projecting their own policy preferences on voters (Krueger and Clement Reference Krueger and Clement1994). This cognitive bias may lead representatives to overestimate support for policies they themselves endorse. Social projection may result from a systematic tendency of public officials to deem opposing views as uninformed or nonsalient (Butler and Dynes Reference Butler and Dynes2016). Hence, even without inequalities in political voice, politicians may generate images of the constituency that are tinted by their own views.
I test these expectations with surveys of elected officials in Sweden and Switzerland. Study 1 explores a six-wave panel of Swedish MPs covering two decades of elite beliefs about voters. This dataset was combined with mass surveys fielded concurrently to create measures of perceptual accuracy for 24 policy issues. The analyses reveal that elite beliefs disproportionately reflect the preferences of high-status voters. On average, the probability of an MP correctly perceiving the majority opinion on a given policy issue decreases 12 points when white-collar voters disagree with the median voter in a given party. Consistent with the mechanisms proposed, these effects are moderated by the types of groups MPs interact with—unions or business organizations—and by the personal background of legislators. The analyses also show evidence of social projection: elected officials systematically overestimate support for policies they personally endorse.
Study 2 was designed to explore whether the biases uncovered in the first study can be mitigated. In an original experiment that leveraged real political events, 2,917 Swiss local elected officials were asked to estimate support for two upcoming referendums in their constituencies. Together with the disaggregated results from the popular votes, these data allowed me to produce precise measures of perceptual accuracy at the local level. Officials were randomly assigned to informational cues designed to overcome inequalities in exposure and social projection. The probability of representatives correctly predicting majority preferences in their constituency increased 4 to 9 percentage points when encouraged to avoid availability heuristics and consider the electorate more broadly. Encouraging officials to avoid social projection, in turn, reduced the tendency to overstimate support for policies endorsed, as expected, but this effect did not improve the ability of representatives to identity the majority opinion.
The patterns uncovered here are consistent with recent scholarship in the United States showing that political elites systematically perceive their own constituents as more conservative than they actually are (Broockman and Skovron Reference Broockman and Skovron2018; Hertel-Fernandez, Mildenberger, and Stokes Reference Hertel-Fernandez, Mildenberger and Stokes2019). This conservative bias in elite beliefs can be partially explained by inequalities in political voice, as more affluent voters in the United States tend to be more conservative (Mendelberg, McCabe, and Thal Reference Mendelberg, McCabe and Thal2017; Suhay, Klašnja, and Rivero Reference Suhay, Klašnja and Rivero2021).
The study sheds light on the constraints faced by elected officials to act on behalf of those who elected them (Butler and Nickerson Reference Butler and Nickerson2011; Pitkin Reference Pitkin1967). The findings contribute to scholarship on political representation and elite behavior. Prior work established that affluent voters have an easier time converting preferences into policy in Sweden (Persson and Branham Reference Persson and Branham2020), Switzerland (Lloren, Rosset, and Wüest Reference Lloren, Rosset and Wüest2015), and elsewhere (Adams and Ezrow Reference Adams and Ezrow2009; Bartels Reference Bartels2008; Giger, Rosset, and Bernauer Reference Giger, Rosset and Bernauer2012; Homola Reference Homola2019; Gilens Reference Gilens2009; Schakel Reference Schakel2019). The patterns uncovered here suggest that unequal exposure to voters can partially explain these dynamics, by producing distorted beliefs about public preferences. Thus, policy outputs can reproduce existing inequalities even when legislators are not trying to favor any particular subconstituency.
The Nature of Elite Perceptions of Public Opinion
Aggregating preferences is intrinsically complex. Time-constrained politicians are exposed to a vast array of cues available through different channels: direct contacts from constituents, lobbyists, the media, social networks, political parties, or peers. To condense these overlapping demands is a daunting task, and the information available to legislators is often incomplete (Butler and Nickerson Reference Butler and Nickerson2011; Gulzar, Haai, and Paudel Reference Gulzar, Haai and Paudel2020; Pereira Reference Pereira2019). This context offers fertile ground for the adoption of cognitive shortcuts. Individuals rarely conduct extensive information searches before making judgments, particularly for complex decisions (Tversky and Kahneman Reference Tversky and Kahneman1974). Instead, they rely on a subset of available information. More accessible information is more easily retrieved from memory and therefore tends to play a dominant role in individual judgments (Ajzen Reference Ajzen, Higgins and Kruglanski1996; Carlston and Smith Reference Carlston, Smith, Higgins and Kruglanski1996). However, heuristics have limits. The subset of information on which individuals rely may not be representative of all the information available (Fiedler and Schmid Reference Fiedler, Schmid, Manstead and Hewston1995; Lodge, Stroh, and Wahlke Reference Lodge, Stroh and Wahlke1990).
I argue that (1) inequalities in exposure to voters and (2) the policy preferences of legislators shape the type of information that becomes available to public officials. When this subset of information is biased, it may translate into misperceptions. Information availability, in this context, refers to the “ease with which instances and occurences could be brought to mind” (Tversky and Kahneman Reference Tversky and Kahneman1974, 15). The two arguments articulated below are expected to play a central but not exclusive role in explaining misperceptions. Complementary explanations are discussed in the concluding section.
Before moving forward, I should clarify the concept of constituency adopted in the study. Constituency is defined as the group of subjects who grants authority and holds accountable an elected official or party (Rehfeld Reference Rehfeld2005). From the legislators’ perspective, it refers to any representation of the public that acts as principal in the delegation chain. Therefore, a constituency can take different shapes depending on the institutional context in which legislators operate. Common conceptualizations include geographical constituencies, party constituencies, or the electorate as a whole (Däubler Reference Däubler2020; Esaiasson and Holmberg Reference Esaiasson and Holmberg1996; Katz Reference Katz, Rohrschneider and Thomassen2020).Footnote 2 Some explanations for why legislators misperceive constituency preferences may vary according to the way a constituency is defined. However, as articulated below, I expect both sources of misperceptions proposed here to apply to different representations of the public.
Exposure and Beliefs
Elected officials do not interact with all segments of their constituency in the same way. Systemic inequalities in political resources between subgroups, as well as legislators’ own personal networks, shape the type of information that is more readily available.
A cross-cutting pattern in contemporary democracies is that more affluent (Gallego Reference Gallego2007; Schlozman, Verba, and Brady Reference Schlozman, Verba and Brady2012; Verba, Schlozman, and Brady Reference Verba, Schlozman and Brady1995), organized (Klüver Reference Klüver2020; Olson Reference Olson1965; Schattschneider Reference Schattschneider1975), politically engaged (Galston Reference Galston2001; Griffin and Newman Reference Griffin and Newman2005), and well-connected (Campbell Reference Campbell2013) segments of society are more likely to make their voices heard in the policy-making process. Hence, the preferences of privileged subconstituencies are often more salient in the public discourse. If officials rely on availability heuristics to gauge public preferences—as posited above—the positions of high-status voters may be given disproportionate consideration. There is some evidence for this argument in the American context. When Congressional staffers think about subconstituencies relevant for a given policy initiative, they are more likely to recall groups that often contact and contribute to the legislator (Miler Reference Miler2007).
Interest groups also shape whose opinions become more readily available to legislators (Klüver Reference Klüver2020). There is ample evidence of representational biases in the pressure system (e.g., Binderkrantz, Christiansen, and Pedersen Reference Binderkrantz, Christiansen and Pedersen2015; Crosson, Furnas, and Lorenz Reference Crosson, Furnas and Lorenz2020). Even in organizations that represent marginalized subconstituencies, the preferences of their most advantaged members tend to prevail. Groups representing low-income people or racial minorities are substantially less active on issues affecting disadvantaged members (Strolovitch Reference Strolovitch2008). Therefore, I expect interest groups to reproduce and amplify existing inequalities in political voice.
Information gathered through legislators’ personal experience is also more accessible. Familiar information is easier to recall (Tversky and Kahneman Reference Tversky and Kahneman1974). Reviewing his experience in office, a former mayor from a suburb of Washington, DC illustrates this challenge: “both [factions in the legislature] may have wrongly estimated the location of the median voter—it is easy to do when one regularly receives vocal communications from your neighbors […] on the street and in your inbox” (Lublin Reference Lublin2018, 171). More broadly, researchers have noticed for decades that our social networks tint our image of the world: our political attitudes and behavior (Campbell Reference Campbell2013). At the same time, in most countries policy makers are drawn disproportionately from more privileged segments of society (e.g., Carnes and Lupu Reference Carnes and Lupu2015). If representatives use availability heuristics to gauge constituency preferences, as proposed here, they may rely disproportionately on the positions of these same privileged subconstituencies.
Together, both mechanisms suggest that the preferences of high-status voters are more visible to legislators. When the policy positions of privileged subconstituencies are aligned with the majority, inequalities in exposure are not expected to distort perceptions of public opinion. However, when in disagreement, unequal exposure combined with availability heuristics can lead to misperceptions. Importantly, this process may take place unconsciously. It does not require any active discrimination from legislators (Butler Reference Butler2014). The following implication derives from these arguments:
Exposure Hypothesis: Elected officials are more likely to misperceive public opinion when high-status voters disagree with the majority.
Personal Preferences and Beliefs
Differential exposure is not the only source of misperceptions. Even when public opinion information is not skewed, personal biases may distort how elected officials process and incorporate constituency signals.
Gauging constituency preferences is a social inference task. A potential bias associated with this cognitive process is known as social projection (or false consensus bias): the propensity to overestimate the degree to which others share our attitudes and beliefs (Ross, Greene, and House Reference Ross and Greene1977). Social projection is one of the most robust and well-documented social judgment biases (Mullen et al. Reference Mullen, Atkins, Champion, Edwards, Hardy, Story and Vanderklok1985). Nearly a century ago, Katz and Allport (Reference Katz and Allport1931) found that students who cheated in tests systematically overestimated the share of peers who had also cheated. The tendency to project our attitudes on others is moderated by perceptions of similarity (Davis Reference Davis2017) and is understood as an irrational and unavoidable behavior rather than a result of statistical (i.e., Bayesian) reasoning (Krueger and Clement Reference Krueger and Clement1994). However, recent scholarship suggests that social projection can be mitigated through incentives (Epley et al. Reference Epley, Keysar, Van Boven and Gilovich2004) or personalized feedback (Morewedge et al. Reference Morewedge, Yoon, Scopelliti, Symborski, Korris and Kassam2015).
Among political elites, there is a large amount of anecdotal evidence suggesting that representatives engage in this type of bias. In recent years, David Cameron’s decision to call a referendum on the United Kingdom’s membership in the European Union is one of the most consequential episodes resulting, in part, from false consensus bias. The British prime minister campaigned against Brexit. However, as analysts described at the time, “David Cameron underestimated the strength of Eurosceptic feeling and probably also the discredit of which his government [was] the focus” (The Robert Schuman Foundation 2016, 6). Early scholarship on elite beliefs provides suggestive evidence in line with this view (Converse and Pierce Reference Converse and Pierce1986; Holmberg Reference Holmberg1974; see also Hertel-Fernandez, Mildenberger, and Stokes Reference Hertel-Fernandez, Mildenberger and Stokes2019). Based on a survey of members of the European Parliament, Holmberg (Reference Holmberg, Schmitt and Thomassen1999) concluded that “[t]he unpleasant truth is that a largely irrational tendency toward wishful thinking is more significant for members’ knowledge of voter opinion than other more rational processes of knowledge acquisition” (249). These behavioral patterns may be due to a tendency of public officials to discount opinions they disagree with (Butler and Dynes Reference Butler and Dynes2016). Contrasting views are systematically seen as less informed and less likely to represent the majority opinion. Hence, social projection can translate into misperceptions by altering the type of information that is most visible (or available) to legislators. These arguments suggest the following prediction:
Social Projection Hypothesis: Elected officials are more likely to misperceive public opinion when disagreeing with the majority position on a given policy issue.
As the term “projection” implies, the argument suggests that legislators’ attitudes inform their beliefs about constituency preferences. There is robust causal evidence of this cognitive bias in different contexts: individuals randomly assigned to a state (an experience, opinion, or behavior), overestimate the prevalence of that state (e.g., Agostinelli et al. Reference Agostinelli, Sherman, Presson and Chain1992; Krueger and Clement Reference Krueger and Clement1994; van Boven, Dunning, and Loewenstein Reference van Boven, Dunning and Loewenstein2000). At the same time, perceptions about others can also shape preferences, particularly when individuals hold weak or ambiguous attitudes. In the context of politicians’ beliefs about voters, I expect this alternative causal pathway to play a limited role. First, self-referent information (e.g., our personal preferences) is more accessible than estimates about the attitudes and behavior of others (Clement and Krueger Reference Clement and Krueger2000). Second, by the nature of their job, policy makers are more likely to hold policy preferences rooted in information and less susceptible to change. (Christensen and Moynihan Reference Christensen and Moynihan2020). Finally, politicians often see themselves as opinion leaders and engage in efforts to shape public opinion rather than accommodating it (Gabel and Scheve Reference Gabel and Scheve2007; Page and Shapiro Reference Page and Shapiro1984).
The Relationship between Exposure and Social Projection
Exposure and issue preferences are not independent from each other. Exposure can either influence or be influenced by the personal positions of legislators. Additionally, descriptive representation—to the extent that it shapes both the type of constituents with which legislators interact and the policies they most care about—can influence both arguments. That said, the arguments advanced above should have independent (unmediated) effects on perceptions of public opinion. The empirical strategy adopted in this study was designed to isolate these different dynamics.
To illustrate these differences, it is useful to consider how political inequality relates to each theoretical argument. According to the exposure hypothesis, inequalities in political resources produce distorted beliefs independent of the personal preferences of the legislator. On the other hand, according to the projection hypothesis, elite beliefs only reflect political inequalities if the preferences of legislators are aligned with the position of more-privileged subconstituencies (and not aligned with the majority opinion). Therefore, although exposure and projection may affect each other, I expect both arguments to have independent effects on the ability of legislators to gauge constituency preferences.
Empirical Strategy
I test the main predictions derived from the theory in two complementary studies. Both studies conceptualize perceptual accuracy as the ability of political elites to correctly identify the majority position on a given issue (Pitkin Reference Pitkin1967). Study 1 is based on a long-running panel of Swedish MPs matched with two mass surveys fielded concurrently for over two decades. To my knowledge, these data sources represent the most comprehensive effort to measure elite perceptions of public opinion. The analyses in Study 1 are designed to investigate the two main predictions derived from the theory and the mechanism underlying the exposure hypothesis.
Study 2 complements the first study through an original survey with Swiss local elected officials. I designed this study to explore whether inequalities in exposure and social projection can be experimentally manipulated. Days before two federal referendums, politicians were asked to estimate the share of voters in their municipality supporting each initiative on the ballot. Prior to this task, politicians were randomly assigned to informational nudges designed to induce perceptual accuracy by avoiding unequal exposure and social projection. This empirical strategy allows me to assess the extent to which biases in elite perceptions of public opinion can be mitigated.
Relying on two of the wealthiest countries in the world restricts the scope of the findings. Relative to the average elected official in Europe, Swedish and Swiss legislators may have more resources to gauge public preferences. However, both countries are also among the most socially inclusive societies in the world, making them hard cases to uncover the political consequences of inequalities in political voice.Footnote 3 The gaps in preferences between privileged subconstituencies and the majority tend to be starker in contexts with more income inequality (Rueda and Stegmueller Reference Rueda and Stegmueller2016; Voorheis, McCarty, and Shor Reference Voorheis, McCarty and Shor2015). Additionally, to the extent that descriptive representation can mitigate inequalities in exposure, Sweden stands out as one of the countries where MPs (relatively) better reflect the social diversity of their constituency. Scandinavian parliaments are among the most broadly based legislatures (Esaiasson and Holmberg Reference Esaiasson and Holmberg1996; Norris and Levendusky Reference Norris and Lovenduski1995; but see Dal Bó et al. Reference Bó, Ernesto, Folke, Persson and Rickne2019). Two features of the Swiss system may also mitigate informational asymmetries. First, the frequency of referendums and other direct democracy instruments provides regular data on voter preferences to policy makers. Second, local Swiss legislators in Study 2 are largely part-time politicians who maintain an active role in civil society, potentially facilitating exposure to different subconstituencies. For these reasons, Sweden and Switzerland represent less likely cases by which to identify the effects of informational asymmetries.Footnote 4
Sweden and Switzerland have relatively influential political parties, and the decisions of individual legislators in both countries may be constrained by intraparty dynamics (Giger and Klüver Reference Giger and Klüver2016; Öhberg and Naurin Reference Öhberg and Naurin2016).Footnote 5 However, distorted beliefs about the electorate are consequential regardless of how party-centric a system is. Political parties are groups of individuals. If these individuals express similar types of biases when gauging public opinion, these biases should carry on to the collective decisions of parties. Appendices A and D provide more contextual information about Sweden and Switzerland, respectively.
Study 1: Panel of Swedish LEGISLATORS
To measure elite perceptions of public opinion, I first rely on a constellation of survey data from Sweden. Since 1985, the Swedish Parliamentary Survey (RDU) has surveyed MPs once every term. For each wave of the RDU, response rates have been consistently above 90%.Footnote 6 The panel asks elected officials their own opinions on a large set of policy issues, along with perceptions of constituency preferences on those same issues. For six waves of the parliamentary survey—1985, 1988, 1994, 1998, 2002, and 2006—the Swedish National Election Studies (SNES) and the SOM Institute Surveys (SOM) asked identical policy questions to representative samples of voters in the same period.
In order to compare elite perceptions with voters’ expressed policy preferences, I combined all three datasets. Whenever the SNES and SOM conducted mass surveys concurrently, I merged the two samples. On average, the combined dataset includes 4,865 respondents per wave.Footnote 7 With these data, I calculated different measures of policy support, as detailed below. Overall, 24 distinct policy issues were asked simultaneously in the MP and mass surveys. Additionally, on average each of the policy items was asked in three of the six matched waves. Table B1 lists all policy issues, waves, and sources used in the analysis. Since the key goal of Study 1 is to explain individual variation in the ability of legislators to gauge public preferences, the unit of analysis is MP-year-policy. The combined dataset includes 22,373 individual perceptions of voter preferences.
Measuring Perceptual Accuracy
The main outcome of interest in Study 1 is a measure of perceptual accuracy. Respondents in the mass surveys were given a five-point Likert scale to answer each policy support question. In turn, MPs were asked whether a majority of their “own party’s voters” supported a given policy. In the Swedish context, the party base is considered the most relevant constituency for representatives (Esaiasson and Holmberg Reference Esaiasson and Holmberg1996).Footnote 8 To combine the two measures, I dichotomized public support.Footnote 9 Perceptual Accuracy takes the value of 1 if an individual MP correctly identifies the majority opinion among party voters, and 0 otherwise.Footnote 10
The average value of Perceptual Accuracy is 0.73. From 1985 to 2006, Swedish MPs correctly perceived the majority opinion in their party constituency 73% of the time. To provide a more detailed description of the variable, Figure 1 plots average values of perceptual accuracy by issue (gray lines) and for all issues asked in a given year (green line). Two patterns are worth noting. First, although perceptual accuracy is generally high, there is considerable variation across issues and over time. While 92% of MPs correctly perceived the majority opinion on the expansion of privately run health care in 2006, over 60% of representatives misperceived voters’ opinion on whether to decrease defense spending in the same year. Second, there is a gradual decline in perceptual accuracy over the two decades covered. Because this pattern may be simply due to the type of issues asked in each wave, Figure 1 also plots averages for the five issues that were asked consistently from 1985 to 2006 (orange line). The same general pattern is observed for this constant set of issues. Average perceptual accuracy among common issues went from 78.2% in 1985 to 65.4% in 2006. It is beyond the scope of this project to explain this pattern. Still, it suggests that the ability of elected officials to gauge constituency preferences is dynamic.
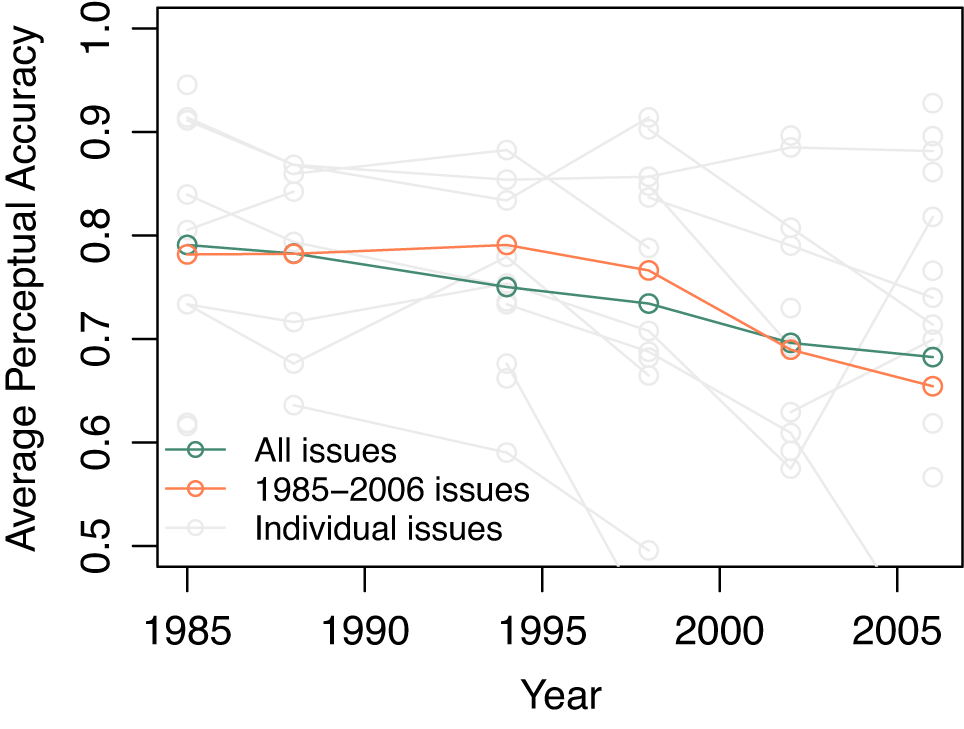
Figure 1. Average Perceptual Accuracy by Wave of Parliamentary Survey
Note: “All issues” includes data from all 24 policy issues asked in the different waves; “1985–2006 issues” includes issues asked in at least five of the six waves, including 1985 and 2006: reduce public sector, reduce defense spending, more private health care, prohibit all kinds of pornography, and the introduction of six-hour working days.
The MP survey asked legislators about the preferences of their party constituency: voters who supported their party in the most recent election (2–4 months earlier). In performing this task, it is possible that politicians thought about different party supporters such as party members (Dalton Reference Dalton1985; Scarrow and Gezgor Reference Scarrow and Gezgor2010; but see van Biezen and Poguntke Reference van Biezen and Poguntke2014). While this could be consistent with the exposure hypothesis, it is important to note that in Sweden “party members resemble party voters to a high degree. […] Nordic parties have maintained a high level of representativeness when looking at the social composition of their membership” (Heidar et al. Reference Heidar, Kristinnsson, Saarinen, Koivula, Keipi, Demker, Heidar and Kosiara-Pedersen2019, 93). Polk and Kölln (Reference Polk, Kölln, Demker, Heidar and Kosiara-Pedersen2019), in turn, report high levels of within-party congruence among party members, party voters, and party candidates in Sweden. This is likely due to the high levels of turnout in Swedish elections, between 80% and 90% in the period covered. In this context, thinking about different types of party constituencies—sympathizers, voters, or members—is unlikely to bias the results in a relevant way.
Research Design
If exposure shapes perceptions of constituency preferences, as articulated above, elected officials should give disproportionate weight to the preferences of high-status voters. High-status voters are segments of the constituency with more political resources. These resources affect the ability of voters to make their voices heard in the policy-making process (e.g., Schlozman, Verba, and Brady Reference Schlozman, Verba and Brady2012) and can be materialized in different ways: actual financial resources, organizational capacity, or accessibility to legislators (from common social networks or geographical proximity). To capture the multidimensional nature of high-status voters, I use four complementary variables: occupational social class, education, income, and place of residency. Social class is simultaneously a strong indicator of political resources and a meaningful political cleavage for both voters and politicians (Carnes and Lupu Reference Carnes and Lupu2015; Evans Reference Evans2000). Income and education, on the other hand, capture more directly individual resources and political influence. Finally, place of residence captures connectedness and access to the political sphere more broadly (Busch and Reinhardt Reference Busch and Reinhardt2005; Tavits Reference Tavits2005). Descriptive statistics for all variables included in the analysis are described in Appendix B.
To produce measures of policy support for different subconstituencies, I recoded each variable as follows. Occupational social class was split into three categories: blue-collar (40.6%), white-collar (42.3%), or other. Educational attainment was classified as low (1–9 grades or less; 31.4%), medium (above comprehensive school but no college; 39.6%), or high (college degree; 30.0%). The measure of income is based on a distributional scale of household income validated by the Swedish register. From the original variable, I created three categories: low income (15th income percentile or lower), high income (85th percentile or higher), and medium income for the remaining subjects. Finally, place of residence is divided in two categories: respondents from rural areas and villages (42.4%) and respondents from cities (57.6%).Footnote 11
Based on these typologies, I recalculated policy support exclusively among high-status partisans: (1) white-collar, (2) high education, (3) high income, or (4) urban party voters. Finally, for each policy item I created a binary variable capturing opinion disagreement between high-status party constituents and the majority of copartisans.Footnote 12 This process leads to four complementary predictors: one per measure of high status. As an example, consider the case where high status is captured through social class. The variable takes the value of 1 for a given MP from party X if white-collar copartisans disagree with the majority of party X voters on a given policy issue, and 0 otherwise. According to the exposure hypothesis, legislators are more likely to misperceive public preferences when the position of privileged subconstituencies deviates from the majority.
To capture the propensity for social projection, in turn, I contrast the self-reported preferences of MPs with constituency preferences on the same policy. MP $ \ne $
Majority is a binary variable that takes the value of 1 if an MP disagrees with the majority of party constituents (either supporting or opposing the policy), and 0 otherwise.
$ \ne $
Majority is a binary variable that takes the value of 1 if an MP disagrees with the majority of party constituents (either supporting or opposing the policy), and 0 otherwise.
The distribution of constituency preferences is likely to affect both the key predictors of interest in the analysis and perceptual accuracy. Thus, all models account for preference imbalance: the absolute difference between the share of constituents supporting or opposing a given policy. Smaller values reflect a more balanced distribution of preferences, which should be associated with less perceptual accuracy. Additionally, the models account for two individual features of the MPs that may shape their capacity to gauge constituency preferences: policy expertise and experience in office. Expertise is based on committee membership. To create this measure, I matched each policy issue available in the dataset to one of the Riksdag committees in place during the respective term. Expertise takes the value of 1 if the MP belongs to the committee associated with a given policy, and 0 otherwise. Experience in office is captured by the logged number of terms in office.
The final dataset includes several sources of variation: across time, parties, policies, and individual MPs. I am interested in capturing individual-level variation in the capacity of MPs to gauge constituency preferences. Therefore, the models include fixed effects to account for any systematic differences across time, party, or policy. Finally, because each MP enters the dataset multiple times (once per policy issue in a given wave, and eventually across waves), all models include cluster-robust standard errors by individual MP. The same results are obtained when the models alternatively include fixed effects by individual MP (Table C3).
Results
As a starting point for the analysis, Figure 2 describes levels of alignment between perceptions of public opinion and the preferences of high-status and low-status voters. The x-axis describes how the different subconstituencies are measured in each pair of estimates. Perceptions of public opinion among Swedish legislators are consistently better aligned with the preferences of high-status voters. With the exception of income, the differences in agreement between high- and low-status constituents are distinguishable from zero at conventional levels (p-values < 0.05) and range from 4 to 7 percentage points. This descriptive pattern provides initial evidence that elite beliefs disproportionately reflect the position of privileged groups.
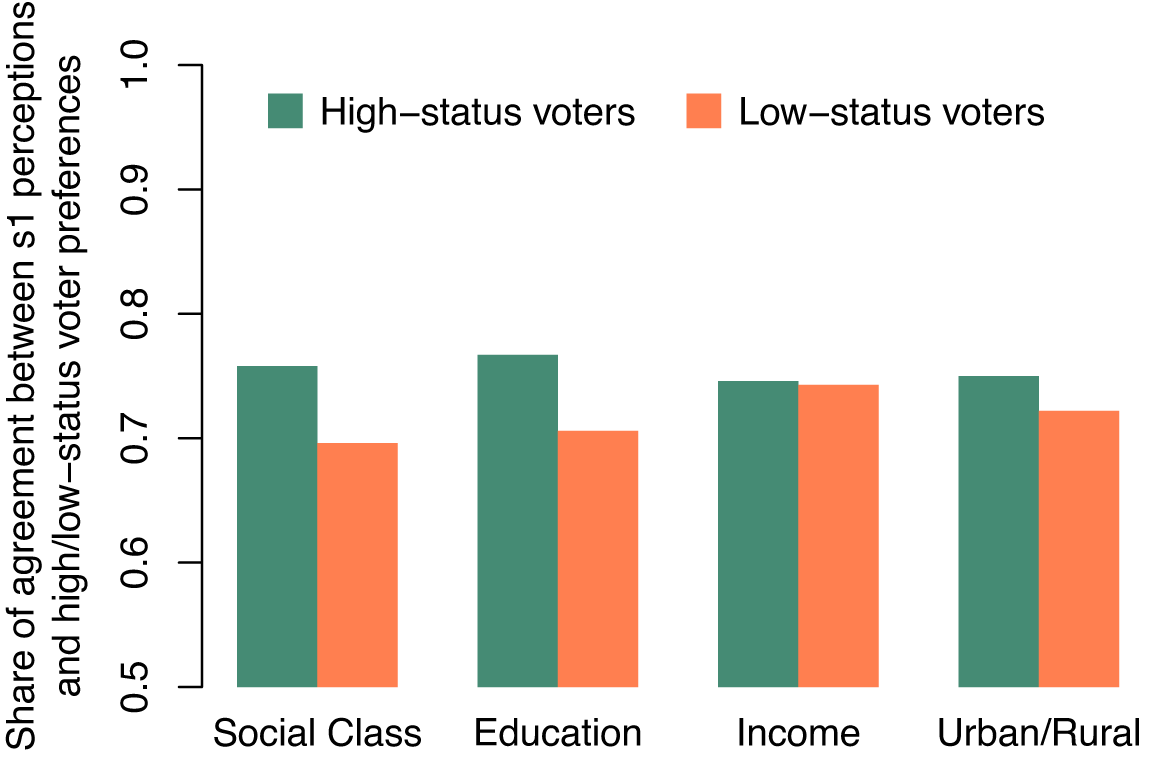
Figure 2. Share of Policies Where MP Perceptions of Majority Preferences Align with High-status/Low-status Voter Preferences
Note: Each bar represents the share of policy assessments in the parliamentary survey where MP perceptions of constituency preferences aligned with the majority opinion among different operationalizations of high/low-status voters (described along the x-axis).
Figure 3 reports the main results from Study 1. The estimates for each of the key predictors (listed on the y-axis) were derived from linear probability models with Perceptual Accuracy as the outcome. The predictor High-status $ \ne $
Majority captures instances where high-status voters deviate from the majority opinion on a given policy issue. Each color represents a pair of estimates from a different model based on the measure of high-status voters adopted. The results provide support for the two main predictions derived from the theory and are robust across measures of political resources.
$ \ne $
Majority captures instances where high-status voters deviate from the majority opinion on a given policy issue. Each color represents a pair of estimates from a different model based on the measure of high-status voters adopted. The results provide support for the two main predictions derived from the theory and are robust across measures of political resources.
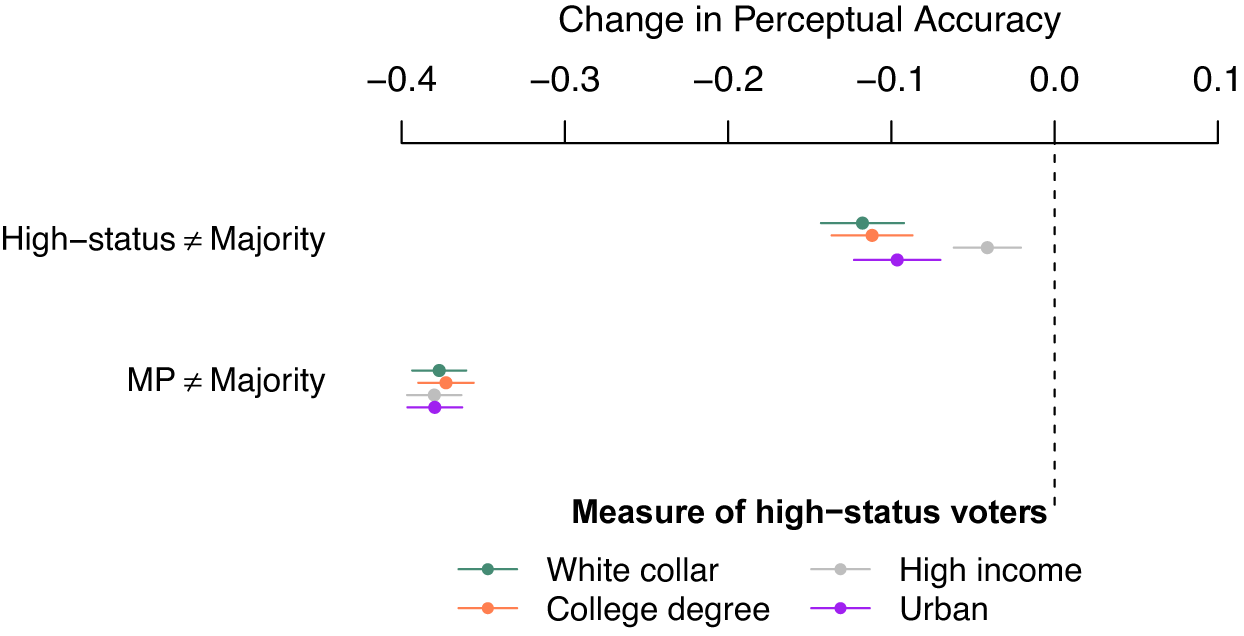
Figure 3. The Role of High-status Voters and MP Personal Preferences in Perceptual Accuracy
Note: Dots are estimates from linear probability models with perceptual accuracy as the outcome variable. Horizontal lines represent 95% confidence intervals. The main predictors are listed on the y-axis. Each color represents a different model based on the operationalization of high-status voters. Full model results in Table C1.
Disagreements between high-status voters and the majority of party constituents are associated with lower perceptual accuracy. The effects are substantively meaningful. As an example, when white-collar voters disagree with the majority on a given issue (top estimate), the probability that MPs correctly perceive majority preferences is 12 percentage points lower. Importantly, these effects imply that legislators are replacing the position of the majority with the position of privileged subconstituencies. Consider an instance where the majority supports a policy but white-collar voters oppose it. In this case the predictor takes the value of 1. The negative coefficient means that legislators are more likely to (incorrectly) claim that the majority opposes the policy when white-collar voters also oppose it. Thus, perceptions of majority preferences follow the position of high-status constituents.
A similar pattern is observed when high-education voters disagree with the majority (point estimate = −0.11; SE = 0.01). Occupational social class and educational attainment are positively correlated (Pearson’s r = 0.28), but only 47.2% of self-identified white-collar respondents were also classified as high education. Therefore, the two constructs are not capturing the same subconstituency. Finally, the effects of policy disagreement for high-income voters are also statistically significant and in the expected direction, but they are smaller in magnitude (point estimate = −0.04; SE = 0.01).Footnote 13
The models also provide support for the social projection hypothesis. Returning to the social class model (green estimates), the coefficient for MP $ \ne $
Majority suggests that when MPs support/oppose a policy that is opposed/supported by the majority of party voters, the probability of correctly perceiving constituency preferences decreases 38 points. The estimated effects of social projection are sizeable. Holding the remaining variables at their medians, the predicted probability of correctly identifying the majority opinion on a given issue goes from 0.90 when MPs agree with their party constituency to 0.52 when MPs disagree. According to the model, the chances of dealigned MPs correctly perceiving copartisan preferences are close to those for a coin toss.
$ \ne $
Majority suggests that when MPs support/oppose a policy that is opposed/supported by the majority of party voters, the probability of correctly perceiving constituency preferences decreases 38 points. The estimated effects of social projection are sizeable. Holding the remaining variables at their medians, the predicted probability of correctly identifying the majority opinion on a given issue goes from 0.90 when MPs agree with their party constituency to 0.52 when MPs disagree. According to the model, the chances of dealigned MPs correctly perceiving copartisan preferences are close to those for a coin toss.
Importantly, these results are obtained accounting for preference imbalance within each party constituency. Opinion dealignment between voters and MPs is more likely when public opinion is evenly split on a given issue. However, all models account for the absolute difference between copartisan supporters and opponents in a given policy. The results are also not explained by time-invariant differences across legislators. As reported in Table C3, the same patterns are uncovered when the analyses include fixed effects by individual MP (N = 1,069).
A question that remains open is whether the effects of high-status voters disagreeing with the majority are unique to privileged groups. It is possible that the patterns observed mainly capture instances where the distribution of voter preferences is wider, or less crystallized. In this context, it is more likely (1) that some segments of the electorate have a distinct opinion from the majority and (2) that perceptual accuracy is lower, as gauging policy preferences can be more challenging. To assess this alternative explanation, I reestimated the main models replacing High-status $ \ne $
Majority with measures of opinion disagreement between low-status voters and the majority.Footnote
14 If the patterns observed above result from the lack of opinion crystallization, we should observe similar effects for privileged and less-privileged voters. The results reported in Figure C1 do not support this argument. Across specifications, the coefficient for disagreement between low-status voters and the majority is either indistinguishable from zero or in the opposite direction of what we would expect.Footnote
15
$ \ne $
Majority with measures of opinion disagreement between low-status voters and the majority.Footnote
14 If the patterns observed above result from the lack of opinion crystallization, we should observe similar effects for privileged and less-privileged voters. The results reported in Figure C1 do not support this argument. Across specifications, the coefficient for disagreement between low-status voters and the majority is either indistinguishable from zero or in the opposite direction of what we would expect.Footnote
15
In sum, the analyses suggest that differential exposure and social projection are relevant drivers of elite misperceptions. When high-status voters disagree with the majority, legislators are systematically less likely to correctly gauge constituency preferences. The same is not true for low-status voters. In turn, when legislators themselves disagree with constituents on a given issue, their ability to identify the majority opinion is meaningfully curtailed.
Mechanism Test: MP Behavior and Personal Background
So far, the analysis suggests that Swedish MPs tend to rely disproportionately on the positions of high-status voters when gauging public opinion. This may be happening for a number of reasons. I argue that this pattern results from biases in exposure to different subconstituencies.Footnote 16 If this mechanism is correct, we should expect the weight attached to the opinions of more-privileged voters to vary according to (1) the active decisions of MPs to engage with different groups and (2) the idiosyncratic background of legislators.
To test the plausibility of this mechanism, I conducted two additional analyses. First, I reestimated the main model reported above, but conditioning White-collar $ \ne $
Majority on how often MPs report meeting with (1) blue-collar unions (members of the Landsorganisationen i Sverige) and (2) private businesses and business organizations.Footnote
17 If the exposure hypothesis is correct, we should expect the capacity of white-collar preferences to sway elite perceptions of public opinion to decrease with the regularity of contacts with blue-collar unions. The opposite pattern would be expected for contacts with business organizations.
$ \ne $
Majority on how often MPs report meeting with (1) blue-collar unions (members of the Landsorganisationen i Sverige) and (2) private businesses and business organizations.Footnote
17 If the exposure hypothesis is correct, we should expect the capacity of white-collar preferences to sway elite perceptions of public opinion to decrease with the regularity of contacts with blue-collar unions. The opposite pattern would be expected for contacts with business organizations.
Figure 4 provides suggestive evidence in line with this argument. Panel (a) reports the marginal effects of white-collar voters disagreeing with the majority on a given issue, conditional on MPs’ self-reported contacts with blue-collar unions. The distribution of the conditioning variable is described along the x-axis and reveals appropriate common support for most of the scale. As expected, the weight of white-collar voter preferences is smaller among legislators with more exposure to blue-collar unions (p-value for interaction term = 0.05). According to the model, when white-collar voters disagree with the majority, the probability that an individual MP who never contacts blue-collar unions correctly identifies the majority position decreases 18.1 percentage points. The same effect for MPs who interact with unions once or twice a month decreases to 11.6 points. The opposite pattern is observed in Panel (b) for interactions with business organizations (p-value = 0.08). Regular contacts with businesses are associated with a heightened weight of white-collar preferences.
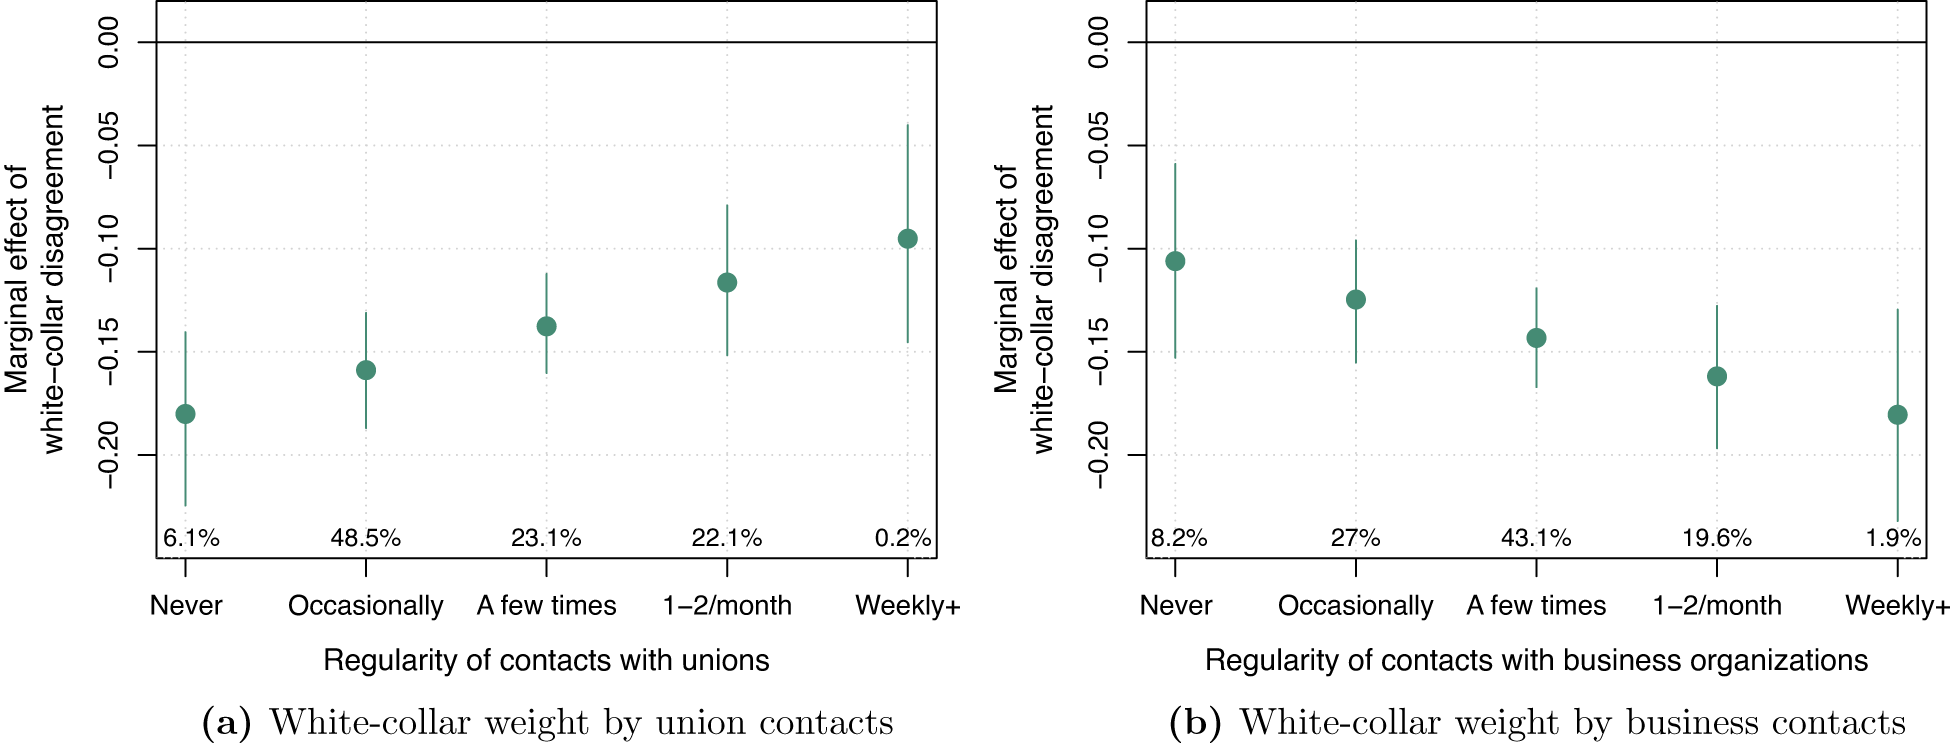
Figure 4. The Marginal Effects of White-collar Voters Disagreeing with the Majority on Perceptual Accuracy Conditional on MP Contacts with Blue-collar Unions and Businesses
Note: Dots are marginal effects of white-collar voters disagreeing with majority on perceptual accuracy, conditional on the regularity of contacts with blue-collar unions (panel a) and businesses (panel b). Vertical bars are 95% confidence intervals. Numbers along x-axis describe the distribution of the conditioning variable. See Table C9 for full results.
Next, I explore how the personal background of MPs can moderate exposure to different subconstituencies. I consider the role of MPs’ (1) occupational class prior to joining parliament, (2) educational background, and (3) place of residence growing up.Footnote 18 The expectation is that the preferences of high-status voters carry less weight among legislators with less-privileged backgrounds: non-white-collar MPs (53.1% of the sample), MPs without a college degree (43.1%), and MPs with a rural background (51.4%).
The analyses reported in Figure 5 provide partial support for this prediction. Each panel reports the marginal effects of high-status voters disagreeing with the majority, conditional on MPs’ (a) social class, (b) educational background, and (c) geographical background. The operationalization of high-status voters in each model matches the specific background feature of the MPs and is described on the y-axes. Across specifications, the results suggest that legislators with less-privileged backgrounds are less likely to rely on the positions of high-status voters when gauging constituency preferences. The effects are reliable for educational and geographical background. As an example, the estimates in panel (c) suggest that, when urban voters disagree with the majority, perceptual accuracy decreases on average 12.4 points among MPs with an urban background, but only 7.5 points among MPs with a rural background (p-value of interaction term = 0.02). The results are consistent with research on the substantive effects of descriptive representation (Carnes and Lupu Reference Carnes and Lupu2015).
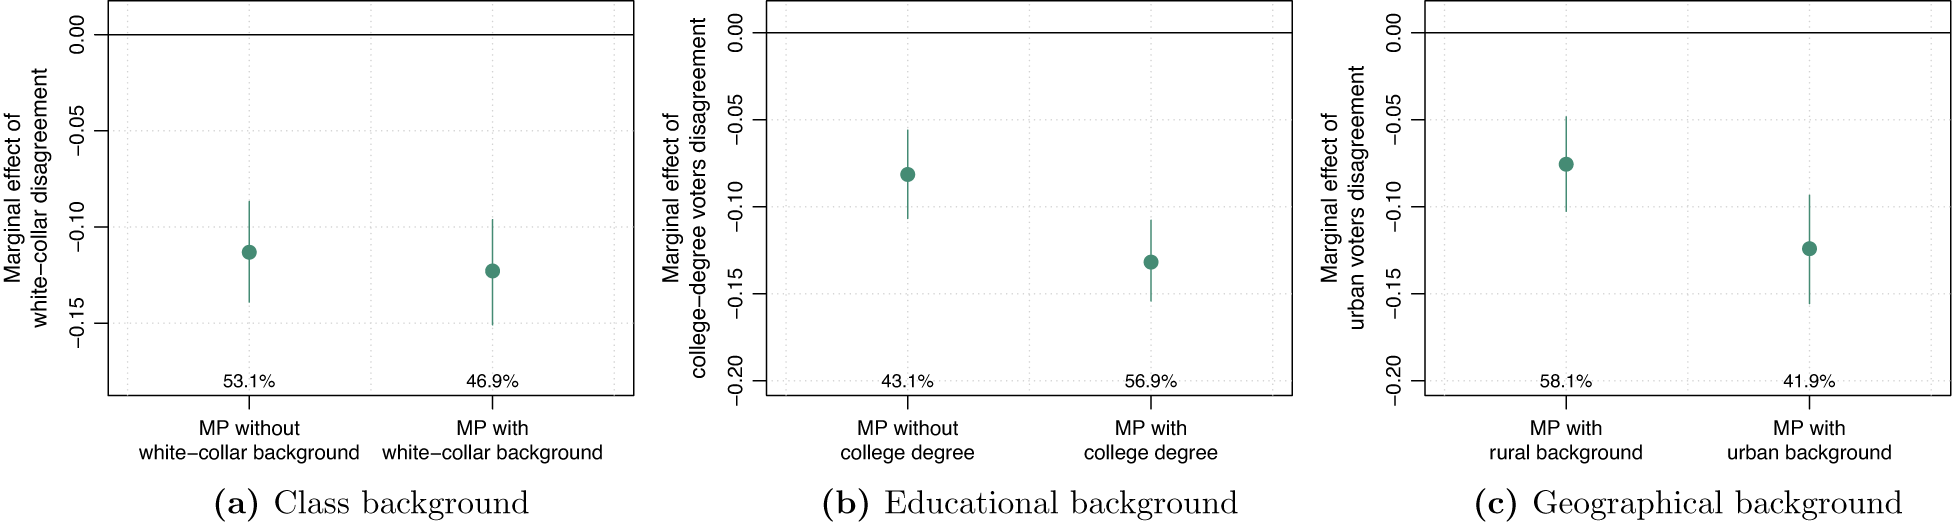
Figure 5. The Marginal Effects of High-status Voters Disagreement on Perceptual Accuracy Conditional on MPs’ Class Background, Educational Background, and Geographical Background
Note: Dots are marginal effects of high-status voters disagreeing with majority on perceptual accuracy, conditional on the MP’s class (panel a), educational (panel b), or geographical (panel c) background. The operationalization of high-status voters in each model is described along the y-axis and was chosen to be consistent with the moderator. Vertical bars are 95% confidence intervals. Numbers along the x-axis describe the distribution of the conditioning variable. See Table C10 for full results.
Together, the analyses provide evidence for the mechanism underlying the exposure hypothesis. Both the behavior of MPs in office (Figure 4) and their idiosyncratic background (Figure 5) shape the type of information used when gauging constituency preferences.
Study 2: Experiment with Swiss Local Officials
The previous study revealed two sources of bias in elite perceptions of public opinion: inequalities in exposure and social projection. I conducted Study 2 to assess whether these biases can be minimized. Can public officials be encouraged to develop more accurate beliefs about their constituencies?
The analyses are based on an original survey of Swiss local elected officials leveraging real political events. Switzerland offers a unique opportunity to study elite perceptions of public opinion due to the large number of popular votes held every year. By conducting a survey of local representatives prior to a set of referendums, I was able to compare elite perceptions of constituency support for different issues with accurate behavioral measures of policy support at the municipal level.Footnote 19 Two advantages result from this empirical strategy. First, it allows me to go around measurement issues associated with calculating preferences for subnational constituencies. Second, as voter preferences are measured through referendum outcomes and politicians were asked to anticipate these same results, evidence for the exposure hypothesis cannot be explained by officials deliberately discounting the position of less-privileged subconstituencies because they are less likely to vote. Considerations about who turns out are embedded in the task.
I recruited public officials as part of the 2017 National Survey of Local Executive Members (NSLEM), a large survey covering roughly 60% of the population of Swiss local elected officials (Steiner et al. Reference Steiner, Ladner, Kaiser and Machljankin2019).Footnote 20 A total of 5,240 participants provided their contact information to take part in a follow-up study. From this pool, 2,917 officials completed the online survey administered through Qualtrics (56.7% response rate).Footnote 21
The survey was fielded in November 2018, two weeks before a set of federal referendums.Footnote 22 The questionnaire and all communication materials were translated to Swiss German, Swiss French, and Swiss Italian.Footnote 23 The key goal of the survey was to capture elite perceptions of local public support for a series of popular initiatives voted on that occasion. Respondents were asked to predict the share of voters in their constituency who would support two distinct referendums: the self-determination initiative and the horned-cow initiative. The first referendum, initiated by the nationalist Swiss People’s Party (SVP), proposed an amendment to the constitution that would give primacy to the Swiss constitution and popular votes over international treaties. The issue attracted substantial public attention and reached record levels in campaign spending (up to CHF 8 million, or $8M).Footnote 24 The horned-cow initiative, on the other hand, was a low-salience issue. The proposal sought to prevent farmers, through federal subsidies, from opting to keep hornless animals (Milic, Feller, and Küb Reference Milic, Feller and Küb2019).
Experimental Design
Respondents were asked to predict the share of voters in their constituency who would support each referendum.Footnote 25 Prior to the prediction tasks, officials were randomly assigned to one of three groups.Footnote 26 A control group received no additional information. After reading a description of each referendum, officials in this group were directly asked to anticipate the outcome of the popular vote in their municipality. Two other groups were presented with vignettes designed to increase perceptual accuracy, based on my theoretical predictions.
Exposure condition : This group received information about the composition of the electorate in their municipality. The goal of this intervention was to encourage local officials to avoid potentially skewed availability heuristics resulting from inequalities in exposure. To do so, respondents took part in a three-stage task. First, they were asked to guess the prevalence of different segments of the electorate in their constituency (e.g., foreign-born citizens, supporters of the Green party). This information was recorded and reported on the following page of the survey along with the official data from the Federal Statistical Office for their municipality and for Switzerland as a whole. Finally, officials were asked to take this information into account when making their referendum predictions. Figure E1 provides a specific example of the vignette.
The type of information provided varied according to the referendum. To ensure that this information was informative, pretests assessed the predictive power of different indicators on support for similar referendums voted in the recent past.Footnote 27 For the self-determination initiative, officials were presented with data on the share of foreign-born citizens and SVP voters in their municipality. For the horned-cow initiative, the information provided was the combined share of SP and Green party supporters in the constituency and the share of workers in the primary sector.
Exposure and Self-awareness Condition : The third group received the same informational treatment provided to the second group plus a recommendation to avoid projecting their own preferences on constituents. Box 1 provides the exact wording of the vignette. Recent scholarship suggests this type of feedback is the most effective way to mitigate social projection (Morewedge et al. Reference Morewedge, Yoon, Scopelliti, Symborski, Korris and Kassam2015).Footnote 28
The expectation is that officials in the exposure condition should be more likely to correctly perceive the majority opinion in their constituency relative to officials in the control condition. In turn, subjects who received the self-awareness intervention should be less likely to project their preferences on constituents and more likely to correctly perceive majority preferences (relative to the second group). To avoid contagion effects, randomization was made at the respondent level and the order of the referendums was randomized. Finally, I used multivariate continuous blocking to maximize balance between conditions on (1) partisanship, (2) language (German, French, or Italian), (3) municipality size (population), (4) canton, and (5) local support for the SVP and the Social Democratic Party (SP) in the previous general election. Table E2 reports covariate balance tests.
Box 1. Self-awareness Vignette
Decades of research show that people tend to project their own preferences to others. Without noticing, we often overestimate approval for issues we support, while underestimating approval for issues we oppose. Try to take this into account when making your prediction.
Results
On November 25th, 2018, Swiss voters rejected both initiatives. Nationwide, 33.8% of voters supported the self-determination initiative, whereas 45.3% supported the horned-cow initiative. However, there was considerable variation across municipalities. Local support for the self-determination initiative, for instance, ranged from 12.5% to 83.7%. Figure E2 describes the distributions of local-level support for each referendum.
I combined these expressed preferences with the survey results to build a measure of Perceptual Accuracy. The variable takes the value of 1 if a local official correctly perceived the majority position in his or her constituency, for a given initiative, and 0 otherwise.Footnote 29 On average, Swiss local officials correctly identified the majority position in their constituency 72% of the time.Footnote 30 This figure represents a relatively high baseline, potentially resulting from the small size of Swiss local constituencies and the wealth of information provided to public officials by the regular referendums.
However, the interventions improved perceptual accuracy upon this baseline. Figure 6 presents the results of three linear probability models with Perceptual Accuracy as the outcome variable. Coefficients for each treatment condition (described along the y-axes) represent the average difference in the probability of correctly perceiving local majority support relative to the control group.Footnote 31 Panel a (from Figure 6) reports treatment effects for the self-determination initiative. On average, local officials who received information on electorate composition (the exposure group) were 6.4 percentage points more likely to correctly identify the majority position in their constituency relative to the control group. This effect is statistically significant (p-value = 0.002) and substantively meaningful. It represents an 8.9% increase in perceptual accuracy, relative to the mean value of the outcome.Footnote 32 This pattern is in line with theoretical predictions. When representatives are encouraged to avoid availability heuristics and consider their constituency more broadly, perceptual accuracy increases. The effect of the Exposure and Self-awareness intervention, in turn, is also positive and reliable (point estimate = 0.04; p-value = 0.04). However, the effect is indistinguishable from the Exposure condition (p-value = 0.31). The analysis provides no evidence that encouraging political elites to avoid social projection increases perceptual accuracy.
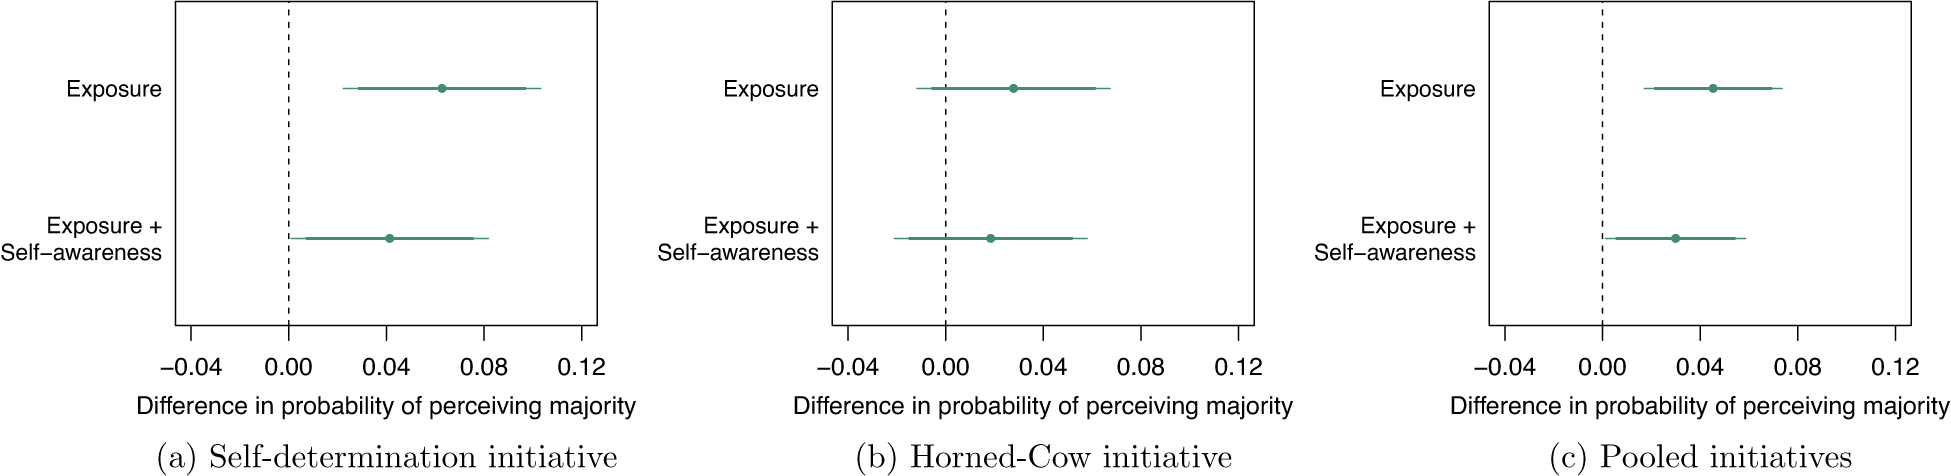
Figure 6. The Causal Effects of Exposure and Self-awareness of Social Projection on Perceptual Accuracy, by Referendum
Note: Points are estimates of the difference in the probability of local officials correctly perceiving the majority opinion in their constituency by treatment condition (control = baseline and treatment groups described in the row labels). Wider/thinner horizontal lines are 95% and 90% confidence intervals. See Table F1 for full results.
The results for the horned-cow initiative (Panel b) are less conclusive. The estimates for Exposure (0.03) and Exposure and Self-awareness (0.02) are positive, as expected. However, the differences in the probability of correctly perceiving majority support are indistinguishable from zero at conventional levels of statistical significance. The analysis does not allow me to rule out small differences. Still, if anything, the treatment effects for this initiative were fairly small.Footnote
33 Finally, Panel c presents the pooled treatment effects on perceptual accuracy. This analysis includes fixed effects by initiative to account for any systematic differences between referendums and cluster-robust standard errors by local official. The results are consistent with the patterns observed for the self-determination initiative. The average differences in perceptual accuracy for officials in the Exposure and Exposure and Self-awareness conditions are 0.05 (SE $ =0.01 $
) and 0.03 (SE = 0.01), respectively.
$ =0.01 $
) and 0.03 (SE = 0.01), respectively.
Together, the results show that the exposure intervention effectively increased perceptual accuracy. However, the manipulation designed to encourage legislators to avoid social projection did not meaningfully alter how elected officials gauged public opinion. On average, officials who received the self-awareness vignette were not more likely to correctly perceive the majority opinion. This result is consistent with previous failed efforts to mitigate social projection in different contexts through perspective taking or feedback (Krueger and Clement Reference Krueger and Clement1994).
A question that remains open is whether the self-awareness intervention shaped the propensity of local officials to project their own preferences on constituents. To test this intermediate step, Figure 7 shows the results of linear models predicting perceived public support as a function of personal support (binary), interacted with the Exposure and Self-awareness condition. The models omit officials in the control group to isolate the effect of the self-awareness intervention by comparing the two treatment groups directly. The estimates in each panel are the coefficients of legislator support on perceived public support, for respondents in each treatment group (described in the y-axes). Representatives in both conditions engaged in some degree of social projection. Regardless of treatment condition, the point estimates are positive and reliable. Legislators who supported a given issue perceived public support for that issue to be systematically higher.
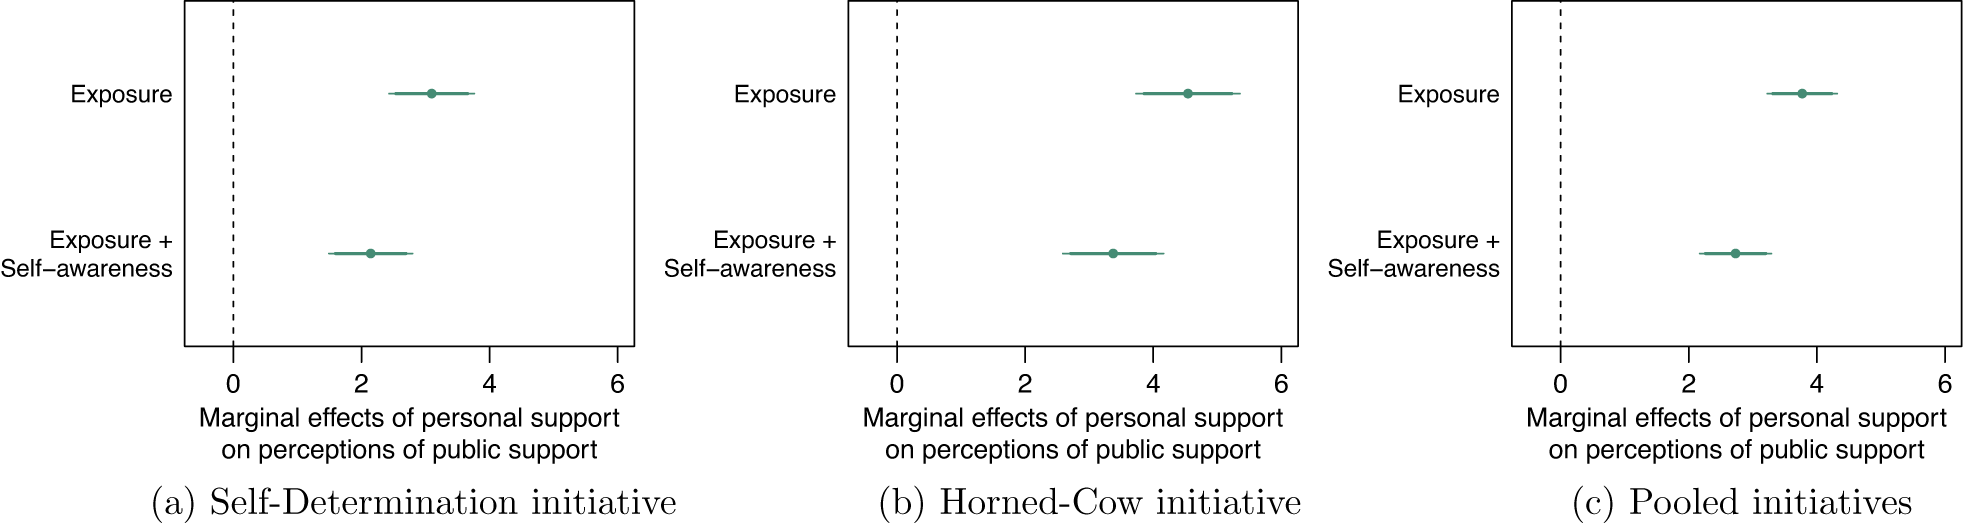
Figure 7. The Effects of Self-awareness on the Propensity of Legislators to Project Their Preferences on the Electorate, by Referendum
Note: Points are estimates of the effect of policy support on perceptions of public support, by treatment group (described in the row labels). Wider/thinner horizontal lines are 90% and 95% confidence intervals. Control group omitted from the analysis to isolate the effect of the self-awareness intervention. Full model results in Table F2.
However, subjects who received the self-awareness vignette were significantly less likely to project their own preferences on voters. The differences in point estimates are reliable in all specifications at conventional levels of statistical significance (p-values of 0.046, 0.04, and 0.005, respectively). The intervention reduced the propensity of legislators to project their preferences on voters, but this incentive was not enough to improve their ability to correctly identify the majority opinion. A potential explanation for this result is that social projection only translates into misperceptions when officials disagree with voters, and roughly two thirds of local officials in the study sided with the majority of their constituency in each issue. An alternative explanation is that the combined intervention was too demanding and encouraged satisficing.
Discussion
This project explores how elected officials build their image of the constituency. I argue that inequalities in political voice and personal biases of elected officials play an important role in explaining misperceptions. Consistent with these arguments, Study 1 shows that Swedish MPs rely disproportionately on the positions of privileged subconstituencies. A propensity for legislators to overestimate support for policies they themselves endorse is also a powerful predictor of misperceptions. Next, I explore the degree to which these biases can be experimentally reduced. In a survey with nearly 3,000 Swiss local officials, respondents were asked to anticipate the outcome of two federal referendums in their constituency after being assigned to different informational nudges. The results show that misperceptions can be reduced by encouraging representatives to avoid inequalities in exposure.
The Swedish and Swiss studies were designed to complement each other. For instance, Study 1 allows for the possibility that politicians misperceive constituency preferences simply for strategic reasons: either because some groups matter more for reelection or because politicians derive utility from appearing in line with voters (halo effects). However, if this was the case, the informational cues in Study 2 should not affect perceptual accuracy. The Swiss study allows me to conclude that strategic considerations cannot fully account for the patterns observed.
Still, there are specific limitations that are important to emphasize. First, in Study 1 it is not possible to ensure that the measures of party constituency preferences are representative. The robustness of the findings among smaller parties, the electorate as a whole in 1985, and accounting for uncertainty in public opinion estimates mitigate these concerns. Still, more flexible measurement models that allow subsampling based on different political dimensions would represent a major contribution to the literature. What best represents a constituency for legislators in different European countries also remains an open question. In Study 1, party voters were defined as the key constituency for Swedish legislators, whereas in Switzerland the reference constituency was the group of voters who turned out in the referendums. The consistent results across studies, as well as in the United States (see Appendix H), suggest that the sources of misperceptions identified here may operate in similar ways regardless of how a constituency is defined. Still, how constituencies are defined in the eyes of representatives in different contexts remains an open question. Relatedly, the study builds upon a model of representation where all opinions in the constituency are weighed equally (Katz Reference Katz2014). However, politicians may care less about voter preferences over policy and more about issue salience, policy outcomes, or the groups most affected by a given policy. Future contributions would benefit from exploring the implications of inequalities in exposure and egocentric biases in different models of representation.
The findings have several implications for the study of political representation and elite behavior. On one hand, the study reveals one way through which inequalities in political voice constrain the prospects of democratic representation. The study joins recent work in the United States uncovering relevant distortions in elite perceptions of public opinion (Broockman and Skovron Reference Broockman and Skovron2018; Hertel-Fernandez, Mildenberger, and Stokes Reference Hertel-Fernandez, Mildenberger and Stokes2019). However, Sweden and Switzerland are two of the most socially inclusive societies in the world. The fact that in both countries inequalities in political voice seem to have such meaningful effects on elite perceptions of public opinion is concerning. The findings shed some light on the path yet to cover until societies are able to sustain fully inclusive institutions. On the other hand, the Swiss study suggests that misperceptions are not unsurmountable. Encouraging legislators to avoid availability heuristics induced more accurate beliefs about voters. Although more research is needed to confirm the robustness of these findings, they suggest that improving perceptions of public opinion is possible even with subtle interventions.
The findings also contribute to scholarship on descriptive representation. Recent work shows how the social and professional backgrounds of politicians shape their behavior in office, even in party-centric systems (Carnes Reference Carnes2013; Carnes and Lupu Reference Carnes and Lupu2015). The patterns reported here provide two novel explanations for this relationship. First, politicians with less-privileged backgrounds can be less susceptible to inequalities in exposure. Second, to the extent that shared backgrounds are associated with shared preferences, social projection can lead legislators to overestimate support for different policies, according to their individual milieu. Either mechanism can shape perceptions of public opinion without the active awareness of legislators, pushing them to pursue different policies while in office.
Finally, the Swiss experiment has the potential to pave the ground for new behavioral research with political elites. So far, this nascent area of research has focused on uncovering biases in elite behavior: instances where the decisions of legislators deviate from rational choice predictions (Esaiasson and Öhberg Reference Esaiasson and Öhberg2020; Sheffer et al. Reference Sheffer, Loewen, Soroka, Walgrave and Sheafer2018) or from normative understandings of the democratic process (Costa Reference Costa2017; Kalla and Broockman Reference Kalla and Broockman2016; Pereira Reference Pereira2021a). A natural next step is to use this information to provide tools for elected officials to overcome those biases, as the Swiss experiment exemplifies. The results reveal how theory-driven interventions can encourage politicians to develop more accurate beliefs about their constituents. These findings are likely context- and design-dependent. Kalla and Porter (Reference Kalla and Porter2020) provide less optimistic findings among state legislators in the United States. Future research should further investigate when and why elected officials are willing to update their beliefs about mass preferences.
Supplementary Materials
To view supplementary material for this article, please visit http://dx.doi.org/10.1017/S000305542100037X.
Data Availability Statement
Research documentation and data that support the findings of this study are openly available at the American Political Science Review Dataverse: https://doi.org/10.7910/DVN/HKV6YX.
Acknowledgments
I would like to thank Daniel Butler, Nick Carnes, Christina Casnellie, Matthew Gabel, Nathalie Giger, Jonathan Homola, Jae-Hee Jung, Jeong Hyun Kim, David Miller, Andrew Stone, Margit Tavits, Dalston Ward, and Jeffrey Ziegler. Also thank you to Marc Bühlmann, Peter Esaiasson, Andreas Ladner, Lucas Leemann, Jan Fivaz, Julien Fiechter, Beat Furrer, Elin Naurin, Nicolas Pekari, Mikael Persson, and Patrik Öhberg, for the insights into Swedish and Swiss politics. This work was supported by APSA Centennial Center, and Washington University’s Graduate Research Seed Grant.
Conflict of Interest
The author declares no ethical issues or conflicts of interest in this research.
Ethical Standards
The author declares that the human subjects research in this article was reviewed and approved by the Human Research Protection Office at Washington University in St. Louis (IRB protocol #201810084) and the Ethics Commission at University of Geneva (CER-SDS-12-2018). The author affirms that this article adheres to the APSA’s Principles and Guidance on Human Subject Research.


 Open access
Comments
No Comments have been published for this article.