
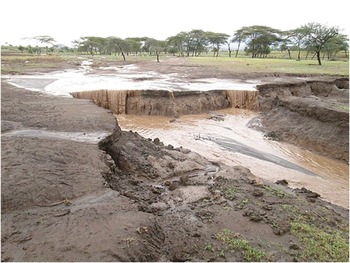
Fig. 6.1 Runoff and erosion during an intense rainstorm on an Andisol (Ustand) near Arusha, Tanzania.
Soil physical properties are those responsible for the transport of water, solutes, air and heat in the soil. The main physical soil properties are depth, temperature, texture, structure, bulk density and water-holding capacity. The main processes involved are infiltration, tillage, compaction, percolation, leaching, runoff and erosion (Fig. 6.1). The critical take-home message of the first edition was that there is a difference in water tensions in clayey Oxisols and other Ci soils (Chapter 5) as compared to soils with high-activity clays. This difference is due to strong granular structure of these oxidic soils, which makes them behave like sands at low soil moisture tensions (when wet), but more like the clays at high soil moisture tensions (when dry).
Several major issues have emerged since. These include the importance of the fine-sand and silt fractions in surface sealing and soil compaction, soil erosion at the landscape scale and conservation agriculture. Another recent concept is that of core soil properties, texture, mineralogy and soil organic matter (SOM), which are those that underlie ecosystem services (Palm et al. Reference Palm, Sanchez, Ahamed and Awiti2007). These properties do control most physical soil processes.
6.1 Depth of Rooting
The most obvious physical limitation – insufficient soil depth for adequate root development – is often ignored. Physical barriers to root development are probably less common in the tropics than in the temperate region because of the generally deeper subsoils of highly weathered soils, particularly in Oxisols, Ultisols and Alfisols, but they do exist. Soils having the R substrata type (lithic or paralithic contact at 50 cm or less) cover 98 million hectares, or 2 percent of the tropics (Chapter 5). A classic study at the International Rice Research Institute (IRRI 1964) showed that rice yields increased linearly as the effective depth of rooting increased from 10 to 40 cm.
Stone lines are found in many tropical soils, reflecting geological discontinuities (Ruhe Reference Ruhe1959). When they occur at less than 50 cm depth, they are included in the R substrata type (Chapter 5). Aluminum-toxic subsoils are more common barriers to root development than shallow soils in the tropics; they cover about 1.4 billion hectares or 28 percent of the tropics.
6.2 Soil Temperature
Soil temperature is seldom considered a serious limiting factor in the tropics. As mentioned in Chapter 1, soil temperatures approximate air temperatures at about 50 cm depth, and are usually adequate for most tropical crops. There are two instances, however, in which soil temperatures can be limiting. These are excessively high temperatures in certain sandy topsoils and low temperatures in the tropical highlands.
6.2.1 Controlling Excessively High Soil Temperatures
Large areas of West Africa are covered by Alfisols that have high sand and gravel content in the topsoil (see Fig 4.10 in Chapter 4). The thermal diffusivity of these horizons is much lower than that of clayey topsoils. Consequently, they can retain large quantities of heat, particularly when dry. Studies in Ibadan, Nigeria, have shown that temperatures in such soils can reach 42 °C at 5 cm depth and 38 °C at 10 cm depth, when bare or recently planted (Lal Reference Lal1975). When topsoil temperatures reach 35–38 °C, they inhibit the emergence of yam sprouts and virtually stop the growth of maize and soybean seedlings (Lal Reference Lal1974). Furthermore, Lal observed that nutrient and water uptake were severely affected at such temperatures.
The solution to this problem consists of mulching with residues from a previous crop. Mulching decreases soil temperatures down to 20 cm depth, as shown in Fig. 6.2. The unmulched plots had excessively high temperatures down to that depth during early stages of growth. As crops develop a canopy soil temperatures decrease, but if a severe drought occurs later in the season, the mulch can prevent the return of excessively high temperatures (Lal Reference Lal1974).
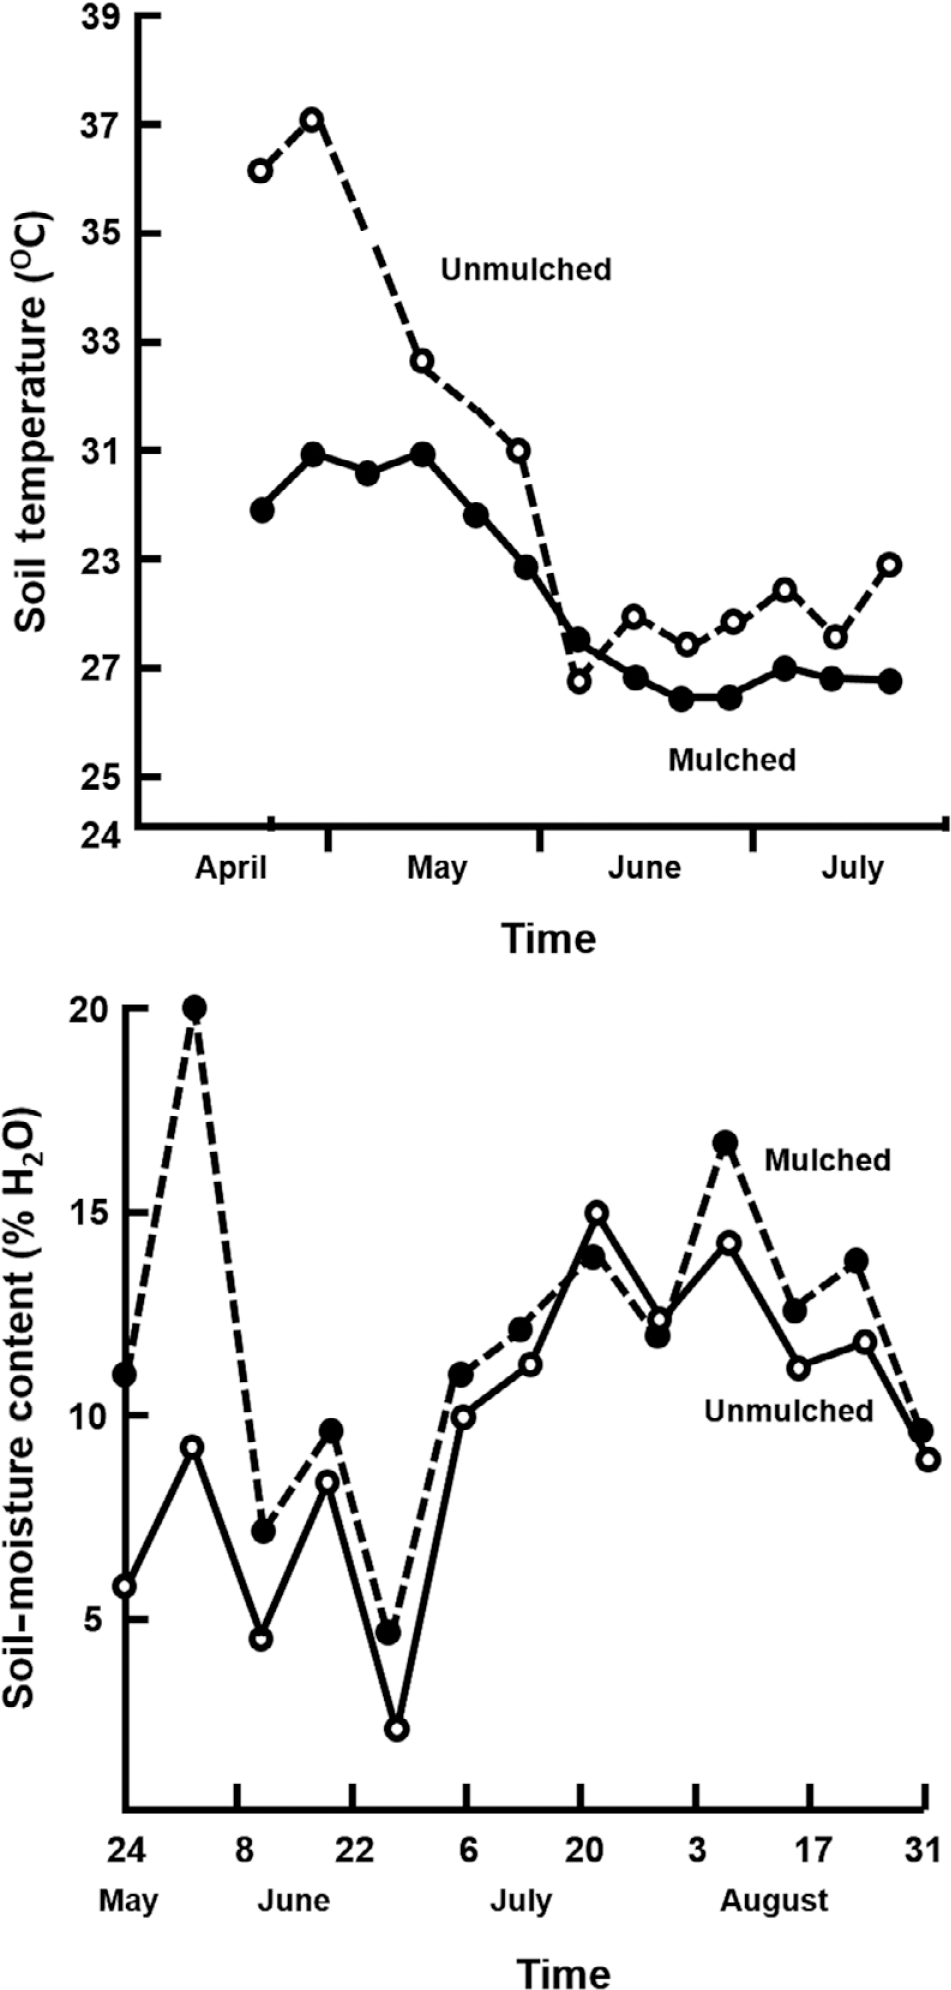
Fig. 6.2 Mulching decreases high soil temperatures and increases soil moisture in a loamy, gravelly Alfisol of Ibadan, Nigeria (Lal Reference Lal1974).
Mulching also increases soil moisture storage throughout the rainy season, as shown in Fig. 6.2. These increases in soil moisture are equivalent to about 8–12 percent of the rainfall received. In this example, the overall effect of mulching was to increase maize yields from 3.6 to 5.4 t/ha, and to decrease weed growth to one-third of that observed in the unmulched plots (Lal Reference Lal1974). The practical problem is where to get biomass for mulching, but this can be addressed by conservation agriculture as discussed later in this chapter.
6.2.2 Controlling Low Soil Temperatures
In the tropical highlands, with isothermic or isomesic soil temperature regimes, many crops suffer from low-temperature limitations, particularly during wet periods. A wet soil also has low thermal diffusivity. Such is the case with certain pineapple plantations on Oxisols in the highlands of Hawaii. Low soil temperatures exert a negative influence on nutrient uptake, and consequently result in longer growth duration and lower yields (Ravoof et al. Reference Ravoof, Sanford, Young and Silva1973).
The solution to this problem is also mulching, but with clear plastic. Unlike the straw mulch discussed before, clear-plastic mulch is a vapor barrier that increases soil temperatures through a greenhouse effect. Transparent polyethylene mulches have also increased mean soil temperatures and decreased irrigation requirements of potatoes in northern India, where low temperatures in the late fall season limit potato growth. Grewal and Singh (Reference Grewal and Singh1974) observed that potato yields increased from 14 t/ha to 20 t/ha when such mulch was used. This increase was positively correlated with the rise in minimum soil temperatures caused by the clear mulch. They are commonly used in tropical highland regions in China for early planting, so that their fruits and vegetables reach the markets earlier when the prices are high. In addition to mitigating temperatures, plastic mulches also control weeds.
6.3 Soil Structure
Soil structure is the size, shape and arrangement of solids and voids, the continuity of voids and their capacity to retain and transmit fluids (Lal Reference Lal1991). The main solid components are the primary mineral particles – sand, silt and clay (Fig. 6.3).
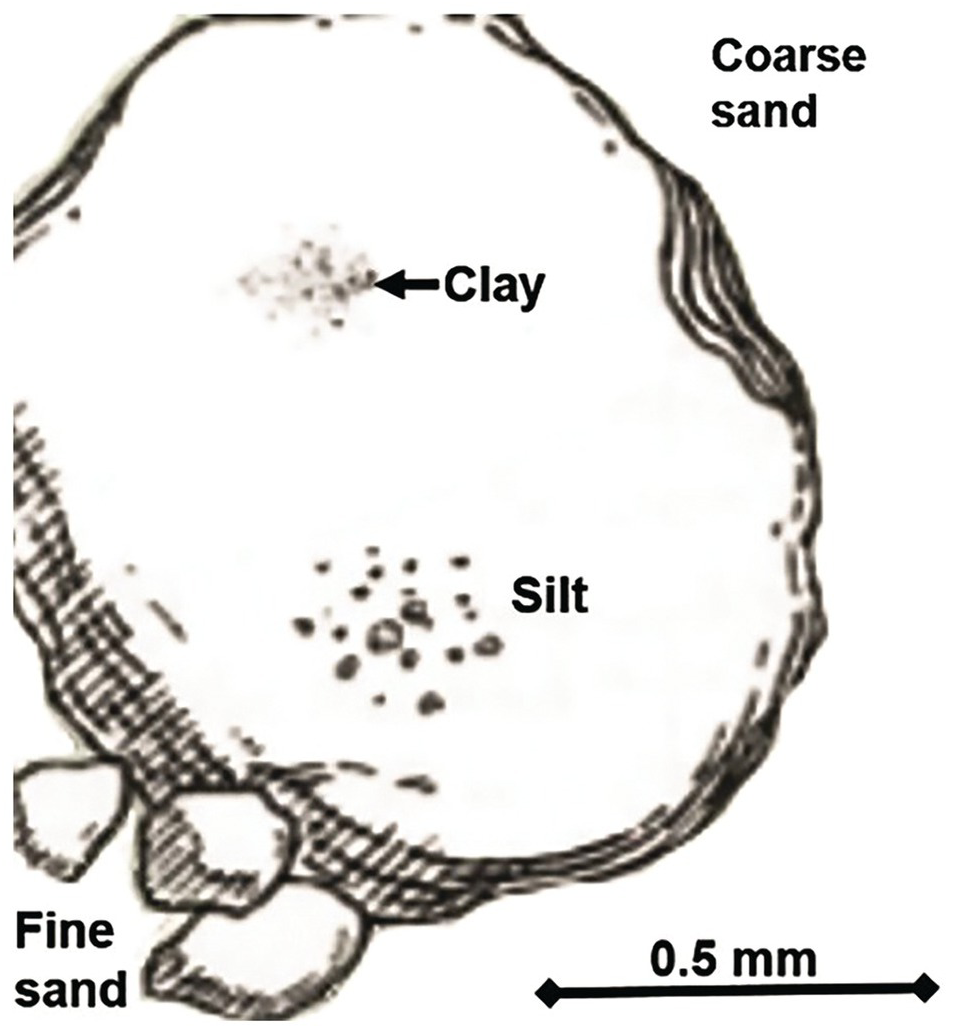
Fig. 6.3 Relative size of the primary soil particles. Coarse sand: 2.0–0.5 mm; medium sand: 0.5–0.25 mm; fine sand: 0.25–0.05 mm; silt: 0.05–0.002 mm; clay: < 0.002 mm (2 µm)Footnote 1.
These primary particles plus SOM, iron and aluminum oxides, decomposing leaves and roots, and soil biota form aggregates. Water-stable aggregates give soils a good structure. They are generally grouped into two sizes. Macroaggregates (> 250 μm), with macropores between them that are generally larger than 50 μm in diameter, drain gravimetric water at –1 kPa to –10 kPa of soil moisture tension.Footnote 2 Microaggregates (50–250 μm) have micropores ranging from 0.2 μm to 50 μm in diameter that hold water at –10 kPa to – 1500kPa of soil moisture tension. These micropores, therefore, hold most of the water available to plants.
Figure 6.4 shows a macroaggregate composed of sand, silt, clay, SOM, a decomposing plant root and voids (macropores). In variable-charge soils, such aggregates are frequently coated and cemented by iron and aluminum oxides. The figure also shows a microaggregate about 100 μm long that could have been part of the macroaggregate above.
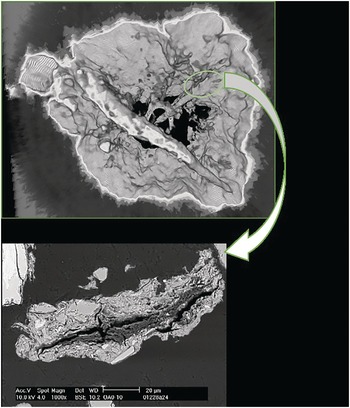
Fig. 6.4 Top: A macroaggregate (> 250 µm). Bottom: A microaggregate (about 100 μm long) that could have come from the macroaggregate above, as indicated by the arrow.
6.3.1 Aggregate Formation
The processes involved in aggregate formation and destruction are shown in Fig. 6.5, divided among three processes for soils with permanent charge and a fourth process for soils with variable charge (Six et al. Reference Six, Elliott and Paustian1999, Reference Six, Conant, Paul and Paustian2002b, Reference Six, Feller, Denef, Ogle, Sá and Albrechtc).

Fig. 6.5 Aggregate formation and destruction. The processes are: (A) fungal and bacterial activity, (B) active root growth, (C) earthworm activity and (D) iron and aluminum oxide interactions in variable-charge soils. UA = unstable aggregate, WSA = water-stable aggregate.
The first phase of aggregate formation is a biological one, starting with bacteria and fungi that begin to bind individual sand, silt and clay particles as well as pieces of plant- and root-derived organic matter (stage A). Afterwards, active root growth further binds particles by exudates and mycorrhizal associations (stage B). Earthworm activity and other macro- and meso-fauna further contribute to the binding of primary particles and particulate plant-derived organic material into unstable macroaggregates (stage C). These three biological processes act simultaneously; their relative roles depend on the microbial population, type of plants, macro- and meso-faunal population and soil pH (see Chapter 10). Low soil pH promotes fungal activity over bacterial activity. In variable-charge soils a fourth process occurs – the binding of clay particles with iron and aluminum oxides (stage D).
The second phase of macroaggregate formation consists of the aging of the components, with further interactions between microbial activity, sand, silt and clay particles and organic materials (along with iron and aluminum oxides in the variable-charge soils). Wetting and drying cycles strengthen the macroaggregates, making them water-stable, and forming microaggregates inside them. Organic inputs are converted into slow and passive soil organic carbon (SOC) pools (Chapter 11). In calcareous soils (b soils in the Functional Capability Classification [FCC] system), which are permanent-charge soils, carbonate and bicarbonate precipitates help to strengthen aggregates in arid environments (Bronick and Lal Reference Bronick and Lal2005).
6.3.2 Aggregate Destruction
The principal aggregate destruction process is tillage, which can physically destroy macroaggregates, “pulverizing” the topsoil. A decrease in organic inputs to the soil also fosters aggregate destruction because it decreases microbial and macrofauna activity, weakening the bonds created by fungal hyphae, root exudates and mycorrhizae. Lack of plant cover also increases soil temperatures and stops the organic additions to the soil, weakening aggregates. In soils subject to sodification (n soils in the FCC system), large amounts of sodium (Na+) ions can cause aggregate destruction by flocculation. The bottom of Fig. 6.5 shows the effects of the aggregate destruction processes.
6.3.3 Influence of the Three Core Factors
Texture, mineralogy and SOM determine soil aggregation. In sandy and loamy sand textures (< 15 percent clay), the primary particles tend to remain single-grained because the large macropores between them make microorganisms rapidly respire away organic inputs as carbon dioxide, instead of decomposing them slowly to form SOM that binds the primary particles into aggregates. It takes at least loamy (15–35 percent clay) and clayey textures (> 35 percent clay) to make aggregates. The choice of texture as the highest category of the FCC system (Chapter 5) indicates the importance of this core factor, not only in physical properties but in chemical and biological ones as well.
Clay minerals are also a determinant of the strength of aggregation in loamy and clayey textures. Soils with variable-charge clays (1:1 clay minerals, iron and aluminum oxides, i soils and allophane in volcanic soils (x soils in the FCC system) form tight bonds with primary particles and SOM, which give a strong structure to Oxisols and Andisols. A review by Six et al. (Reference Six, Feller, Denef, Ogle, Sá and Albrecht2002c) found higher aggregate stability in those soils than in soils with permanent charge dominated by 2:1 clay minerals.
SOM plays a major role in aggregation. It is an excellent binding agent with primary particles as well as with iron and aluminum oxides in variable-charge clay minerals. Soils dominated by such minerals show stronger aggregation at lower SOM levels than soils with permanent-charge minerals (Denef et al. Reference Denef, Six, Merckx and Paustian2002). Six et al. (Reference Six, Feller, Denef, Ogle, Sá and Albrecht2002c) found that a decrease in SOM contents results in a smaller decrease of aggregate stability in soils with variable-charge clays than in those with permanent-charge clays.
What is considered a good structure depends on the desired speed with which air and water move through the soil. A good structure for growing flooded rice is that attained by puddling (the destruction of aggregates), to eliminate downward water movement (Sanchez Reference Sanchez1973). For other tropical systems, a good structure is one which maintains aggregate stability upon abrupt changes of soil moisture and intense rainfall (Pereira Reference Pereira1956).
Soil pores are where the action is in terms of air and water dynamics, as well as biological activity. While originally measured indirectly, it is now possible to quantify the soil pores directly, including pore connectivity and tortuosity, through non-destructive image analysis techniques (Moran and McBratney Reference Moran and McBratney1992). For example, Pires (Reference Pires2009) provided insights of the spatial arrangement of Oxisol pores in response to compaction.
6.3.4 Measuring Soil Structure
There is no single parameter that adequately measures soil structure, although water-stable aggregate stability is often used in the laboratory (Pereira Reference Pereira1956, Six et al. Reference 175Six, Elliott and Paustian2000a, Reference Six, Paustian, Elliott and Combrinkb), and is qualitatively estimated in the SoilDoc field kit (Weil Reference Weil2011). Pretreatment of soil, previous water content and differences in sand size distribution among soils can confound interpretation of these measurements.
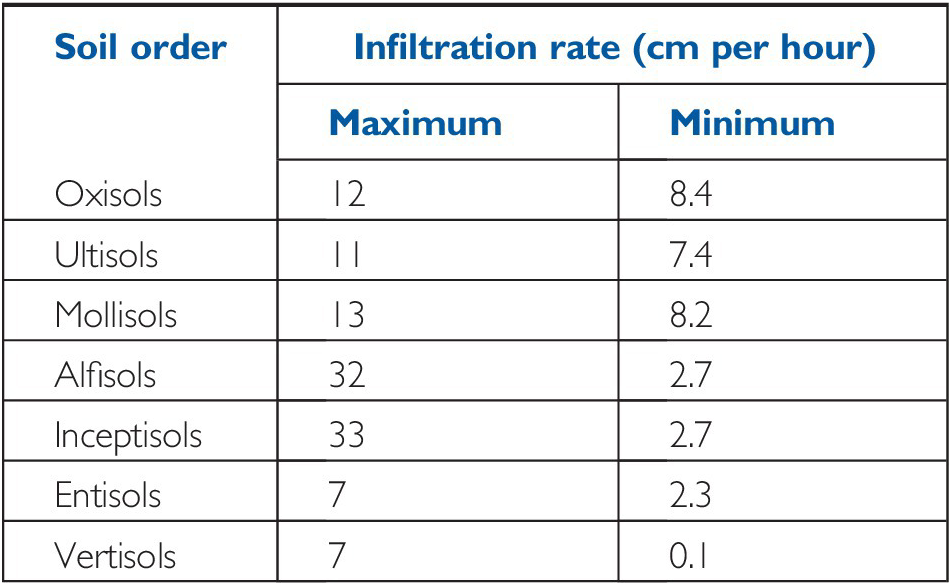
Field tests using double-ring infiltrometers, when adequately replicated, are perhaps the most pragmatic means of evaluating soil structure, by estimating saturated hydraulic conductivity. Field infiltration measurements integrate many of the physical variables and provide a soil volume large enough to reduce the variability caused by insect and root channels. Lugo-López et al. (Reference Lugo-López, Juárez and Bonnett1968) applied this technique to 749 soils in Puerto Rico and found that infiltration rates during the first 3 hours depended on the initial soil moisture content. After the fourth hour, infiltration rates became constant and approximated the saturated hydraulic conductivity. A summary of their results by soil order appears in Table 6.1. The high maximum and minimum infiltration rates of Oxisols, Ultisols and Mollisols reflect their good structure, the very high maximum values in Alfisols and Inceptisols probably reflect sandy topsoil texture, and the low range of Vertisols indicates their high content of expanding 2:1 clays. It is important to note the wide range of infiltration rates within soil orders, which indicates that generalizing at the order level tells you only that Vertisols have lower infiltration rates than Oxisols, Ultisols and Mollisols.
Table 6.1 Ranges in infiltration rates of Puerto Rican soils, grouped by soil orders (57 soil types and 749 tests). Measured after 4 hours, equivalent to their saturated hydraulic conductivity (Lugo-López et al. Reference Lugo-López, Juárez and Bonnett1968).
| Soil order | Infiltration rate (cm per hour) | |
|---|---|---|
| Maximum | Minimum | |
| Oxisols | 12 | 8.4 |
| Ultisols | 11 | 7.4 |
| Mollisols | 13 | 8.2 |
| Alfisols | 32 | 2.7 |
| Inceptisols | 33 | 2.7 |
| Entisols | 7 | 2.3 |
| Vertisols | 7 | 0.1 |
6.3.5 Structure of Major Soils of the Tropics
Taking the idea of core soil properties (texture, mineralogy, SOM), I use examples from some of the most extensive tropical soils to describe the range in soil dynamics commonly found in the tropics.
Oxisols, and oxidic or rhodic groups and subgroups of Ultisols and Alfisols (Nitisols in the World Reference Base (WRB) system), generally possess excellent and strong granular structure. These are the Ci soils in the FCC system. Many Oxisols can be plowed a day after heavy rain with little aggregate disruption.
The excellent structure of Ci soils is caused by primary particles aggregated into very stable, sand-sized macroaggregates (shown in brown in Table 6.2). Their stability is due to their high clay content and coatings of amorphous iron oxides. Soil-organic-matter content is also correlated with aggregate stability in Oxisols, as it plays a cementing role between clay particles. When estimating soil texture by hand, clayey Oxisols initially feel like sandy loams. As one continues to work the moistened soil with one’s fingers, it gradually feels more clayey as the macroaggregates are progressively destroyed.
Table 6.2 Thin sections of soils with contrasting physical properties. Thin sections from Eswaran and Drees (Reference Eswaran and Drees2002) and Stanley Buol (personal communication, 2016).

When Oxisols are subjected to particle size analysis without pretreatment with sodium dithionate to remove free iron oxides, the clay contents read lower than when iron oxides are removed. In an example given by Moura and Buol (Reference Moura and Buol1972), the clay content of a Eutrustox increased from 40 percent to 83 percent when iron oxides were removed. The actual clay content of such Oxisols can be estimated by multiplying the water content at –1500 kPa by a factor of 2.5 (Soil Survey Staff 1970). This is a classic pedotransfer function.
The above generalizations apply to other soils carrying the Ci designation, mainly oxidic and rhodic groups and subgroups of Alfisols (Nitisols), including well-known ones like Terra Roxa Estruturada in Brazil and Kikuyu Red Loam in Kenya.
These generalizations do not hold throughout the Oxisol order. Uehara et al. (Reference Uehara, Flach and Sherman1962) observed different structural characteristics in Oxisols of similar clay contents, and mineralogical composition (primarily kaolinite and amorphous iron and aluminum oxides). Differences in aggregate stability could not be correlated with free iron oxide contents beyond the 5 percent level. Cagauan and Uehara (Reference Cagauan and Uehara1965) then determined that these differences were associated with the degree of anisotropy (clay orientation) inside the aggregates. A more oriented system of kaolinite particles cemented or coated with iron oxides provides stronger aggregates than a less oriented arrangement. The greatest degree of anisotropy has been found in ustic soil moisture regimes.
Oxisols in udic regimes exhibit less clay orientation, as is found in the well-researched Latossolo Amarelo, textura muito pesada (Yellow Latosol, very heavy texture, Acrudox), with over 80 percent clay throughout the profile, and which covers extensive areas of the Brazilian humid tropics, north of the Amazon River, and the Congo rainforest in southern Cameroon. They do not show granular structure (Chauvel et al. Reference Chauvel, Grimaldi and Tessier1991). Soils in continuously humid climates do not retain as strong a structure as those with marked seasonal moisture fluctuations (Denef et al. Reference Denef, Six, Merckx and Paustian2002).
Consequently, clay and SOM content, free iron oxides and the orientation of kaolinite within the aggregates are the main factors associated with the excellent structure of Oxisols, but the degree of manifestation of this structure varies.
Ultisols and Alfisols have less desirable structural properties because of a generally sandier texture in the A horizon. Clay skins, formed by clay migration from the A horizon, coat aggregates in the argillic B horizon. They are anisotropic and provide increased aggregate stability in the subsoil. Briones and Veracion (Reference Briones and Veracion1965), working with Philippine “red” soils (Alfisols and Ultisols), found that the aggregate stability of these soils increased linearly with clay content up to about 50 percent clay. This is shown in Fig. 6.6.
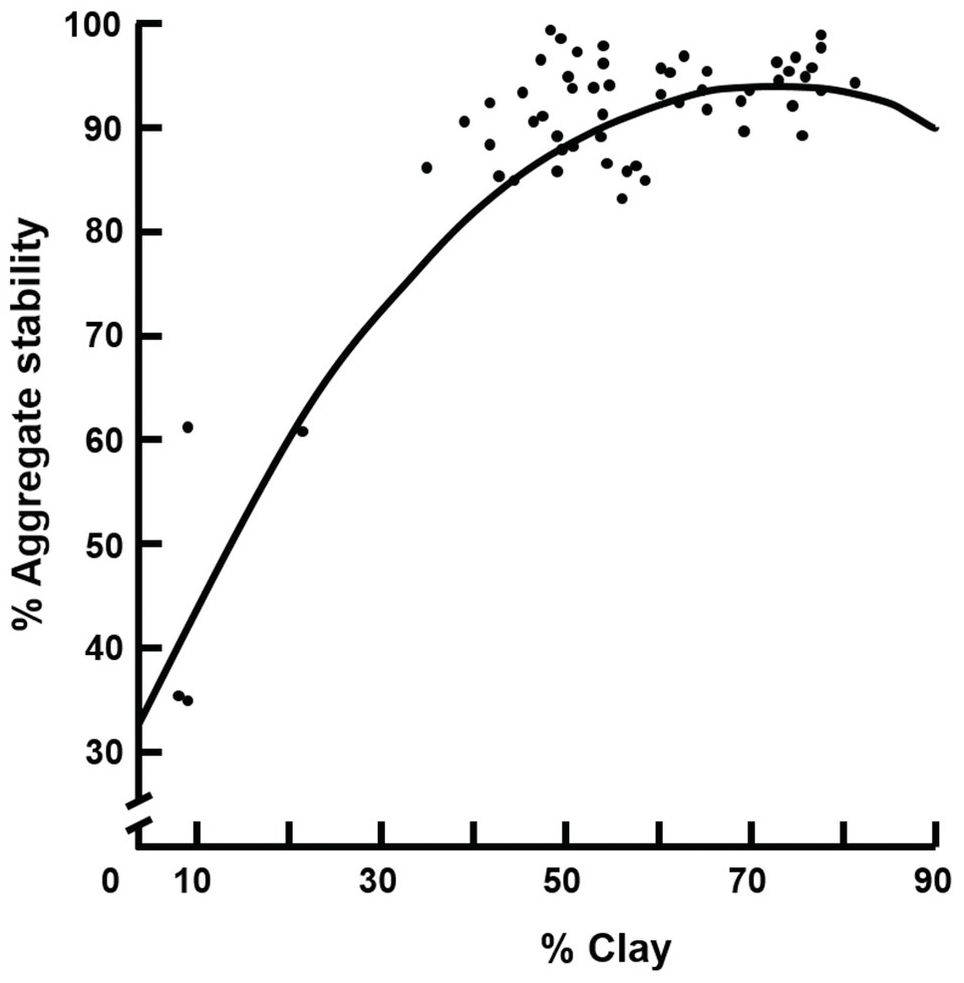
Fig. 6.6 Aggregate stability increases with clay content in “red” soils (Alfisols, Ultisols) in Luzon, Philippines (Briones and Veracion Reference Briones and Veracion1965).
The coarser-textured topsoils of Ultisols and Alfisols have lower aggregate stability than Oxisols, partly due to the differences between the sandy or loamy topsoils and the loamy or clayey argillic horizons, shown in the thin sections of Table 6.2. Alfisols with gravelly topsoils or with shallow subsoil depths are common in West Africa and parts of southern Africa (Kayombo and Lal Reference Kayombo and Lal1993). These gravelly horizons have poor structure, low water-holding capacity and excessively high soil temperatures, which can have a negative effect on root development and crop yield (Lal Reference Lal1975). Soils with more than 10 percent gravel (2–25 cm in diameter) in the top 50 cm cover 145 million hectares or 3 percent of the tropics (Chapter 5).
Structurally inert soils (not shown in Table 6.2) have topsoils low in SOM, but with sufficient fine-sand and silt content (about 10–20 percent) that can bind larger sand and gravel particles, and behave very differently from other Alfisols. They are widespread in semiarid regions of the Sahel, southern Africa and Australia and are termed structurally inert by Lal (Reference Lal, Lal, Sanchez and Cummings1986). These soils are treated separately from the more conventional sandy Alfisols and Ultisols of the humid and subhumid tropics, and are identified as z soils in the FCC system (Chapter 5).
Andisols also have extremely stable soil structure. The x attribute in the FCC system identifies such soils. The high SOM content of Andisols is intimately associated with allophane and imogolite, the main amorphous mineral species, providing strong aggregation. The macroaggregates in Andisols are somewhat larger than those in Oxisols, but their stability is similar. A study of 18 volcanic soils from Pasto, Colombia showed that 81 percent of the water-stable aggregates were greater than 2000 µm in diameter – very large macroaggregates (Escobar et al. Reference Escobar, Jurado and Guerrero1972).
Andisols usually have very low bulk density (0.4 to 0.8 t/m3) because of their mineralogy, high SOM content and high porosity (see thin section in Table 6.2). The absence or near absence of layered silicate minerals in many of these soils makes them difficult to disperse because of the strong bonding between allophane and organic matter. Attempts to estimate clay content by multiplying the –1500 kPa water content by 2.5 failed in these Andisols.
A few volcanic soils are essentially devoid of crystalline materials, such as the Hydrudands of Hawaii. They have thixotropic properties: upon force, the soil suddenly becomes fluid (Swindale Reference Swindale1964). In most Andisols, however, thixotropy does not occur.
The structural properties of other tropical soils, dominated by permanent-charge clays – Vertisols, Mollisols, Aridisols – are different from those observed in most of the previously mentioned soils and more typical of temperate-region soils. In such soils, increased anisotropy means lower aggregate stability, because little or no iron coats are present.
Vertisols and vertic subgroups (v soils in the FCC system) have poor aggregate stability, which is associated with low soil-organic-matter content and expanding, smectitic clays (Lugo-López and Juarez Reference Lugo-López and Juárez1959, Lugo-López and Pérez-Escolar Reference Lugo-López and Pérez-Escolar1969). Vertisols can be tilled adequately at a much narrower moisture range than other soils. When they are dry, shrinkage and cracking breaks the topsoil into massive clods of such strength as to make most tillage practices difficult (see thin section in Table 6.2). When wet, they are soft and sticky. One can certainly feel differences in clay mineralogy by driving on unpaved roads of “red” kaolinitic soils (Alfisols, Oxisols) and on “black cotton soils” (Vertisols) in Africa, often getting stuck in the Vertisols.
Aridisols have a notoriously weak structure. Because of their low SOM content and predominantly 2:1 mineralogy, aggregates easily fall apart when wetted. Those high in sodium saturation (n soils in the FCC system) disperse readily. Free carbonates and bicarbonates of calcareous soils (b soils) bind soil aggregates less strongly than SOM and iron and aluminum oxides.
In contrast, Mollisols have a good structure due to their high SOM content in both the A and B horizons.
The physical behavior of Entisols and Inceptisols cannot be generalized at the order level.
6.3.6 Changes with Tillage
Soil structure often changes with tillage. The degree of structural change varies with the core soil properties (texture, mineralogy, SOM), and with management.
The effects of intense cultivation on the size distribution of water-stable aggregates were determined by Grohmann (Reference Grohman1960) in an Oxisol and an Ultisol from Brazil. The results in Table 6.3 indicate that cultivation reduced the percentage of macroaggregates larger than 2000 µm by about half in both soils, which were converted into smaller macroaggregates (210–2000 µm). But the percentage of microaggregates (< 210 µm in this example) did not increase in the Oxisol, while it increased drastically in the Ultisol, with a less strong structure. These microaggregates can clog the macropores between the larger aggregates and decrease infiltration.
Table 6.3 Effect of cultivation in an Oxisol and Ultisol from Brazil on wet-sieved aggregate size distribution without pretreatment. Adapted from Grohmann (Reference Grohman1960).
| Aggregate size range | Oxisol (Terra Roxa Legítima) | Ultisol (Massapé) | ||
|---|---|---|---|---|
| Forest | Cultivated | Pasture | Cultivated | |
| (µm) | Water-stable aggregates (%) | |||
| > 2000 | 84.2 | 48.2 | 80.8 | 36.0 |
| 2000–210 | 2.1 | 41.3 | 15.3 | 30.2 |
| < 210 | 13.7 | 10.5 | 3.9 | 33.8 |
Moura and Buol (Reference Moura and Buol1972) compared the effects of 15 years of annual cropping in a Eutrustox and observed that infiltration rates decreased from 82 cm/h to 12 cm/h (Table 6.4). The decrease in infiltration was due to a sharp decrease in macropores (> 50 µm) in both the A and B horizons, whereas the micropores (< 50 µm) remained essentially unchanged. Compaction by machinery was the cause of the decreased macroporosity. Moura and Buol also observed that water-dispersible clay contents decreased in the A horizon with cultivation but increased in the B horizon. Some clay translocation took place and this reduced macroporosity. The observed drop in infiltration rate, however, could be considered beneficial because of reduced percolation and potential leaching.
Table 6.4 Fifteen years of conventionally tilled cropping decreased infiltration and macroporosity, but not microporosity, in a Eutrustox of Minas Gerais, Brazil (Moura and Buol Reference Moura and Buol1972).
| Soil property | Recently cleared | Annual cropping for 15 years |
|---|---|---|
| Infiltration rate (cm/h) | 82 | 12 |
| A horizon: | ||
| Percentage of macropores (> 50 µm) | 25 | 11 |
| Percentage of micropores (< 50 µm) | 33 | 32 |
| Percentage of water- dispersible clay | 13 | 7 |
| B horizon: | ||
| Percentage of macropores (> 50 µm) | 34 | 13 |
| Percentage of micropores (< 50 µm) | 30 | 33 |
| Percentage of water-dispersible clay | 1 | 7 |
One aspect that is seldom considered is that mineral fertilizer applications, when properly managed, generally improve soil aggregation, in comparison to unfertilized soils (Subbian et al. Reference Subbian, Lal and Akala2000, Hamza and Anderson Reference Hamza and Anderson2005). When crops are well nourished, they have higher root volume, protect the soil from erosion with their crop canopy, and provide more fresh organic inputs and then SOM through root decomposition and incorporation of crop residues.
6.4 Soil Compaction
Soil compaction is the increase in bulk density expressed in tons of soil per cubic meter and the accompanying decrease in pore space, resulting from the application of pressure to the soil by farm machinery, livestock trampling, raindrop impact and other means in sufficient amounts to overcome soil strength. The force applied per unit area varies as shown in Table 6.5 and is not directly a function of the weight of the compacting agent. Human feet and cattle hooves exert more pressure than many machines, which is why there can be severe soil compaction along cattle trails between tussock-type grasses, and particularly around watering points. The same occurs with wild antelopes, which exert more force than the much larger elephants, because of their thin hooves in comparison with the much broader elephant feet. Bulldozers exert less force than wheeled tractors, because their weight is distributed along the tracks. Zero-tillage planters, because of their weight, often exert greater force on the soil while injecting seed and fertilizer in slits than tractors pulling conventional planters.
Table 6.5 Pressures exerted by different soil compacting agents
| Agent (weight) | Pressure exerted (kPa) | Reference |
|---|---|---|
| Animals: | ||
| Human (70 kg) | 557 | Alegre and Cassel (Reference Alegre and Cassel1996) |
| Goat/sheep (42 kg) | 278 | Cumming and Cumming (Reference Cumming and Cumming2003) |
| Cattle (300 kg) | 353 | Cumming and Cumming (Reference Cumming and Cumming2003) |
| Wildebeest (180 kg) | 568 | Cumming and Cumming (Reference Cumming and Cumming2003) |
| Elephant (2.2 t) | 223 | Cumming and Cumming (Reference Cumming and Cumming2003) |
| Machinery: | ||
| Small tractor | 49 | Alegre and Cassel (Reference Alegre and Keith Cassel1999) |
| Zero-tillage planter | 157 | Alegre and Cassel (Reference Alegre and Keith Cassel1999) |
| Wheeled vehicle (4–10 t) | 200–400 | Soane (Reference Soane, Lal, Sanchez and Cummings1986) |
| Tracked vehicle (4–10 t) | 25–40 | Soane (Reference Soane, Lal, Sanchez and Cummings1986) |
| Bulldozer (20 t) | 376 | Alegre and Cassel (Reference Alegre and Cassel1996) |
Soil strength (load-bearing capacity) involves the soil’s resistance to cohesive and frictional forces. Cohesive forces break the bonds between soil particles, while frictional forces make soil particles slide over each other (McKenzie et al. Reference McKenzie, Coughland and Cresswell2002). Soil strength is highest when soils are dry, and rapidly decreases with increasing soil moisture content. Soil strength also depends on the three core soil properties. The strongest soils are clayey, with kaolinitic–oxidic mineralogy, and high in SOM. Soil strength is usually measured as resistance to cone penetrometers (Alegre et al. Reference Alegre, Cassel and Bandy1986).
Cattle trampling around watering holes in semiarid areas is a major contributing factor to soil degradation. In his detailed study in a sandy–silty Entisol of Northeast Nigeria, Usman (Reference Usman1994) quantified that trampling increased bulk density and resistance to cone penetrometers, created a dense layer at 6–8 cm depth, decreased porosity from 32 percent to 16 percent and decreased infiltration by over 90 percent. In better-aggregated loamy Alfisols of southern Brazil, compaction by trampling was avoided because of the maintenance of a pasture cover over the soil (Silva et al. Reference Silva, Reinert and Reichert2000).
In terms of the depth of soil affected, there are three main forms of soil compaction: surface sealing and crusting, hardsetting and plow-pan formation.
6.4.1 Surface Sealing and Crusting
Soil surface sealing or crusting is a major management problem that has received considerable attention in semiarid West Africa (Fig. 6.7), southern Africa and Australia. Surface sealing occurs when the soil is wet, while crusting refers to seals that have dried and hardened (Roth Reference Roth, Summer and Stewart1992). The sealed layer at the soil surface is about 5 mm thick (Fig. 6.8).
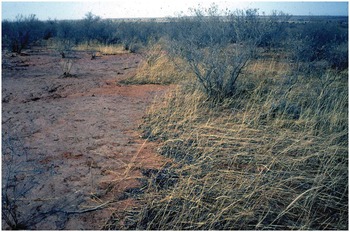
Fig. 6.7 Surface sealed sandy Alfisol in Burkina Faso.
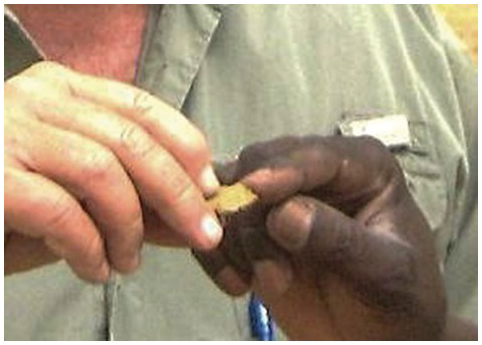
Fig. 6.8 A thin, sealed layer of about 5 mm from the surface of a structurally inert sandy Alfisol of Segou, Mali.
Surface sealing is most acute in structurally inert Alfisols. Surface sealing does not occur in loamy sands and pure sands because these soils are single-grained – there is nothing to compact. It seldom occurs in Oxisols and Andisols because of their strong granular structure, nor in smectitic silty and clayey Aridisols and Vertisols. Again, the three core factors, texture, SOM and mineralogy, play a determinant role in this process.
Surface sealing prevents seedling emergence, sharply reduces infiltration, decreases water storage in the soil and triggers runoff, and hence erosion. Unlike other kinds of soil compaction, surface sealing is largely due to raindrop impact.
Valentin and Bresson (Reference Valentin and Bresson1992) recognized three types of crusts, structural, erosional and depositional, in the Sahel. They are formed in sequence. Structural crusts begin to develop during the first minutes after high-intensity rains hit a dry topsoil. Erosional crusts consist of an exposed silt–clay layer after the removal of sandy particles by wind or runoff. Depositional crusts are formed by translocation of clay particles and their subsequent deposition away from the original location.
Mineralogy plays a major role in defining crust formation. In topsoils with smectitic clay mineralogy, structural crusts mainly result from aggregate breakdown. They are caused by entrapped air compression when a dry soil is suddenly and thoroughly wetted. The advancing water compresses air in the soil pores until small air explosions occur, causing the breakdown of macroaggregates into primary particles (Yoder Reference Yoder1936). This process is called slaking, and occurs in aggregates that are not strongly bound by iron and aluminum oxides or by SOM.
Valentin and Bresson (Reference Valentin and Bresson1992) described a swelling crust, commonly observed in tilled arid loamy soils with smectitic clay mineralogy. Upon wetting, clay lattices expand and fill the interstices between cracks. This process can trigger runoff within a few minutes of rainfall. The swelling process then combines with the rapid slaking of aggregates, creating a crust. Upon drying, the crusts crack and curl. They are often photographed as the effects of global warming on increasing droughts, which is usually unrelated.
In the structurally inert Alfisols, structural crusts are made of a layer of loose sand and gravel-sized grains, overlaying a layer of finer material. They develop primarily as a result of raindrop impact, which forms microcraters, the walls of which present a clear, vertical sorting of particles. A lack of smectitic mineralogy prevents slaking and swelling (Valentin and Bresson Reference Valentin and Bresson1992). Such crusts are common in the Sahel.
Erosional crusts consist of one rigid, thin and smooth surface layer, rich in fine particles, a result of the destruction of structural crusts. Voids are generally restricted to some cracks and vesicles, and in arid environments they are often referred to as “desert pavement.”
Depositional crusts are typically very compact. Separation between fine particles (plasma) and coarse particles (skeleton) induces alternate microbeds. Still, “depositional crusts” form in standing water and develop where surface flow is hindered. In puddles, the larger grains sink rapidly and form the bottom layer, whereas the finer grains deposit more slowly and form the top layer (Valentin and Bresson Reference Valentin and Bresson1992).
The presence of algae and fungi strengthens both erosional and depositional crusts. Particularly under schlerophyllic (cactus-type) vegetation, they become hydrophobic or water-repellent (McKenzie et al. Reference McKenzie, Coughland and Cresswell2002).
Surface sealing has a devastating effect on the hydrology of the Sahel. It was amazing to see, at the beginning of the rainy season when the soils are surface-sealed, a 5-cm layer of water flowing on flat terrain and eventually emptying into the Niger River, with minimal infiltration (Fig. 6.9). Not only is rainfall marginal in the Sahel, but also much of it does not get inside the soil.
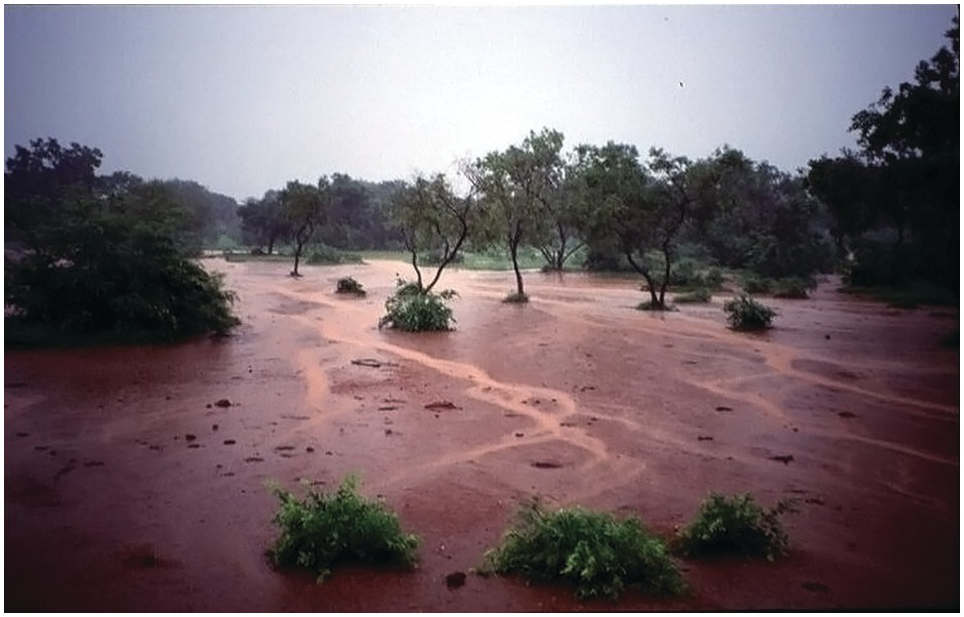
Fig. 6.9 Runoff flowing on a level, surface-sealed Alfisol near Niamey, Niger.
After some dry weather, farmers plow with cattle and break the crust, allowing water to infiltrate. In the meantime, much of the rains that were supposed to replenish moisture in the soil profile are lost. A feasible partial solution is live fences with leguminous shrubs such as Ziziphus mauritiana, and some Acacia species that can survive the 9-month dry season and prevent surface sealing by providing a leaf canopy under which the soil remains porous and runoff water infiltrates, replenishing some of the field subsoil moisture. In addition, these live fences attenuate wind and water erosion, fix nitrogen, produce high-value fruits, in the case of Ziziphus, and replace dead fences made from sorghum or millet stems (see Chapter 19).
Surface crusts can be reversed when vegetation and soil fauna recolonize crusted areas (McKenzie et al. Reference McKenzie, Coughland and Cresswell2002). Simply leaving twigs or straw on the soil attracts termites in the Sahel, where the resulting “biological tillage” breaks the surface seal (John Wendt, personal communication, 1980). But the need to use every bit of biomass for fuel and animal feed in semiarid areas prevents this from becoming a realistic intervention, at scale. Therefore, sealed surfaces have to be broken with tillage, be it biological tillage via termites or mechanical tillage by plowing. But they return after the next rain.
6.4.2 Hardsetting
Another form of soil compaction, unrelated to surface sealing or the application of force to the soil surface, is hardsetting. It occurs when much of the entire soil becomes so hard as it dries that it is virtually impossible to cultivate until it is rewetted (Mullins et al. Reference Mullins, MacLeod, Northcote, Tisdall and Young1992). Hardsetting in a cultivated soil usually involves destruction of soil aggregates during wetting, and an increase in bulk density and soil strength in subsequent drying. Hardsetting happens without the application of an external force, making this process a unique form of natural soil compaction.
Hardsetting occurs in soils with little or no water-stable aggregates, in textures ranging from loamy sands to clay loams, with kaolinitic or hydrous mica mineralogy and low SOM content. When thoroughly wetted, such soils lose their structure by the slaking process described previously, and a subsequent slumping of dispersed soil particles. As the soil dries, the whole profile hardens from the surface downwards, reaching extremely high bulk densities (1.8 t/m3) and soil strength in the top meter (Mullins et al. Reference Mullins, MacLeod, Northcote, Tisdall and Young1992). Figure 6.10 shows how difficult it is to auger a hardset, sandy Alfisol during the dry season. When a hardset soil is wetted again by rainfall or irrigation, it loses soil strength and decreases its bulk density.

Hardsetting occurs in large areas of the semiarid tropics with ustic soil moisture regimes. Hardsetting occurs (again) in sandy soils with a high fine-sand and silt content, low SOM and kaolinitic clay mineralogy. It also occurs in Alfisols, Entisols and Inceptisols of the Sahel, Botswana and Australia (Nicou and Charreau Reference Nicou and Charreau1980, Peltier Reference Peltier1993, McKenzie et al. Reference McKenzie, Coughland and Cresswell2002) in soils that have no water-stable aggregates. Hardsetting is common in “duplex” soils of Australia (Natraqualfs), where only the A horizon hardsets, aided by high sodium saturation (n soils in the FCC system). Hardsetting does not happen when smectitic clays are present because they shrink and swell with changes in moisture. It also does not happen in coarse sands (Quartzipsamments) because they have no structure as such, nor in Oxisols, Andisols and Mollisols, which have mostly water-stable aggregates. Such soils and many Entisols and Inceptisols with water-stable aggregates remain friable when dry. Hardsetting does not happen in udic soil moisture regimes.
Management practices that minimize soil disturbance and add crop residues can prevent hardsetting. Mullins et al. (Reference Mullins, Young and Bengough1987, Reference Mullins, MacLeod, Northcote, Tisdall and Young1992) report that some maize farmers near Kabwe, Zambia incorporate chopped cereal stalks into the topsoil, which prevents hardsetting. When there is a short rainy season in Botswana, farmers delay planting, having to wait until the first rains have sufficiently softened the soil, which can diminish yields (Willcocks Reference Willcocks1981).
6.4.3 Plow Pans
Tillage and farm machinery traffic can also induce subsoil compaction in the form of a plow pan. The depth of the pan varies from 10 cm to 60 cm and is usually several centimeters thick. Plow pans can develop in most tropical soils except Vertisols, where shrinking and swelling through the profile prevents their formation.
Although Oxisols in subhumid savannas (Ustox) are the strongest-structured tropical soils, excessive tillage can produce plow pans that lead to classic land degradation symptoms. The Brazilian Cerrado was opened with heavy disk harrows, used to incorporate lime to a depth of at least 30 cm, as an effective way to eliminate aluminum toxicity and allow for crop root development to that depth (González-Erico et al. Reference Gonzalez-Erico, Kamprath, Naderman and Soares1979). Due to the large farm size, the disk harrows used became larger, and after a few years a plow pan developed at a depth of 12–15 cm, where water-dispersible clays have moved to from the harrowed topsoil (Lopes and Daher Reference Lopes and Daher2008). They are locally called pé de grade (foot of the harrow). Movement of water-dispersible clays, a product of partial aggregate breakdown, helps form these plow pans.
Plow pans form at a depth of 15–20 cm in loamy and clayey Alfisols and Ultisols of the African savanna, and in semiarid regions with intensively mechanized cultivation, resulting in restricted infiltration and root penetration, and lowered grain yields. The situation is worse with 25-cm-deep moldboard plowing (Kayombo and Lal Reference Kayombo and Lal1993).
6.4.4 Managing Soil Compaction
Perhaps the best management practice with such soils, other than the appropriate tillage, is to prevent compaction, by protecting the soil surface with mulch or plant canopies that decrease the energy of raindrop impact and the rate of SOM decomposition as well. A bare soil is very exposed to surface compaction. Lal (Reference Lal1975) showed that mulching also prevented excessively high soil temperatures, increased soil water storage, decreased weed infestations and inhibited runoff and erosion in loamy textured Alfisols of Nigeria. Evidence from sandy textured Ultisols of the Amazon supports Lal’s findings (Wade and Sanchez Reference Wade and Sanchez1983). In traditional shifting cultivation systems, the soil is never tilled but it is protected with an ash mulch and, later, with a constant crop canopy.
Mulching can prevent surface sealing in most soils. In practice, the only practical mulch is the one that is produced in situ by leaving crop residues on the soil surface. Transporting mulch from outside the fields is expensive, in capital or labor, and only feasible for very small areas, growing high-value crops. Leaving the land fallow so that some grass and tree seedlings establish helps to break crusts down. Valentin et al. (Reference Valentin, Rajot and Mitja2004) found that physical properties were restored after a fallow period of 10 years on a clayey loam soil in Cote d’Ivoire, whilst crusts persist over a longer time on sandy soils.
Consequently, management to minimize or prevent the different kinds of soil compaction varies with the core soil properties. As mentioned previously, sands (Quartzipsamments) have no aggregation and therefore are not subject to compaction. At the opposite end of the soil spectrum, Vertisols with cracking and swelling smectitic clays do require conventional tillage and this must be done during a relatively narrow range of moisture content. Soils that are highly susceptible to surface sealing or hardsetting require tillage every year. In most other soils, minimum or no tillage is feasible and should be the preferred option, both in easily compacted soils as well as the most highly aggregated soils, Oxisols and Andisols. Kondo and Dias Júnior (Reference Kondo and Dias Júnior1999) showed that resistance to compaction increased with increasing clay content in Oxisols. Many loamy Oxisols suffer readily from compaction (by definition, there are no sandy Oxisols).
6.5 Soil Water
6.5.1 Soil Water Retention
Soil water (soil moisture) is divided into three classes according to its potential energy, or soil moisture tension, which is now expressed in negative kilopascals (kPa) and previously in bars (1 bar equals –100 kPa). A saturated soil has zero tension (0 kPa). The first class, gravitational water, is that which is held in the macropores, normally between 0 kPa and –10 to –30 kPa. This tension range is called the “field capacity,” defined as the range at which the downward movement of water ceases. Secondly, the available water to plants resides mainly in the micropores, as films, where most of the nutrient uptake and ion exchange reactions take place. In soil chemistry, we call these films the soil solution. Soil moisture tension increases as the soil dries and the films become thinner. The available water is that which is held between the field capacity and the permanent wilting point (–1500 kPa). Residual water, the third class, is held at tensions lower than –1500 kPa, but it is not relevant to plants (McKenzie et al. Reference McKenzie, Coughland and Cresswell2002). However, some gravitational water is also available to crops, so the term “available water” is often an underestimate.
The differences in structure between broad kinds of tropical soils result in dramatic differences in their water-retention properties. Figure 6.11 shows the classic soil moisture characteristic curve of a sandy soil and two clayey soils, one with oxidic and the other with smectitic mineralogy, and an Andisol with amorphous mineralogy. The sandy soil empties its pores of gravitational water at tensions close to –10 kPa, while the smectitic clay does this at –50 kPa. This is what is traditionally known as field capacity, but the tensions vary from the classic 0 to –30 kPa definition.

Fig. 6.11 Moisture-retention curves of a sandy soil, a clayey Oxisol, a clayey Vertisol and an Andisol.
The moisture-retention pattern of a clayey, well-aggregated Oxisol is a hybrid of these two (Fig. 6.11). These Oxisols hold as much water as smectitic soils, up to approximately –10 kPa, but drain their macropores at about that tension, thus reaching field capacity, as sands do. Oxisols act like sands at low tensions because of their strong, sand-sized macroaggregates, but hold water like smectitic soils at higher tensions. Therefore, they have a narrower available-water range than other clays. The most commonly accepted value for Oxisol field capacity is about –10 kPa (Ruiz et al. Reference Ruiz, Ferreira and Pereira2003).
Many Oxisols have drought problems that are completely out of proportion to their clay contents. The micropores in the microaggregates may be close to saturation, while the macropores between the aggregates are totally depleted of available moisture to crops. These unique properties are due to the aggregate size distribution. Figure 6.12 shows that the rapid drainage at soil moisture tensions between –1 kPa and –10 kPa is due to the predominance of sand-sized water-stable aggregates (2 mm) in these soils. At moisture tensions greater than –20 kPa, the aggregate size is irrelevant because it is the micropores within the aggregates that are being drained.
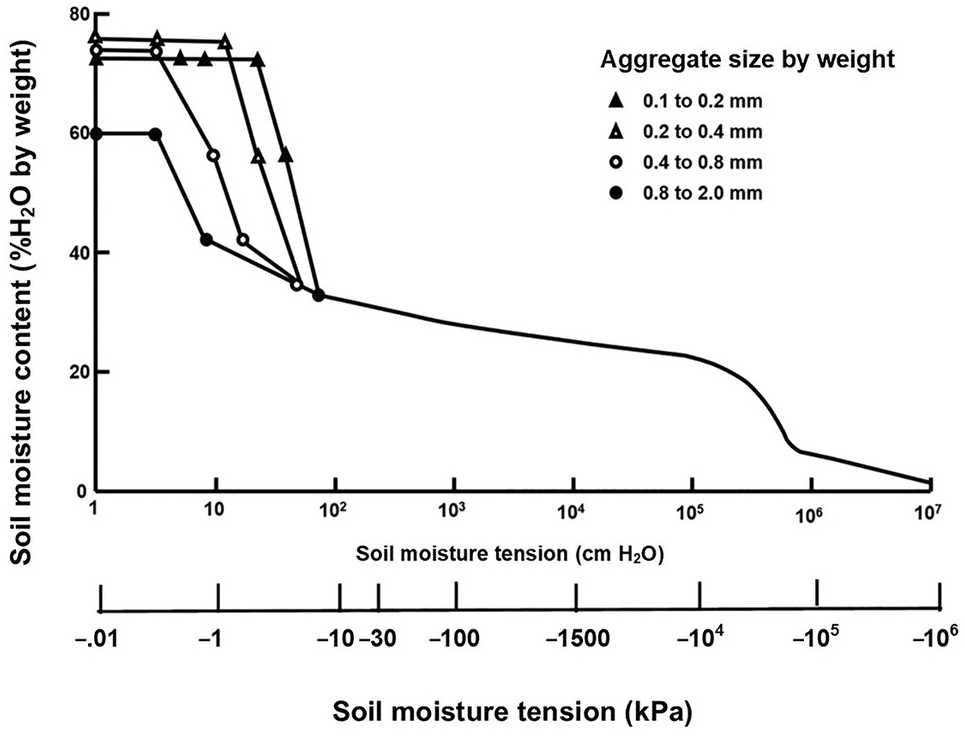
Fig. 6.12 Soil-moisture retention curves of different aggregate fractions of an Oxisol (Sharma and Uehara Reference Sharma and Uehara1968).
Andisols also possess unique water-retention characteristics. They hold considerably more water at lower tensions than other soils because of the high macroporosity and low bulk density of their aggregates. If the water content is calculated on a weight basis, the figures may range from 100 percent to 300 percent water. If calculated volumetrically (the correct way), their moisture contents may run as high as 84 percent water at –30 kPa field capacity and 45 percent water at the wilting point, –1500 kPa. Andisols, therefore, hold more water at a given tension than most other soils, as shown in Fig. 6.11 Although the quick attainment of field capacity is due to the drainage of large pores between very stable microaggregates, the high microporosity inside these aggregates accounts for their particular water-holding capacity (Forsythe and Diaz-Romeu Reference Forsythe and Diaz-Romeu1969, Swindale Reference Swindale1969). Andisols generally have more water available to plants than Oxisols because organic matter–allophane microaggregates are more porous than kaolinite–iron oxide microaggregates.
Ultisols and Alfisols with oxide coatings on kaolinitic clays seem to have better moisture-retention properties than Oxisols in general. The large areas of tropical soils with conventional 1:1 and 2:1 layer-silicate mineralogy have moisture-retention curves similar to those presented in standard textbooks.
6.5.2 Water-Holding Capacity
The definition of available water as the difference in volumetric water (percent water by volume) held at field capacity (–30 kPa) and that at the permanent wilting point (–1500 kPa) is still widely used. The original work of Briggs and Shantz (Reference Briggs and Shantz1914), using one plant (sunflower) and one loamy soil, has become a general principle. There are important limitations to this principle, both conceptually and quantitatively. Available water is not uniformly available in soils; roots do not extract it uniformly, and the replenishment of water lost by transpiration in soil close to the roots may be slow enough to cause wilting in the presence of ample water. Rice plants may be observed with wilted leaves, growing in a flooded soil on hot sunny days. There are also rather large differences between crops and varieties in their ability to extract water at different soil moisture tensions.
A study with several Oxisols, Vertisols, Inceptisols and Entisols in Zambia, by Maclean and Yager (Reference Maclean and Yager1972), showed that soil moisture tensions between –10 kPa and –20 kPa are better approximations of the actual field capacity than the classic value of –30 kPa. When the available water was calculated as the difference between –30 kPa and –1500 kPa, the result was an underestimation of the available-water range by 35 percent compared with actual field measurements in these soils.
Sharma and Uehara (Reference Sharma and Uehara1968) in Hawaii and Wolf (Reference Wolf, Bornemisza and Alvarado1975) in Puerto Rico have shown little difference in water content between –100 kPa and –1500 kPa. A series of in situ studies on Oxisols and Ultisols in Puerto Rico and Brazil led Wolf (Reference Wolf, Bornemisza and Alvarado1975) to recommend that the available-water range of these soils should be estimated as the difference in water content between –10 kPa and –1500 kPa. Brazilian scientists now consider the available water range in Oxisols to be that held between –6 kPa and –100 kPa (Resck et al. Reference Resck, Ferreira, dos Santos Júnior, da Sá and Figueiredo2008), and the old –30 kPa to –1500 kPa field capacity to wilting point range is no longer applicable to these soils. The field capacity limit has also been lowered from –30 kPa to –10 kPa in Australia, where most soils are not Oxisols (McKenzie et al. Reference McKenzie, Coughland and Cresswell2002).
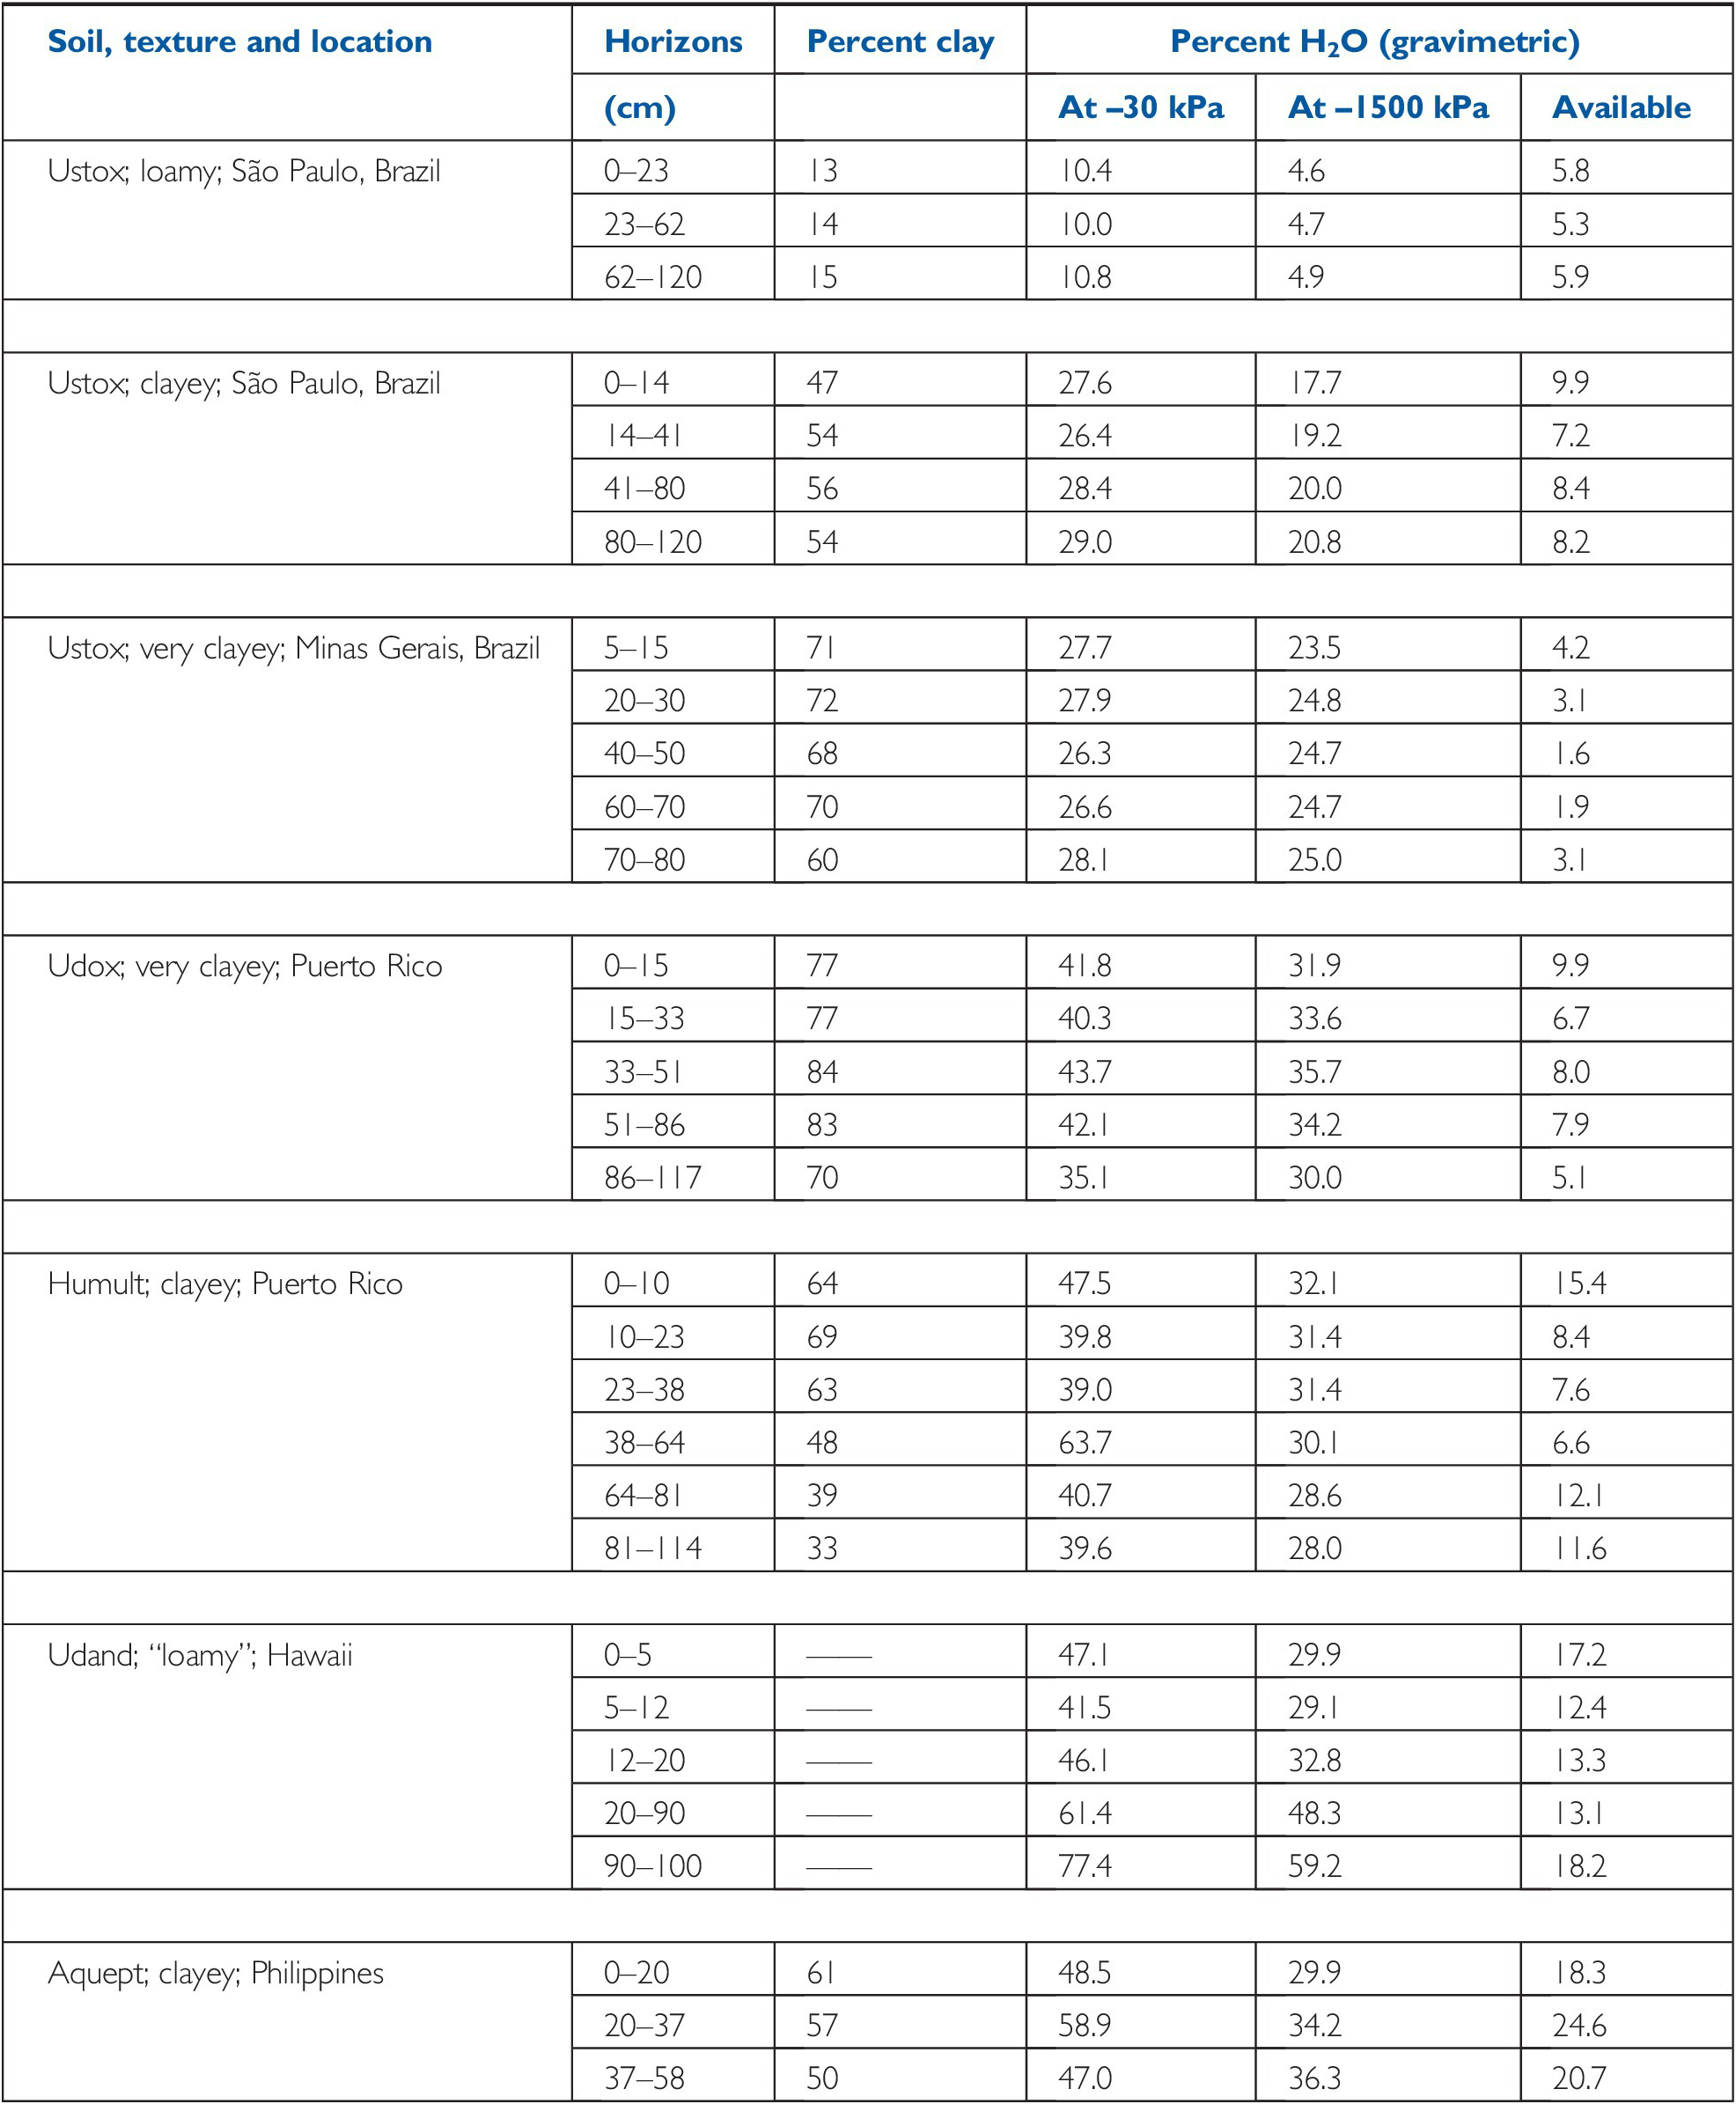
Table 6.6 shows some representative available-water ranges, albeit using the old soil moisture tension limits and expressed gravimetrically. Regardless of texture, the available-water range of Oxisols is low, less than 10 percent. Ultisols generally have higher available-water capacities, Andisols hold much more water, and the two permanent-charge soils (Aquept and Ustert) hold about twice the available soil water than Oxisols.
Table 6.6 Gravimetric available water in some tropical soil profiles at traditional field capacity (–30 kPa) minus the permanent wilting point (–1500 kPa). Adapted from Matthew Drosdoff, Cornell University, unpublished; Wolf and Drosdoff (Reference Wolf and Drosdoff1974); and Wolf (Reference Wolf, Bornemisza and Alvarado1975).
Access to available soil water by plant roots depends on how deep they can grow, and this also depends on management. A 22-year experiment in a Cerrado Oxisol indicates that the available water stored in the top 100 cm ranged from 576 mm to 672 mm (Resck et al. Reference Resck, Ferreira, dos Santos Júnior, da Sá and Figueiredo2008). Maize roots can reach this depth only after lime and gypsum applications that promote calcium leaching into the subsoil. Otherwise, they are limited to the water held in the topsoil (Chapter 9).
Available-water capacity is one of the most important soil properties. Pedotransfer functions have been developed to estimate this capacity using commonly measured physical properties. The functions that seem to fit best for the tropics are those that include texture, mineralogy and SOM. Gaiser et al. (Reference Gaiser, Graef and Cordeiro2000) obtained better predictions when they subdivided soil samples from northeast Brazil and Niger according to whether they had low-activity clays (< 24 cmolc/kg clay) or permanently charged clays of smectitic and mixed mineralogical families. Pedotransfer functions for estimating volumetric available water capacity are based on a direct regression between the soil water content at field capacity minus the soil water content at the permanent wilting point as the dependent variable; and clay, silt and organic carbon as independent variables. Gaiser and co-workers found that pedotransfer functions for the low-activity clay soils differed considerably from those for the high-activity clay soils, with respect to the contribution of total organic carbon and silt content to the prediction of soil water content at field capacity and wilting point. The overall pedotransfer functions for volumetric available-water capacity (AWC) were:
For low-activity clay soils
For high-activity clay soils
Pedotransfer functions have also been developed for other Brazilian soils (Tomasella and Hodnett Reference Tomasella and Hodnett1998, van den Berg et al. Reference van den Berg, Klamtb, van Reeuwijkc and Sombroek1997) with higher clay contents than Gaiser’s data set, which are more typical of clayey Oxisols. All pedotransfer functions have to be locally validated, but the message is that clay mineralogy, texture and SOC have to be considered.
Bulk density is also needed to convert the usual gravimetric water contents to volumetric ones, which is what roots really use. Since bulk density is seldom measured, it may have to be modeled using assumptions.
6.5.3 Leaching
Infiltration in excess of the soil’s available water-holding capacity causes nutrient losses through leaching. Estimates of leaching losses from selected tropical locations are summarized in Table 6.7. The amounts vary considerably with annual rainfall, soil properties and crops grown.
Table 6.7 Magnitude of leaching losses in different tropical soils, data from lysimeters. From Suárez de Castro and Rodriguez (Reference Suárez de Castro and Rodríguez1955, Reference Suárez de Castro and Rodríguez1958) for Colombia, Charreau (Reference Charreau1972) for Côte d’Ivoire and Senegal and Reyes et al. (Reference Reyes, Galvez and Nazareno1961) for the Philippines.
| Soil, location | Cover | Rainfall | Leaching | Nutrients leached (kg/ha per year) | |||||
|---|---|---|---|---|---|---|---|---|---|
| (mm per year) | N | P | K | Ca | Mg | S | |||
| Udand, Colombia | Bare | 2530 | 1771 | 249 | 0.23 | 202 | 776 | 232 | – |
| Pasture | 1450 | 204 | 0.21 | 163 | 878 | 251 | – | ||
| Aqualf, Philippines | Rice flooded, not puddled | 2000 | 1248 | 11 | 0.13 | 60 | 391 | 313 | 89 |
| 312 | 2 | 0.03 | 16 | 78 | 91 | 8 | |||
| Ustalf, Senegal | Cropped | 660 | 118 | 6 | 0.13 | 8 | 31 | 12 | 7 |
| Udult, Côte d’Ivoire | Rubber | 1569 | 845 | 79 | 2.90 | 63 | 31 | 40 | – |
| Banana | 2040 | 828 | 235 | 1.20 | 24 | 256 | 113 | – | |
The Colombian study in Table 6.7 was carried out in highly porous Andisols, high in weatherable minerals, and under high annual rainfall, which produced high losses of nitrates, potassium, calcium and magnesium from leaching (Suárez de Castro and Rodríguez Reference Suárez de Castro and Rodríguez1955, Reference Suárez de Castro and Rodríguez1958). The data from the Philippines was obtained on an older soil, grown with flooded, but not puddled, rice, at two controlled leaching rates (Reyes et al. Reference Reyes, Galvez and Nazareno1961). The low nitrogen values reflect the absence of nitrates under reduced conditions. The differences between the two controlled leaching rates suggests a similar composition of the leachate.
The three West African sites representing older Alfisols and Ultisols were obtained with in situ lysimeters (Charreau Reference Charreau1972). They show progressively higher nutrient losses with increasing annual rainfall. The high leaching losses of nitrogen and potassium in the Côte d’Ivoire soil are probably due to the fertilization of the banana plantation, as compared with the rubber plantation, which was not fertilized.
6.5.4 Runoff
When high-intensity rainfall events exceed the infiltration capacity of soils, or when some soils become surface-sealed, rains often cause considerable runoff (water running over the soil), even on gentle slopes. Table 6.8 shows the average values for annual runoff in four West African locations under forest, cultivation and bare soil conditions. Soil cover is the predominant factor affecting runoff, in spite of differences in slope and annual rainfall. The lower runoff values in cultivated soils than in bare soils underscores the need to keep a constant soil cover.
Table 6.8 Magnitudes of annual soil runoff in four West African sites (Charreau Reference Charreau1972). Soils are Ustalfs in the first three locations and Udults in Abidjan.
| Location | Slope (%) | Annual rainfall (mm) | Annual runoff as percent of annual rainfall | ||
|---|---|---|---|---|---|
| Forest | Cultivated | Bare soil | |||
| Ouagadougou, Burkina Faso | 0.5 | 850 | 2.0 | 0.5 | 40–60 |
| Sefa, Senegal | 2.0 | 1300 | 1.0 | 2.0 | 40 |
| Bouaké, Côte d’Ivoire | 4.0 | 1200 | 0.3 | 4.0 | 15–30 |
| Abidjan, Côte d’Ivoire | 7.0 | 2100 | 0.1 | 7.0 | 38 |
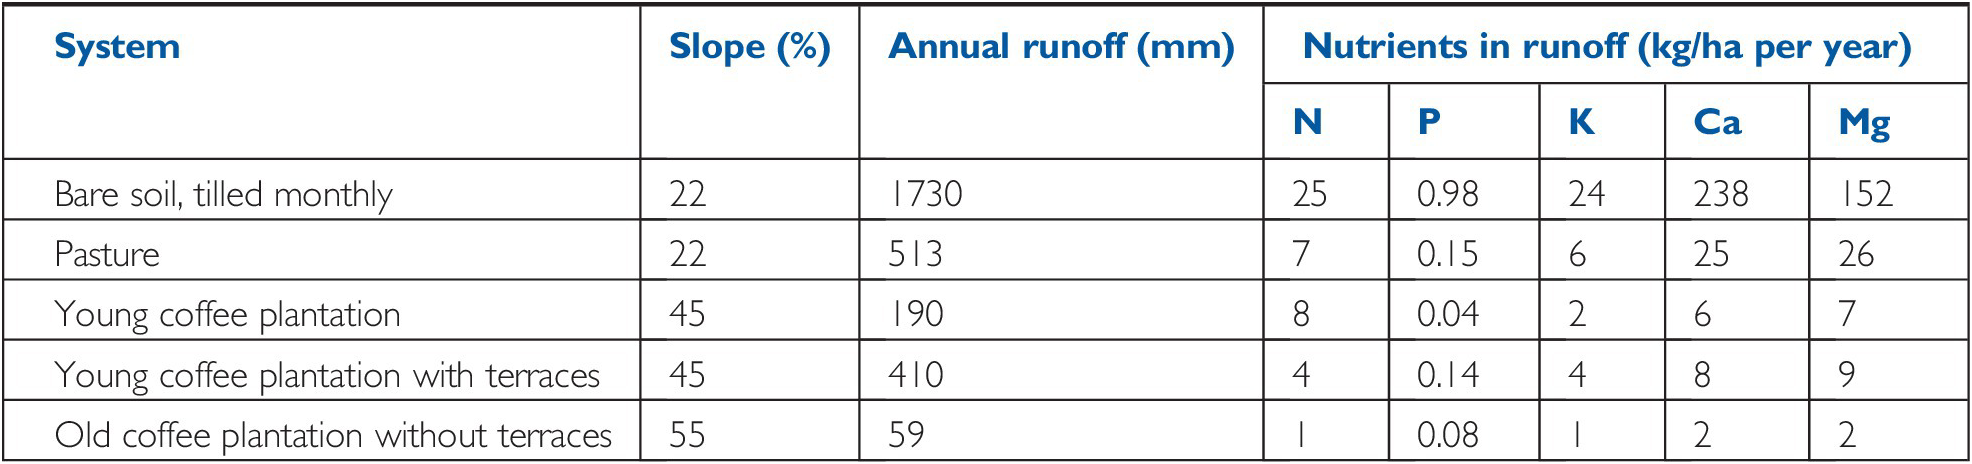
In a well-aggregated Andisol from Chinchiná, Colombia, considerable runoff amounting to 62 percent of the annual rainfall was measured by Suárez de Castro and Rodríguez (Reference Suárez de Castro and Rodríguez1955, Reference Suárez de Castro and Rodríguez1958) on bare soils with slopes of 22 percent. Table 6.9 shows that large quantities of calcium and magnesium were washed away in the process. When pastures or coffee plantations were established, runoff, erosion and leaching losses decreased drastically. Terracing reduces runoff in young coffee plantations, but an old and very steep coffee plantation without terraces produced the least runoff, probably because the coffee canopy was well developed.
Table 6.9 Effect of cropping systems and conservation practices on annual water runoff losses and nutrients lost in the runoff, on an Andisol in Chinchiná, Colombia. The 6-year average rainfall was 2775 mm (Suárez de Castro and Rodríguez Reference Suárez de Castro and Rodríguez1955, Reference Suárez de Castro and Rodríguez1958).
| System | Slope (%) | Annual runoff (mm) | Nutrients in runoff (kg/ha per year) | ||||
|---|---|---|---|---|---|---|---|
| N | P | K | Ca | Mg | |||
| Bare soil, tilled monthly | 22 | 1730 | 25 | 0.98 | 24 | 238 | 152 |
| Pasture | 22 | 513 | 7 | 0.15 | 6 | 25 | 26 |
| Young coffee plantation | 45 | 190 | 8 | 0.04 | 2 | 6 | 7 |
| Young coffee plantation with terraces | 45 | 410 | 4 | 0.14 | 4 | 8 | 9 |
| Old coffee plantation without terraces | 55 | 59 | 1 | 0.08 | 1 | 2 | 2 |
Runoff losses from experimental high-intensity rainstorms were evaluated by Barnett et al. (Reference Barnett, Carrecker and Abruña1972) on steep Ultisols and Inceptisols in Puerto Rico. Substantially lower runoff and nutrient removal was observed in the Ultisols, which were better aggregated.
Runoff losses are often deposited in the same fields, resulting in no net losses of water or nutrients at the field scale, although important local effects are created. In other cases, runoff steals most of the rainfall from surface-sealed Alfisols in the Sahel, as previously mentioned.
6.6 Soil Erosion
Soil erosion often is the most visible evidence of land degradation, and is indeed a major problem in much of the tropics. Soil is eroded by wind and water, the latter being the most extensive. There are three main types of erosion by water: sheet, rill and gully.
Soil erosion by water (A) is a function of five factors: rainfall erosivity (R), soil erodibility (K), slope gradient and length (LS), soil cover (C) and structural protection such as terraces (P), as described in the Universal Soil Loss Equation or USLE (Wischmeier and Smith Reference Wischmeier and Smith1978):
The USLE has been modified many times (Rosswell Reference Rosswell1993, Renard et al. Reference Renard, Foster, Weesies, McCool and Yoder1997, Millward and Mersey Reference Millward and Mersey1999, Tran et al. Reference Tran, Ridgely, Nearing, Duckstein, Sutherland, Stott, Mohtar and Steinhardt2001). The modifications have not considerably affected the conceptual nature of the equation. In any case, I have seen few published articles where the equation is actually used to determine erosion, which usually is done directly by several methods.
6.6.1 Rainfall Erosivity (R)
Erosivity is the potential ability of rain to cause erosion (Lal Reference Lal1976). It is independent of total annual rainfall, its seasonal distribution and the properties of soils on which it falls. Rainfall erosivity is best measured as the product of the kinetic energy of the storm (in mega joules per hectare [MJ /ha]) times the 30-minute maximum intensity (in mm/h), which is the highest average rainfall intensity during a 30-minute period. This measure (the erosivity index, EI30) is considered the best estimate of rainfall erosivity (Wischmeier et al. Reference Wischmeier, Smith and Ukland1958, Lal Reference Lal1976). Rainfall intensity is also used as a measure of rainfall erosivity, ignoring the more difficult to measure kinetic energy. For example, Emerson (Reference Emerson1995) suggested that rainfall intensities of 25 mm/h are sufficient to start erosion in Australia.
Rainfall intensity is generally higher in the tropics than in temperate regions because higher air temperatures provide more energy. The exceptions are subtropical areas (~30° N), often affected by hurricanes or typhoons. Rainfall intensity in the tropics is often sustained at 150–200 mm/h for 10–15 minutes, with large drops having a median diameter of 2.5 mm (Kayombo and Lal Reference Kayombo and Lal1993).
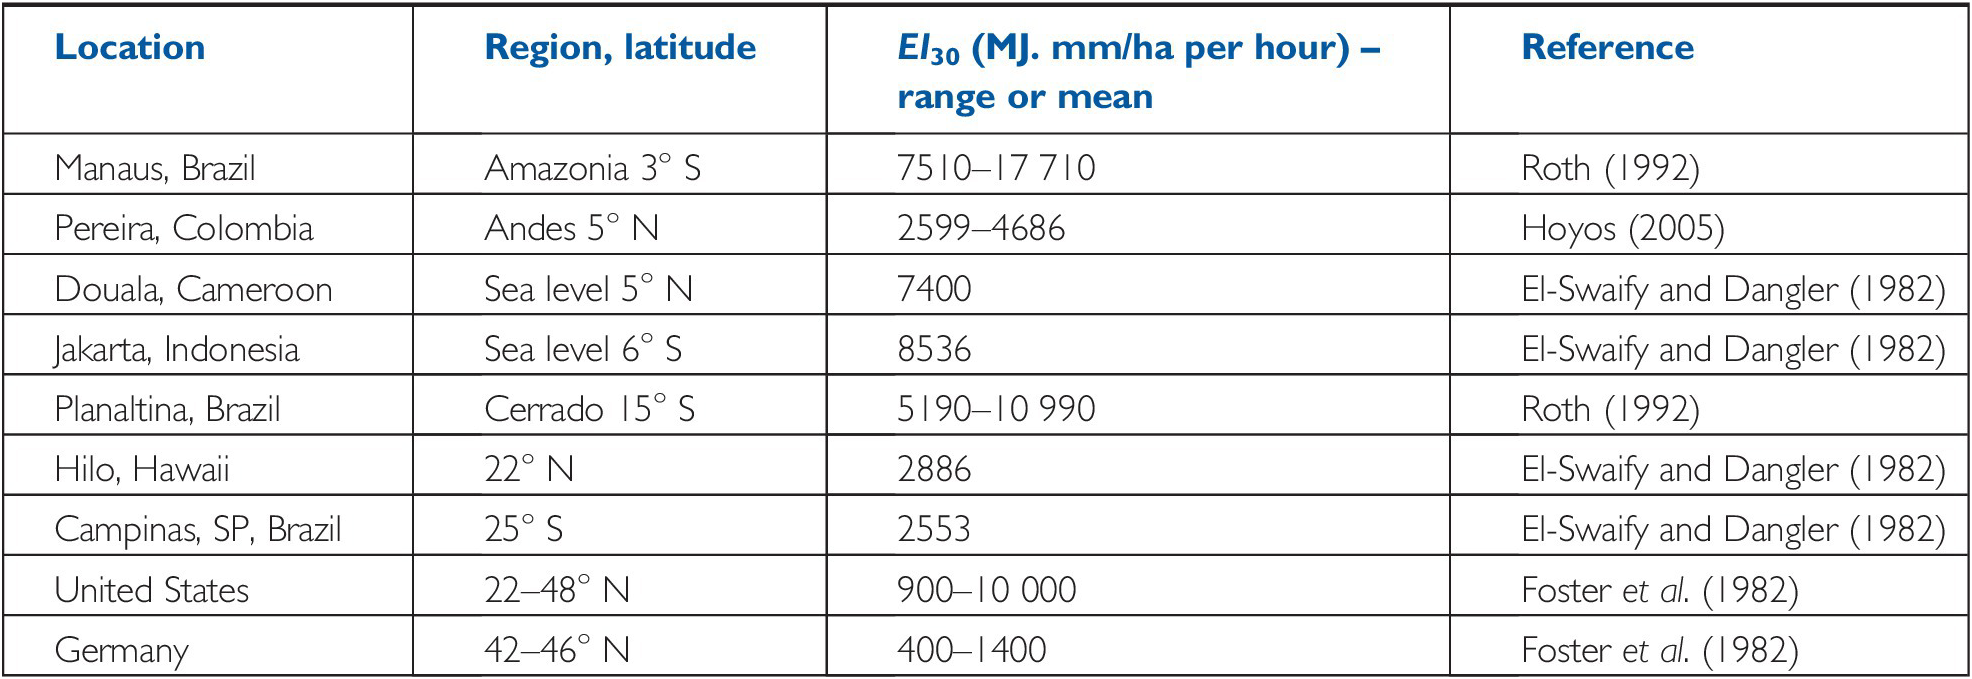
A range of rainfall erosivity indices is shown in Table 6.10 as a function of latitude. High erosivity indices, EI30 > 7000, occur in the tropics, with the exception of the highlands in the coffee zone of Colombia, and a site at sea level in Hawaii. Low EI30 values are found in São Paulo state in Brazil and in Germany. The United States shows variability of two orders of magnitude, including very high levels found in rainstorms in the Midwest and other temperate regions.
Table 6.10 Rainfall erosivity indices are generally higher in the tropics, but are highly variable
| Location | Region, latitude | EI30 (MJ. mm/ha per hour) – range or mean | Reference |
|---|---|---|---|
| Manaus, Brazil | Amazonia 3° S | 7510–17 710 | Roth (Reference Roth, Summer and Stewart1992) |
| Pereira, Colombia | Andes 5° N | 2599–4686 | Hoyos (Reference Hoyos2005) |
| Douala, Cameroon | Sea level 5° N | 7400 | El-Swaify and Dangler (Reference El-Swaify and Dangler1982) |
| Jakarta, Indonesia | Sea level 6° S | 8536 | El-Swaify and Dangler (Reference El-Swaify and Dangler1982) |
| Planaltina, Brazil | Cerrado 15° S | 5190–10 990 | Roth (Reference Roth, Summer and Stewart1992) |
| Hilo, Hawaii | 22° N | 2886 | El-Swaify and Dangler (Reference El-Swaify and Dangler1982) |
| Campinas, SP, Brazil | 25° S | 2553 | El-Swaify and Dangler (Reference El-Swaify and Dangler1982) |
| United States | 22–48° N | 900–10 000 | Foster et al. (Reference Foster, Moldenhauer and Wischmeier1982) |
| Germany | 42–46° N | 400–1400 | Foster et al. (Reference Foster, Moldenhauer and Wischmeier1982) |
The low rainfall intensities of Germany and much of Western Europe led European soil scientists, when confronted with tropical rainstorms, to assume a great difference between tropical and temperate regions in rainfall intensity. American scientists, more used to a wide range of rainstorm intensities in their temperate regions, were less ready to make such an assertion.
6.6.2 Soil Erodibility (K)
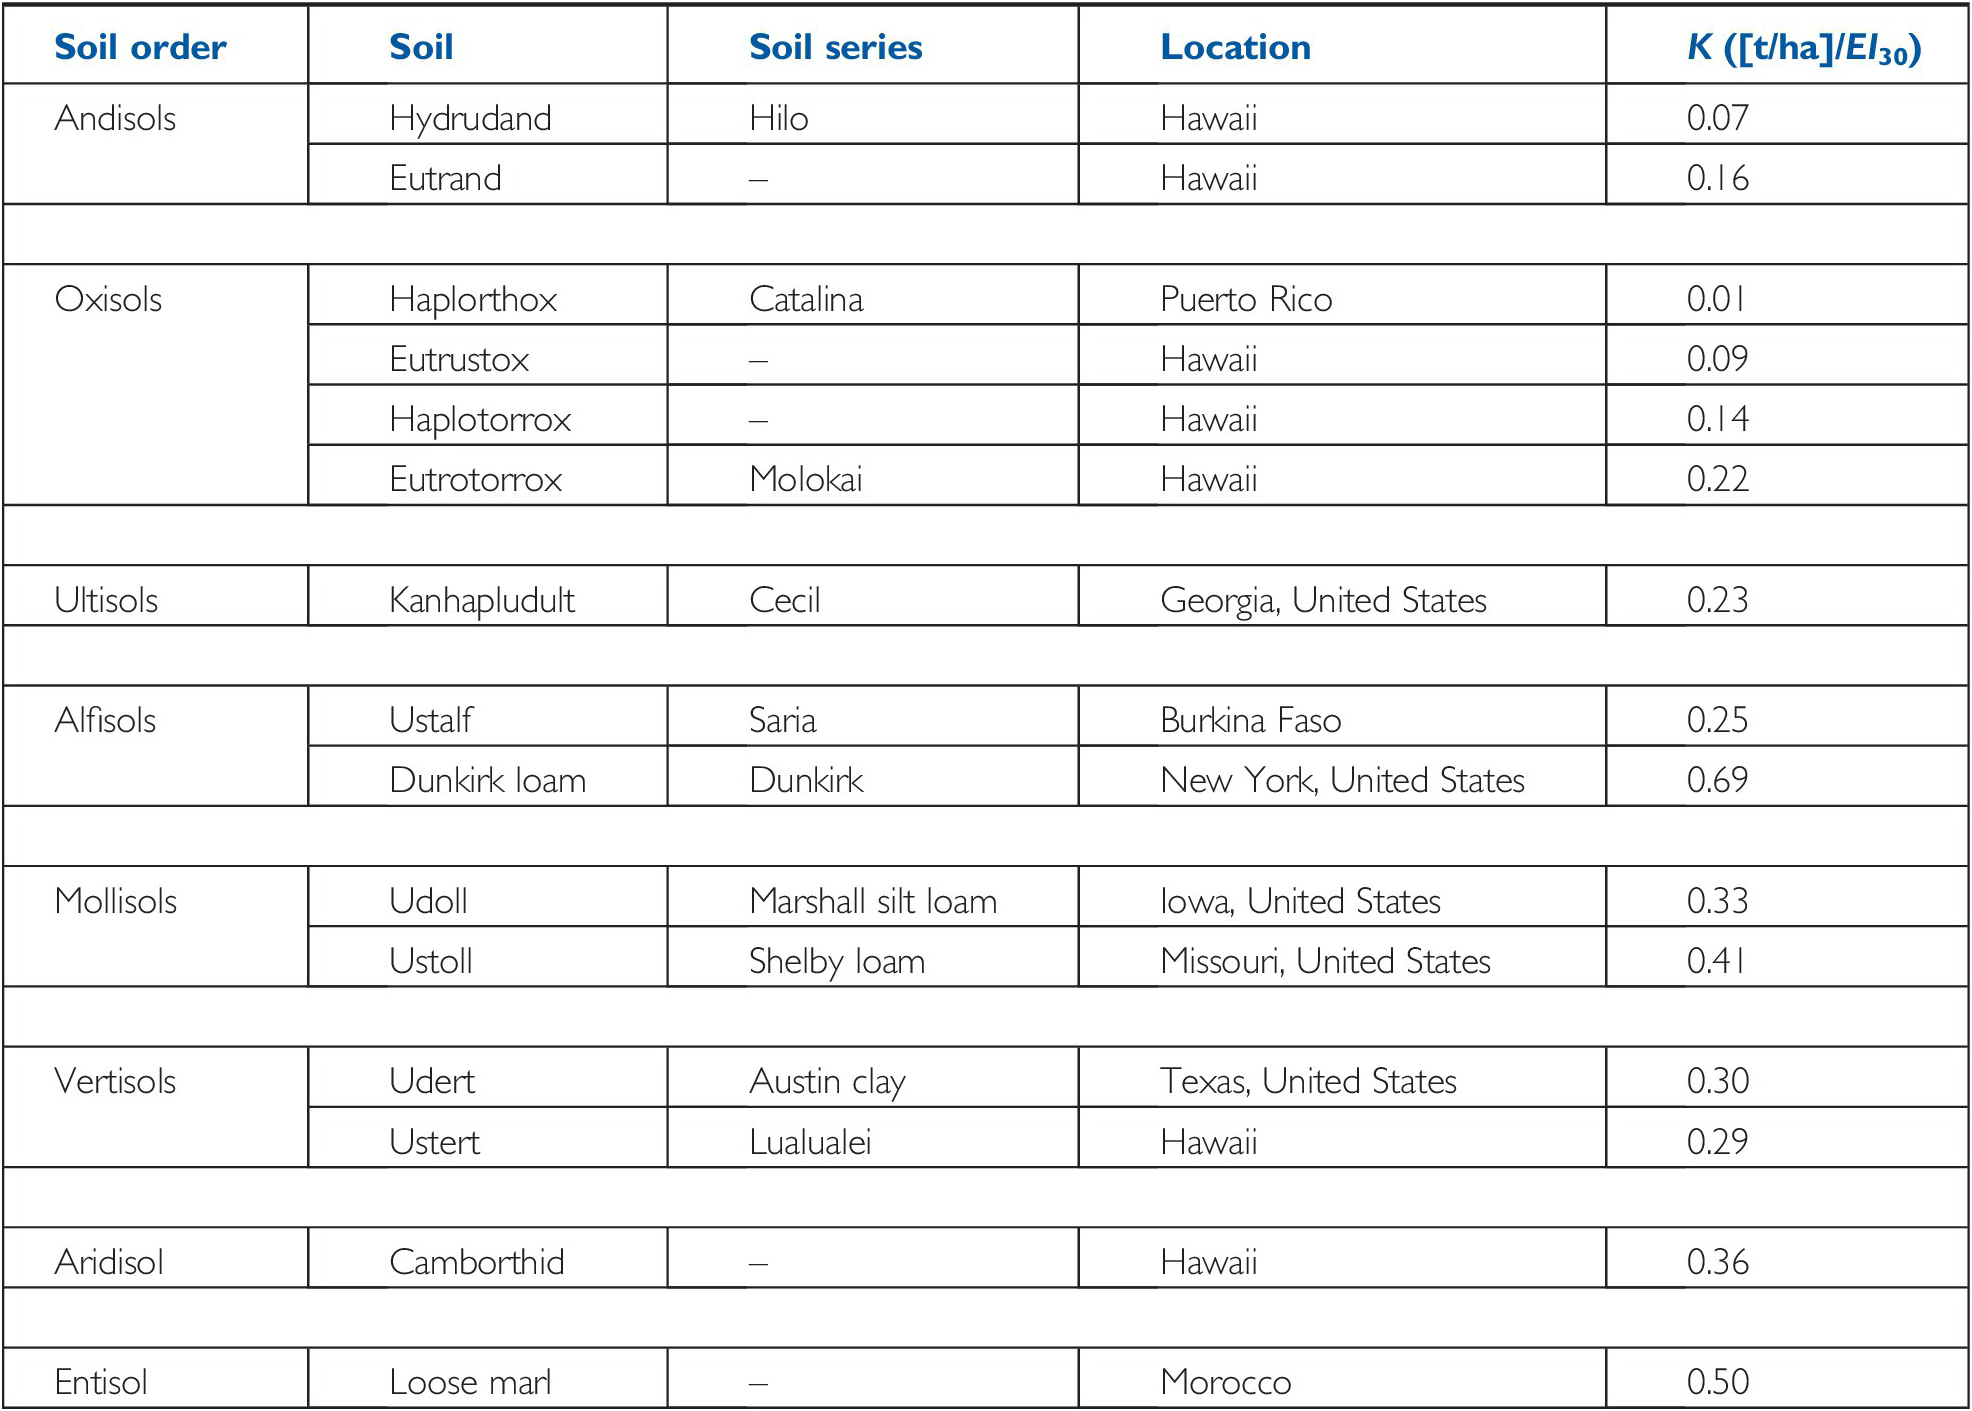
Erodibility is the quantitative index of inherent susceptibility of soil to erosion by water. It is measured by soil losses from Wischmeier plots, 22.2 m long, on a uniform 9 percent slope, under continuously bare soil (El-Swaify and Dangler Reference El-Swaify and Dangler1982). Soil erodibility is then calculated as tons per hectare of soil loss divided by EI30. This is known as the K value, relating soil loss per unit of rainfall erosivity.
Some examples in Table 6.11 show that soils dominated by low-activity clays and iron oxides (Oxisols, Ultisols) as well as allophane (Andisols) have generally lower erodibility than soils with high-activity clays (Aridisols, Mollisols, Vertisols). The high erodibility of loose marl deposits in Morocco is probably indicative of the extreme erosion that is found in similar deposits in Haiti.
Table 6.11 Soil erodibility indices of different soils. Adapted from El-Swaify and Dangler Reference El-Swaify and Dangler1982.
Vertisols are particularly susceptible to gully erosion. Specific vertic properties, such as low hydraulic conductivity, slumping due to slickensides and subsurface piping through cracks, facilitate gully head formation (Deckers et al. Reference Deckers, Spaargaren, Nachtergaele, Syers, Penning de Vries and Nyamudeza2001).
Although erodibility is largely determined by the soil, the underlying parent material can play a role. One of the worst-case scenarios I have seen is when Vertisols are underlain by loose unconsolidated lake sediments, such as in the Nyando Basin near Lake Victoria in Kenya. At the start of the rainy season, cracks in Vertisols allow highly erosive rains to penetrate these extremely erodible sediments, rapidly creating huge gullies.
6.6.3 Slope Length and Gradient (LS)
Topography has major effects on soil erosion. The LS factor refers to slope length and gradient. The worldwide availability of Shuttle Radar Topography Mission (SRTM) satellite data at 90-m resolution makes the assessment of these parameters straightforward, although higher resolutions are needed for flat areas. Examples of the dimensionless LS values are included in Table 6.12, showing the values increasing with slope as well as slope length.
Table 6.12 Values for LS factor (dimensionless) in USLE. Adapted from Wischmeier and Smith (Reference Wischmeier and Smith1978).
| Slope | Slope length (m) | |||
|---|---|---|---|---|
| (%) | (degrees) | 50 | 100 | 200 |
| 2 | 1 | 0.2 | 0.3 | 0.4 |
| 6 | 3 | 0.9 | 1.2 | 1.7 |
| 10 | 6 | 1.8 | 2.5 | 3.5 |
| 20 | 11 | 5.2 | 7.5 | 10.0 |
| 30 | 17 | 10.0 | 15.0 | 20.0 |
| 50 | 27 | 23.0 | 36.0 | 45.0 |
6.6.4 Vegetative Cover (C)
As previously indicated, the principal cause of soil erosion is the lack of soil cover. In a comprehensive study in mountainous Andisols near Pereira, Colombia, Hoyos (Reference Hoyos2005) found that the cover management factor C was the preponderant one, overriding the effects of topography in steep lands. Examples of C factors in West Africa are shown in Table 6.13. Roose (Reference Roose1975) gave the bare soil a C value of 1, the ungrazed savanna 0.01, and the dense forest 0.001.
Table 6.13 C factor values (dimensionless) for different management systems in West Africa. Adapted from Roose (Reference Roose1975).
| System | C |
|---|---|
| Bare soil | 1 |
| Dense forest | 0.001 |
| Ungrazed savanna | 0.01 |
| Overgrazed savanna | 0.1 |
| Maize, sorghum, millet | 0.04–0.9 |
| Intensive rice cultivation | 0.1–0.2 |
| Cotton, tobacco | 0.5 |
| Peanuts (depending on planting date) | 0.4–0.8 |
| Oil palm, rubber, coffee, cacao with ground cover | 0.1–0.3 |
General estimates of the magnitude of erosion losses in West Africa, from the semiarid Sahel to the humid tropics (Charreau Reference Charreau1972), underline the importance of keeping a cover over the soil, as Table 6.14 shows.
Table 6.14 Magnitude of annual erosion losses in four West African localities (t/ha per year) using USLE plots. Adapted from Charreau (Reference Charreau1972).
6.6.5 Protective Structures (P)
Terraces and other protective structures and practices (represented by the P factor) can have major positive effects on erosion control. This is dealt with in the next section.
6.6.6 Measuring Soil Erosion
The USLE is the primary model used for large-area spatial risk assessment in the tropics. But this model often overestimates erosion losses due to the small size of the plots – about 22 m long and 3–5 m wide. These small plots can also underestimate erosion when the slope or other factors not present in plots are evident in the landscape (Fig. 6.13).

Fig. 6.13 These erosion plots in Indonesia ignore the topography of this catchment.
The USLE is an empirical model, developed to assess plot-scale soil loss, but not sediment detachment and transport at the watershed scale. The USLE has rarely been validated using ground observations of soil degradation.
Cohen et al. (Reference 172Cohen, Shepherd and Walsh2005) evaluated the effectiveness of models to predict erosion in a small watershed of western Kenya using standard remote assessment methods based on interpolated spatial data layers. They found that diagnostic models based on geographic information systems produced validation accuracies of 78 percent, while the association between USLE-predicted and observed erosion was only 38 percent.
Many process models exist on how to put all this information together. Probably the most commonly used one is the Erosion-Productivity Impact Calculator (EPIC), which goes beyond erosion and is often used for crop modeling (Williams and Renard 1985). The Water Erosion Prediction Project (WEPP) developed by the United States Department of Agriculture National Soil Erosion Research Laboratory (Flanagan and Nearing Reference Flanagan and Nearing1995) is being successfully applied in the tropics (Ella Reference Ella, Coxhead and Shively2005), combining characteristics of small watersheds (2000–10 000 ha) with soil erosion processes.
Land degradation in many policy studies focuses only on soil erosion, which economists quantify in terms of the value of soil loss or the cost of soil conservation measures. To our shame, many economists use the USLE soil-loss data from the Wischmeier plots as representative of real conditions at the field, watershed and even national scales. Most soil scientists know very well that this methodology overestimates or sometimes underestimates erosion losses due to the small size of these plots. But what is eroded from one spot is most frequently deposited in another one in the same field, often leading to no losses at the field scale.
Stefano Pagiola (personal communication, 1990), a natural resource economist, showed how erosion data, when cited from paper to paper, becomes conventional knowledge. He showed in a presentation that soil erosion rates in El Salvador average 130 t/ha per year. He dug back in the literature and found the original study – in one region of the country where Wischmeier erosion plots in four sites produced soil losses ranging from 10 to 130 t/ha per year. Guess which one became conventional knowledge.
Soil erosion is better estimated at the watershed (or catchment) scale. The differences that can occur between plot and watershed scales are shown in Table 6.15, where both types of measurements were done in the same land-clearing study in Sabah, Malaysia. Sidle et al. (Reference Sidle, Ziegler, Negishi, Nik, Siew and Turkelboom2006) found a 20-fold difference in erosion estimates between the two methods, the larger numbers at the watershed scale. In this case, the USLE underestimated soil erosion.
Table 6.15 Large differences between plot- and watershed-scale soil-erosion estimates in Mendolong Research Area, Sabah, Malaysia (Sidle et al. Reference Sidle, Ziegler, Negishi, Nik, Siew and Turkelboom2006). With permission from Forest Ecology and Management.
| Land-clearing treatments | Soil erosion (t/ha per year) | |
|---|---|---|
| Wischmeier plots | Catchment | |
| Tropical forest | 0.038 | 0.16–0.22 |
| Manual clearing, no burning | 0.11 | 2.20 |
| Manual felling, wood extracted by crawler tractor, burning and planting | 0.20 | 3.90 |
Perhaps the best example of how to measure erosion in the tropics was done by Lal (Reference Lal, Lal, Sanchez and Cummings1986), using catchments ranging from 2.6 to 15 hectares, in a land-clearing experiment near Ibadan, Nigeria (Table 6.16), where the effects of land-clearing methods and tillage were studied.
Table 6.16 Catchment-scale data from an Alfisol in Ibadan, Nigeria, grown with maize. Data are annual averages for the first 3 years after clearing. Adapted from Lal (Reference Lal, Lal, Sanchez and Cummings1986).
| Land-clearing treatment | Catchment area (ha) | Runoff (mm per year) | Erosion (t/ha per year) |
|---|---|---|---|
| Forest | 15 | < 1 | < 0.01 |
| Traditional slash and burn | 2.6 | 6.6 | 0.02 |
| Manual clearing plus conventional tillage | 3.2–4.1 | 79.7 | 4.8 |
| Bulldozer with shear blade, no tillage | 2.7–3.9 | 104.8 | 4.1 |
| Tree pusher–root rake, no tillage | 3.1–3.2 | 170.0 | 15.7 |
| Tree pusher–root rake plus conventional tillage | 2.9–4.0 | 330.6 | 24.3 |
This experiment is one of the largest and best-run in the tropics, using different catchments that were necessarily of different area due to topography. The data show how both runoff and erosion increase with more intense land-clearing methods.
These data contrast sharply with Lal’s results from the USLE plots in the same soil, which he used a decade before (Lal Reference Lal1976), and are shown in Table 6.17. The USLE plots overestimated erosion losses for the catchment at 11.2 t/ha per year, compared with 4.8 t/ha per year (Table 6.16), in treatments cleared manually, tilled conventionally and planted to maize. If the bare fallow soil is used to calculate the erodibility factor K in the Wischmeier plots, the result, 106.6 t/ha per year, is an order of magnitude higher than all erosion experienced in the catchment plots.
Table 6.17 USLE plot data in 1972 at the same location as in Table 6.16, mean values of all slopes. Annual soil loss averages for the first two years (Calculated from Lal Reference Lal1976).
| Treatment | Erosion (t/ha per year) |
|---|---|
| Bare fallow | 106.6 |
| Maize–maize, tilled | 11.2 |
| Maize–cowpea, no tillage | 2.0 |
In spite of their limitations, the Wischmeier erosion plots permit comparisons among soils in different ecosystems and management systems, but as shown they can underestimate or overestimate the more realistic catchment-based data. Other estimates from many countries in the tropics, compiled by Lal (Reference Lal, Lal, Sanchez and Cummings1986), are in the range of 4–3600 t/ha per year.
The relationship between soil erosion and crop yields is complex because there are many other factors involved. Figure 6.14 shows the effect of a high-intensity storm on a cultivated landscape; the crop cover was unable to prevent erosion. In addition, the question of how to predict crop losses is difficult. For sub-Saharan Africa, Lal (Reference Lal1995) estimated annual crop yield reductions of 6 percent (3.6 million tons of cereals) in 1989, and estimated an increase, to 15 percent, by 2020.

There are many assumptions in such estimates, but these numbers suggest that crop productivity losses due to soil erosion are not overwhelming, in comparison, let’s say, with post-harvest losses during crop storage, which average 30 percent (Sanchez Reference Sanchez2015).
When gully erosion is unchecked, it can lead to catastrophic circumstances where no cultivation is possible, such as in Fig. 6.15.

6.6.7 Civil Engineering Erosion
While traveling in the tropics one often sees catastrophic erosion along rural roads. Ziegler and Giambelluca (Reference Ziegler and Giambelluca1997) found that saturated hydraulic conductivity on unpaved roads in Thailand was ten times lower than adjacent soils, therefore increasing runoff and erosion along roadsides. This “civil-engineering erosion” is often photographed as if it has been caused by cultivation, and decorates many publications about soil degradation.
6.7 Soil and Water Conservation Practices
There is no question that soil erosion and water conservation are major challenges in the tropics, but what is being done about it? Tropical farmers and researchers have provided many ingenious solutions, some of which are described below. The principles of soil conservation in the tropics are no different from those developed in the temperate region. The high intensity of some tropical rainstorms, and poverty, however, require some special adaptations.
Conservation practices are generally of two types – keeping a vegetative cover over the soil and providing protective barriers against erosion. Since barriers such as biological or mechanical terraces require major investments in labor to construct and maintain them, farmers are unlikely to adopt them unless they have secure land tenure.
What follows are several examples of successful soil conservation in the tropics. Additional ones are found in books by Monengat (Reference Monengat1991) and Müller-Sämann and Restrepo (Reference Müller-Sämann and Restrepo1997) for Latin America, and Craswell et al. (Reference Craswell, Remenyi and Nallana1985) and Coughland and Rose (Reference Coughland and Rose1997) for Southeast Asia.
6.7.1 Small-Scale Structures in the Field
Many small-scale farmers in Africa till their land with hoes and without animal or mechanical power. In well-structured, gently sloping Oxisols and oxic Alfisols of western Kenya, this works relatively well (Fig. 6.16). In less-well-structured soils, such as loamy Alfisols in Malawi and most Alfisols in subhumid areas of both West and East Africa, most farmers make ridges and furrows on just about any slope, planting crops on top of the ridges (Fig. 6.17). Often they use tied ridges, earthen bunds that are constructed at right angles to the furrows, at intervals of 1–4 m, effectively making small, shallow ponds to allow more time for water to infiltrate (Pereira et al. Reference Pereira, Hosegood and Dagg1967, Hulugalle et al. Reference Hulugalle, de Koning and Matlon1987).

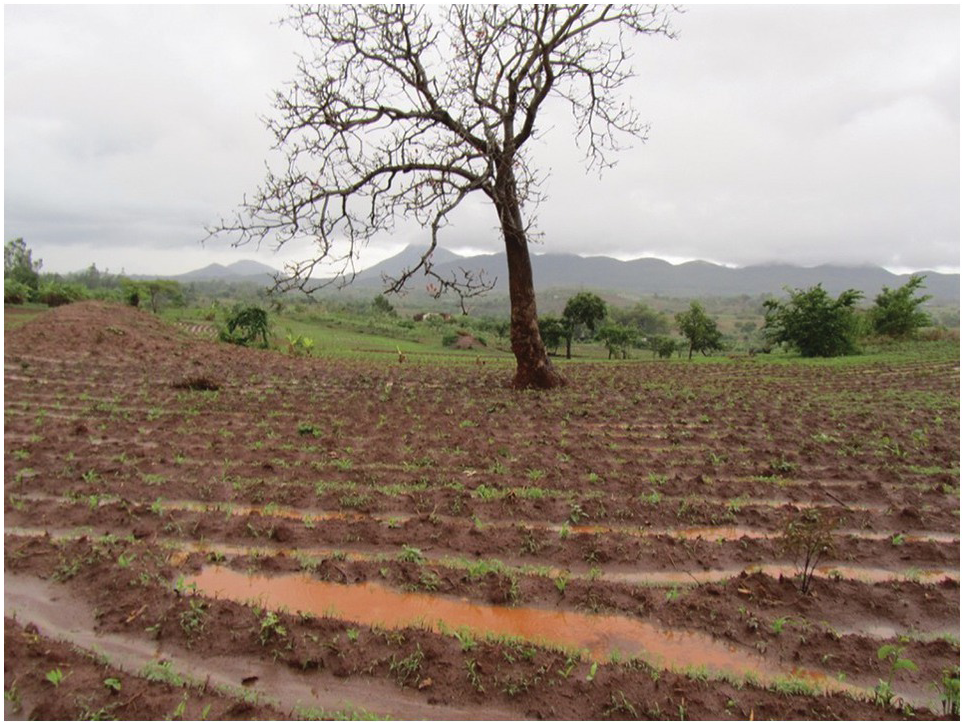
Fig. 6.17 Ridge and furrow system during the rainy season in Mwandama, Malawi, in a loamy Alfisol. Ridges are rebuilt every year.
In semiarid northern Ethiopia, farmers use trench bunds, about 1–2 m long, 50 cm wide and 30 cm deep, located where there is plenty of runoff (Fig. 6.18). These trench bunds allow water that would run off to slowly infiltrate into the soil; this is one of many ways to store water in the subsoil. Tied ridges increase soil moisture storage, which can help avert the short-term droughts that are common in rainfed systems. Figure 6.19 shows the increased water availability with tied ridges. Sorghum, maize and cotton yields increased by 26–45 percent in a 6-year trial in Zimbabwe (Nyamudeza et al. Reference Nyamudeza, Mandiringana, Busanagavanye and Jones1991, Reference Nyamudeza, Hussein, Matibiri, Syers, Penning de Vries and Nyamudeza2001).


Fig. 6.19 The positive effects of tied ridges (tied furrows) on profile soil moisture in a Vertisol of Zimbabwe.
Throughout the semiarid tropics, microcatchments are commonly used to capture surface runoff. Zai holes are shallow pits surrounded by a hemisphere of stones that form a small catchment (about 3–10 m in diameter) where a valuable tree is often planted (Fig. 6.20). There are many variations of these techniques. Trash lines of organic materials are also commonly used to slow down runoff. The overall strategy of these practices is to hold water for a longer time (Kayombo and Lal Reference Kayombo and Lal1993).
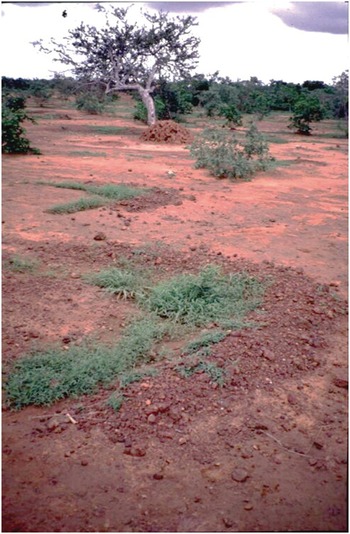
Fig. 6.20. Zai holes in Burkina Faso.
6.7.2 Contour Cultivation
Planting along contours, instead of up and down the slope, is usually a feasible and sound practice, but often a difficult one to introduce to farmers who are used to plowing up and down slopes. All over the tropics, farmers indicate that when they tried contour cultivation, intense rains broke the contours and erosion got worse.
Results from Kunming, China, provide valuable insights (Table 6.18). At a gentle slope of 6 percent there were no major differences in soil loss between contour or downslope cultivation, with losses lower than 1 t/ha per year. On a steep 20 percent slope, downslope tillage produced slightly higher soil loss. It was at the extreme 50 percent slope where downslope tillage produced more than twice the soil loss than contour tillage. The advantage of contour cultivation is more evident for steep slopes.
Table 6.18 Annual soil loss (t/ha per year), average of 4 years under one crop of maize per year (1993–1996), conventionally tilled at Yunnan Agricultural University, Kunming, China, elevation 1930 m. Soil is probably an Ustult. Adapted from Fullen (Reference Fullen, Rubio, Morgan, Asins and Andreu2002).
| Slope (%) | Soil erosion (t/ha per year) | |
|---|---|---|
| Contour | Downslope | |
| 6 | 0.96 | 0.70 |
| 18 | 3.95 | 4.39 |
| 50 | 4.29 | 10.67 |
Contour cropping, an inexpensive and simple technology, was adopted and maintained in the Dominican Republic after the research demonstrations had stopped (Carrasco and Witter Reference Carrasco and Witter1993), while in neighboring Haiti, downslope cultivation is still widespread on steep slopes, with devastating results.
6.7.3 Contour Hedges
Planting trees or tropical grasses along contours provides effective barriers that protect the soil against erosion. Evidence of the positive impacts of these practices is well established (Roose Reference Roose1970, Lal Reference Lal1989, Young Reference Young1989, Juo et al. Reference Juo, Caldwell and Kang1994, Kiepe and Rao Reference Kiepe and Rao1994, Alegre and Rao Reference Alegre and Rao1996, van Roode Reference van Roode2000). Closely spaced trees on slopes reduce soil erosion by water, as they provide a physical barrier of stems, low branches, superficial roots and leaf litter, as well as allowing higher water infiltration due to better soil aggregation under the trees (Kiepe and Rao Reference Kiepe and Rao1994). If leguminous, these hedges also fix nitrogen. Trees, however, do not deliver these functions until they are well established and have developed a litter layer, and they must be planted closely. Once established, most trees protect the soil indefinitely, provided they are well managed and the litter layer is not removed.
The perennial nature of tree and grass root systems provides a dependable source of carbon for microorganisms, which in turn promotes better soil structure and often higher macrofaunal activity, which in turn promotes higher porosity (Sanchez Reference Sanchez1995). When contour hedges are composed of fodder trees (Calliandra calothyrsus, Leucaena leucocephala, for example) and grasses such as Napier or elephant grass (Pennisetum purpureum), they also provide livestock feed, without competing for area with crops. Vetiver grass (Vetiveria zizanioides), although capable of controlling erosion, is seldom used because it has no value as forage. Fruit or timber trees grown as an upper storey in such contours also provide additional income and ecosystem services (Garrity Reference Garrity1993, Reference Garrity, Ong and Huxley1996; Garrity and Mercado Reference Garrity and Mercado1994).
Njoroge and Rao (Reference Njoroge and Rao1994) developed a summary of multi-year trials across the tropics (Table 6.19). Under a variety of soils and slopes, contour hedges show their effectiveness in minimizing soil loss and runoff. It is important to space the contour hedges at least 4–5 m wide, to largely eliminate the competition with the crops in between, or else you begin encountering the limitations of alley cropping (Sanchez Reference Sanchez1995; Chapter 19). The Malawi example, although effective in controlling erosion, resulted in low maize yields, partly due to competition between the crop and the trees, with only 0.9 m between hedges (Banda et al. Reference Banda, Maghembe, Ngugi and Chome1994).
Table 6.19 Contour tree hedgerows dramatically reduce soil erosion losses and, to a lesser extent, runoff losses. Adapted from Njoroge and Rao (Reference Njoroge and Rao1994).
In semiarid climates, spacing between contours can be wider. Contour hedges in an essentially flat slope in Hyderabad, India, predictably did not have an erosion control effect. The effect is more pronounced with an increasing slope angle of up to 30 percent, with over 80 percent reduction in soil loss. At more pronounced slopes, this reduction in soil loss is less pronounced, at 40 percent for a 75 percent slope. For such steep slopes bench terraces may need to be constructed to adequately control soil erosion (Njoroge and Rao Reference Njoroge and Rao1994).
Controlling soil erosion with planted hedges has an additional advantage, which is that the slope between the hedges becomes less steep and eventually flat in some instances, forming, in effect, bench terraces. These “biological terraces” are produced by taking advantage of the erosion process within the contour hedges, with the tree or grass growth keeping up with the higher soil surface at the lower end, something stone bench terraces cannot do. With time, soil from the upper end of the terrace moves downslope and is captured by the lower hedge (Fig. 6.21).
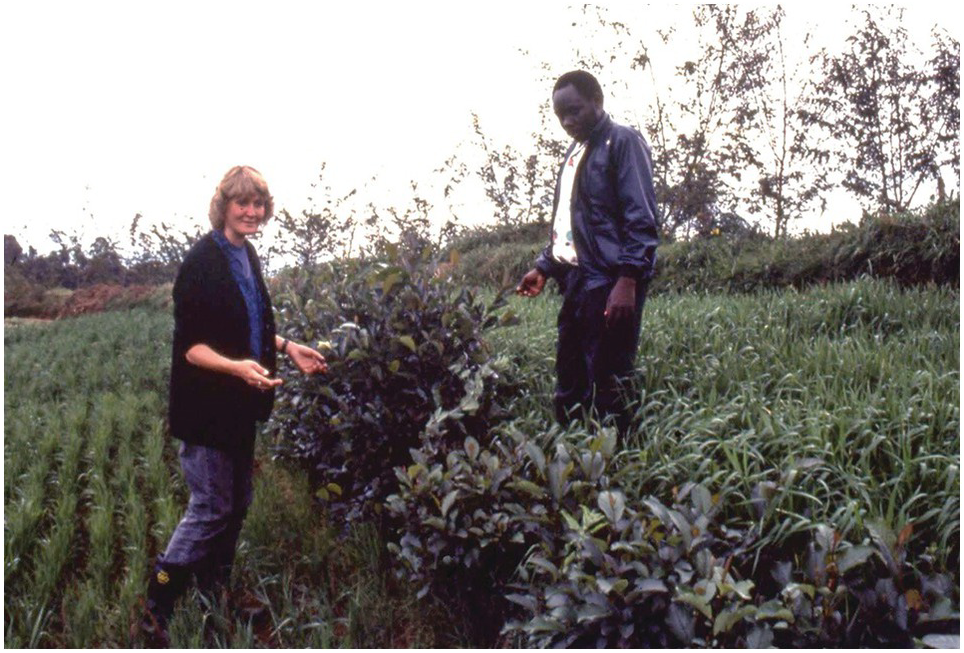
Fig. 6.21 Contour hedge terraces gradually become flat. Rwerere, Rwanda, ~2500 m elevation. Wheat is the crop and Grevillea robusta the tree, stunted at this high elevation. Drs. Erika Styger and Amadou Niang.
Loss of topsoil from the upper third of these terraces can occur often with lower crop yields in relation to the more fertile lower end of the terrace where the topsoil accumulates (Garrity Reference Garrity, Ong and Huxley1996, Walle and Sims Reference Walle and Sims1999). One solution is to plant nitrogen-fixing tree fallows in the upper third of the terrace for 2 years, which, in the steep highlands of southwestern Uganda, added enough nutrients and SOM to even out the fertility gradient (Siriri and Raussen Reference Siriri and Raussen2003). Furthermore, Agus et al. (Reference Agus, Cassel and Garrity1997) also found lower plant available water at the top of a terrace under alley cropping in Mindanao, Philippines, confirming the competition for water between closely spaced hedgerow species and the crop. That is one reason why alley cropping is not recommended (Sanchez Reference Sanchez1995, Chapter 19).
6.7.4 Earth Terraces
During the colonial period in Africa, farmers were often forced to construct narrow bench terraces, a practice quickly done away with in many countries after independence, and not particularly effective. In its place, steep upslope terraces (fanya juu in Kiswahili, loosely meaning “throw upwards”) are now widespread in East Africa.
Fanya juu terraces are mainly responsible for the environmental rehabilitation of Machakos District in Kenya (Tiffen et al. Reference Tiffen, Mortimore and Gichuki1994). These terraces, constructed after consultation with villagers instead of being imposed on them, along with extension and credit programs, created the “more people, less erosion” paradigm. Tiffen and co-workers concluded that the Machakos District has sustained agricultural intensification and improved soil conservation and crop production for the last 40 years in spite of a population growth rate of 3 percent per annum. Fanya juu terraces have been found more effective in reducing soil loss and runoff than contour hedges in Machakos (van Roode Reference van Roode2000) because they present a solid barrier, unlike trees, at ground level.
The opposite strategy is to dig the furrows along the contour, but build the terrace downslope, and plant grasses. These are called raised bed terraces in Indonesia, where they have decreased soil erosion in steep slopes in Central Java from 106 t/ha to 34 t/ha per year (Adiningsih and Syarifuddin Karama Reference Adiningsih and Syarifuddin Karama2004). However, the authors considered bench terraces made of stone to be more economically attractive in spite of higher labor costs.
6.7.5 Stone Bench Terraces
Indigenous tropical farmers have produced spectacular and long-lasting bench terraces made of local stones, which have controlled erosion for decades and centuries. The Inca civilization spread stone terraces called andenes (where the name Andes probably comes from), which are where their descendants grow tropical highland crops like potato, quinoa, wheat and barley, and raise cattle, llamas and alpacas. An iconic example is Machu Picchu in Peru. Gravity irrigation canals and drainage ditches, along with the terraces, showed excellent engineering by a culture that had not yet discovered the wheel. Many of these structures are now abandoned in many parts of the Andes, but many also retain their productivity.
Southeast Asia has similar examples in the Philippines (Fig. 6.22); Java, Sumatra, and Bali, Indonesia (Siebert and Belsky Reference Siebert and Belsky1990); Sri Lanka; and other countries. Wetland rice is the main crop in these terraces, requiring soils to be flooded, which decreases soil strength and requires more maintenance. I have seen such stone terraces in West Sumatra that are wide enough to plant only two rows of rice, about 50 cm wide.
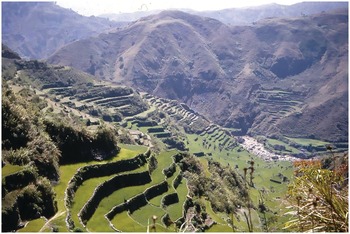
Fig. 6.22 Sagada rice terraces, Mountain Province, Philippines.
6.7.6 Stone Bunds
In semiarid highlands of the Tigray region of Ethiopia, most soils are stony Entisols and Inceptisols, and farmers have used stones to construct a plethora of soil and water conservation structures since the 1980s. A 30-year study by Nyssen et al. (Reference Nyssen, Munro, Haile, Poesen, Descheemaeker, Harteweyn, Moeyersons, Govers and Deckers2007) shows that sheet and rill erosion rates have decreased, while infiltration, spring discharge, vegetation cover and crop production have improved.
The first intervention is making stone bunds on the contour (Fig. 6.23). Rock fragments larger than 5 mm can cover as much as 57–85 percent of the surface soil in this region. By following the contour in slopes greater than 15 percent, the soil is displaced downslope, and in effect makes the slope flattened in about 8 years (Nyssen et al. Reference Nyssen, Poesen, Haile, Moeyersons and Deckers2000), like contour hedges and fanya juu terraces in other areas. Stone bunds have been shown to increase productivity in the semiarid Tigray region (~650 mm per year), but not in the humid Amhara region (~1980 mm per year), suggesting a soil moisture saving effect (Kassie et al. Reference Kassie, Pender, Yusuf, Kohlin, Bluffstone and Mulugeta2007).
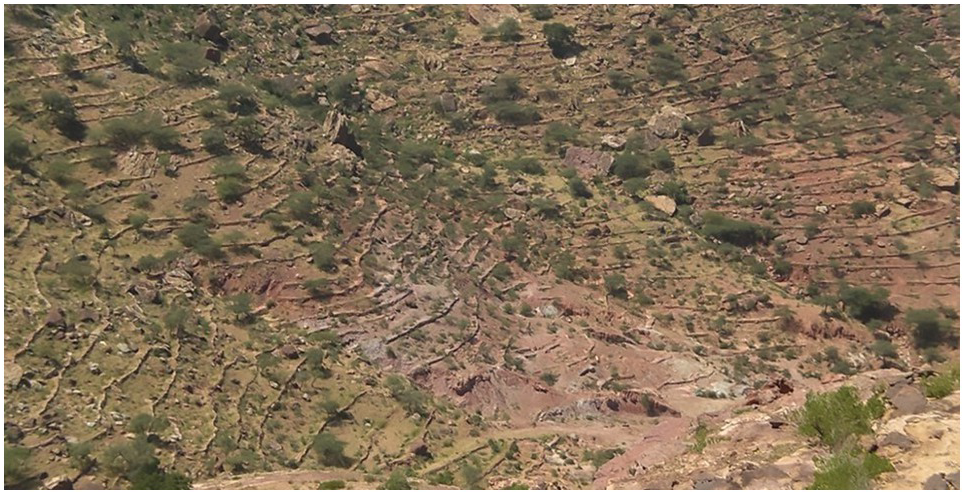
Fig. 6.23 A landscape in Tigray region, Ethiopia, with stone bunds along the contour.
Stones left on the fields have actually increased rainfall infiltration by protecting the soil from compaction by raindrop impact, and decreased surface sealing and crusting; they also reduce evaporation from the topsoil directly underneath the stones (Nyssen et al. Reference Nyssen, Haile, Poesen, Deckers and Moeyersons2001, Reference Nyssen, Poesen, Moeyersons, Lavrysen, Haile and Deckers2002). These “stone mulches” save soil moisture and are shown in Fig. 6.24.
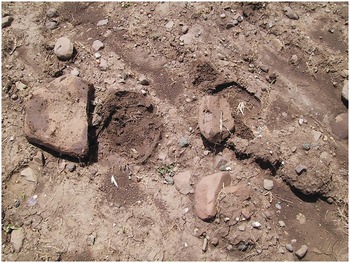
Fig. 6.24 Stone mulch, Axum, Ethiopia. The two stones in the center were overturned before taking the photo.
Halfway across the tropics, contour bunds made from duripan fragments in steep Andisols in Ecuador, when reinforced with grasses, were found superior to bench terraces or infiltration ditches in controlling erosion, requiring less labor and not as much loss of arable land (Dehn Reference Dehn1995).
6.7.7 Rehabilitating Eroded Landscapes by Community Action
Gully-ridden landscapes force farmers into extreme poverty, resulting in the classic “badlands” (shown above in Fig. 6.15). But when the community is mobilized and supported by science-based advice, the results can be remarkable. Community-based work during the past decade in the semiarid (500 mm annual rainfall) Koraro Millennium Village, in Hawzen Woreda in the Tigray region of Ethiopia, transformed much of an extremely degraded landscape, with stunted, extremely poor people, into a thriving community – also due to successful interventions in soil fertility, health, education, electricity and roads.
The area has a sharp sandstone escarpment to the south, which captures rains that reach the village as intermittent storm flows, causing gully erosion and reducing the arable land available. A comprehensive landscape rehabilitation plan was developed by a local agricultural engineer, Gigar Kebede, together with the community, supported by a government food for work program and the Millennium Villages Project (Chapter 2). Several technologies not only deviated a major gully from crop fields, but resulted in the village now having 43 hectares of irrigated land where there was none before. Some of these technologies are described in the following sections.
6.7.8 Controlling Gully Erosion
The restoration of gullied land involves larger-scale efforts. Figure 6.25 shows the construction of check dams, including the assembly of gabions (a cubic heavy wire mesh structure, filled with stones), the finished check dam and the captured sediments behind the dam that progressively fill the gullies. The gully bottoms are generally fertile and are often planted with palatable grasses and even tree legumes like Sesbania sesban. To that extent, it might be thought that the gully sides should also be planted, but often they are too steep.
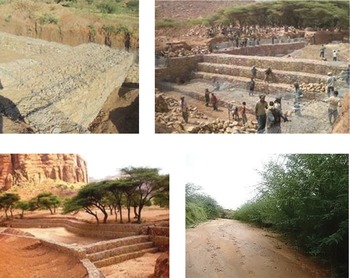
Fig. 6.25 A stone check dam constructed with gabions in Koraro. Top left: gabions. Top right: construction. Bottom left: the finished dam, which is narrower because the gabions penetrate sideways into the gully wall. Runoff flows over the center of the dam. Bottom right: sediment is deposited behind the dam, which can be planted with useful trees like Sesbania sesban along the sides.
6.7.9 Runoff Storage in the Subsoil
When cropland is next to hills or scarps, the potential for capturing runoff and storing it in the subsoil can be very significant. Percolation ponds are strategically located to capture runoff and allow it to percolate into the subsoil. Water stored in the subsoil is then retrieved downstream with shallow wells, and pumped to individual farmer fields (Fig. 6.26). Under these conditions, the subsoil is a great place to store water for subsequent irrigation.

Fig. 6.26 Percolation pond (left) captures runoff from the scarp at Koraro. The water is allowed to percolate into the subsoil, and is pumped from shallow wells lower in the landscape where farmers have their fields (right).
Another way to capture water is via the ditches along roads, many of which are lined with cement in steep areas. It is simple to deviate the flow into storage ponds. Some of these ponds are underlain by strong polyethylene sheets or made with cement. Ethiopia now has hundreds of thousands of these ponds, used for gravity or bucket irrigation (Nega and Kimeu Reference Nega and Kimeu2002, RELMA 2005, Malesu et al. Reference Malesu, Oduor and Odhiambo2007).
6.8 Conservation Agriculture
Plowing to turn the soil over, control weeds and prepare a seedbed has been practiced since the dawn of agriculture in the Fertile Crescent (Hillel Reference Hillel2008). Except for traditional shifting cultivation, where a dibble or planting stick was the only tool inserted into the soil, virtually all other farming systems involve tilling the soil until a loose seedbed is obtained and weeds turned over. The planting stick gave way to the hand hoe or spade, and eventually to the animal-drawn plow. In other centers of origin for agriculture that did not have cattle or horses, such as Mesoamerica and West Africa, humans were the draft animals until large livestock were introduced. The maresha wooden plow, pulled by oxen, has been used for centuries in Ethiopia, probably not any different now from biblical times (Fig. 6.27). The wooden point was eventually replaced by iron plows.
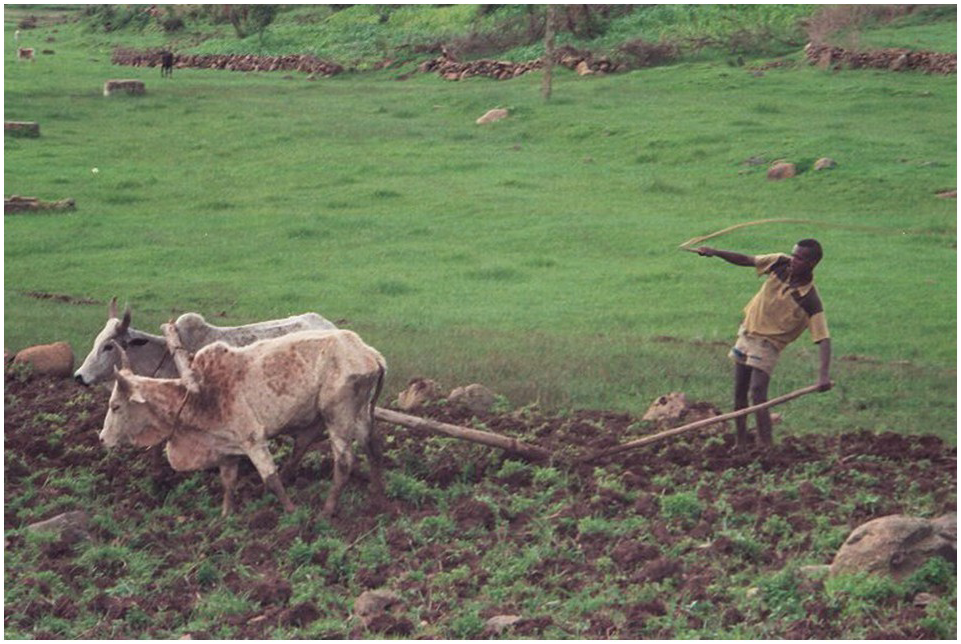
Fig. 6.27 A farmer using an ox-drawn maresha plow with a wooden point, near Axum, Ethiopia. This practice dates back to 700 BC.
Plowing changed radically and advanced enormously with Jethro Tull’s invention of the moldboard plow in the eighteenth century, which inverted the topsoil, burying weeds in the process. Disk harrows, also an inversion tool, further destroyed clods and eventually produced a weed-free, soft seedbed. Mechanization of tillage operations in many tropical regions has gone much beyond the introduction of tractor-drawn moldboard plows and disk harrows. Excessive tillage often results in high losses of soil moisture, increases soil erodibility and compaction, and creates plow pans. The energy and carbon footprints are also high. Because of these excesses, a movement towards reducing tillage began in earnest during the middle of the twentieth century, particularly with the advent of modern herbicides.
Conservation agriculture covers over 125 million hectares worldwide, with Brazil leading the tropics (Pittelkow et al. Reference Pittelkow, Liang, Linquist, van Groenigen, Lee, Lundy, van Gestel, Six, Venterea and van Kessel2015). This is still only 9 percent of the total cultivated area of the world, but conservation agriculture occupies about one-third of the area cultivated to grain crops in Brazil (Six et al. Reference Six, Feller, Denef, Ogle, Sá and Albrecht2002c). Derpsch (Reference Derpsch, Goddard, Zoebisch, Gan, Ellis, Watson and Sombatpanit2008) estimates that the vast majority of areas under conservation agriculture (over 95 percent) are practiced in large, mechanized, well-fertilized commercial farms, with only about 450 000 hectares practiced in medium to small farms – roughly, those with less than 15 hectares of cropland. Conservation agriculture is known by a variety of terms: no-till, reduced tillage, minimum tillage, plantio direto (direct seeding) in Brazil, etc.
6.8.1 Principles of Conservation Agriculture
Conservation agriculture was based originally on four principles: (1) minimum or no mechanical soil disturbance; (2) crop residue returned to the soil, to cover the soil surface throughout the year; (3) weed control by herbicides; and (4) crop rotation. To this, Vanlauwe et al. (Reference Vanlauwe, Wendt, Giller, Corbeels, Gerard and Nolte2014) added a very sensible but often forgotten fifth principle: (5) the appropriate use of fertilizer to enhance crop yields and crop residue production. All must be simultaneously undertaken.
Conservation agriculture, therefore, is an umbrella term that encompasses a range of cultural practices, based on these five components: Conservation agriculture is often equated to minimum or no tillage, ignoring the three other components, and causing confusion in the literature. The application of the five components is taken for granted in large-scale mechanized operations, but not so in smallholder farming situations, where residue return, herbicide application and even fertilizer use are not normal operations. For clarity, I will use the term no-till when only the first component is practiced.
Conservation agriculture represents a fundamental shift from the millennial paradigm: a clear seedbed with crop residues removed (Giller et al. Reference Giller, Witter, Corbeels and Tittonell2009). Rather dogmatically, the FAO (2001) definition states, “as long as a farmer plows at least one crop during the rotation, he does not practice conservation agriculture.” As we will see, occasional plowing is a requisite of some successful conservation agriculture practices in the tropics as well as in the temperate region.
The advantages and limitations of conservation agriculture have been debated not only in the scientific literature (Lal Reference Lal1989, Reference Lal1991, Six et al. Reference Six, Feller, Denef, Ogle, Sá and Albrecht2002c, Giller et al. Reference Giller, Witter, Corbeels and Tittonell2009, Reference Giller, Corbeels, Nyamangara, Triomphe, Affholder, Scopel and Tittonell2011, Palm et al. Reference Palm, Blanco-Canqui, DeClerck, Gatere and Grace2014, Powlson et al. Reference Powlson, Stirling, Gerard, Jat, Palm, Sanchez and Cassman2014, Pittelkow et al. Reference Pittelkow, Liang, Linquist, van Groenigen, Lee, Lundy, van Gestel, Six, Venterea and van Kessel2015) but in policy-oriented publications such as FAO (2001) and World Bank (2012), particularly as a tool to sequester carbon and mitigate climate change. In any analysis it is critical to know which of the five components of conservation agriculture are used.
Crop Yield Decrease
A meta-analysis of 5463 paired observations in 610 studies across 48 crops and 63 countries, including many in the tropics, by Pittelkow et al. (Reference Pittelkow, Liang, Linquist, van Groenigen, Lee, Lundy, van Gestel, Six, Venterea and van Kessel2015) provides an overall view of the effects on crop yields.
When only the no-till component was used, crop yields were 11 percent lower than with conventional agriculture, and this difference was maintained during the first 2 years and became larger when no-till was continuously applied for 10 years or more (Table 6.20). When no-till was combined with residue return, the conservation agriculture yield penalty was reduced to about 5 percent, and when the three components were applied, the difference was reduced to practically nothing. The use of herbicides, something new for many smallholder African farmers, was not evaluated in this meta-analysis.
Table 6.20 Results of the meta-analysis of paired comparisons between the application of various components of conservation tillage versus conventional tillage, which includes residue returns and crop rotation. Adapted from Pittelkow et al. (Reference Pittelkow, Liang, Linquist, van Groenigen, Lee, Lundy, van Gestel, Six, Venterea and van Kessel2015). Mean values and standard deviations (sd). I assume all fields used herbicides and were fertilized.
| Comparisons relative to conventional agriculture (tilled with residues returned plus crop rotation) | Overall | 1–2 years | 10 years + |
|---|---|---|---|
| Crop yield (%, mean ± sd) relative to conventional agriculture | |||
| No-till only | –11 ± 5 | –12 ± 5 | – 20 ± 8 |
| No-till + residues returned | –6 ± 4 | –5 ± 3 | –5 ± 5 |
| No-till + residues returned + crop rotation | –4 ± 2 | –3 ± 2 | –1 ± 3 |
Pittelkow et al. (Reference Pittelkow, Liang, Linquist, van Groenigen, Lee, Lundy, van Gestel, Six, Venterea and van Kessel2015) also found that the negative yield effects were present in ustic soil moisture regimes with only no-till, but became positive (+7 percent) when the three components were applied, probably due to improved soil water retention. They concluded that no-till alone decreases crop yields, but the difference with conventional agriculture is minimized when residues are returned and crops are rotated. In my view, crop residue return is the most critical component because it provides new carbon to the soil as well as year-round crop cover, while the effects of crop rotation are more often related to weed, pest and disease control.
Increases in SOC
SOC clearly increases in the top 10 cm of the soil after 5 to 10 years of continuous zero tillage, particularly if it is accompanied by crop residue return. This occurs because the organic inputs to the soil (residues plus crop roots) decompose to form additional SOC at a rate higher than the decomposition rate of SOC. The rate of SOC decomposition decreases in the absence of tillage. The overall increase in SOC was 325 ± 113 kg C/ha per year under no-till compared with conventional tillage in tropical and temperate regions (Six et al. Reference Six, Feller, Denef, Ogle, Sá and Albrecht2002c), but not linearly with time. For Brazilian Oxisols, Sá et al. (Reference Sá, Cerri, Dick, Lal, Filho, Piccolo and Feigl2001) found that in continuous no-till with full crop residue retention, soil aggregation is rebuilt during the first 5 years, but topsoil SOC does not begin to increase until after that time. Table 6.21 shows this effect. Note that well-managed, conventional agriculture maintained SOC levels, but no-till increased it.
Table 6.21 Changes in topsoil SOC in a Typic Hapludox of Paraná State in Brazil. Adapted from Sá et al. (Reference Sá, Cerri, Dick, Lal, Filho, Piccolo and Feigl2001).
| System | Change in SOC in top 40 cm (t/ha) |
|---|---|
| No-till for 10 years | –4.8 |
| No-till for 20 years | +17.4 |
| No-till for 22 years | +18.9 |
| Conventional tillage for 22 years | –0.1 |
The increase in SOC results in higher biological activity, including that of macrofauna such as earthworms and termites as well as improved nutrient cycling.
Control of Runoff and Erosion
No-till and leaving crop residues partly on the soil surface dramatically decreases runoff and soil erosion. This is the clearest effect of conservation agriculture. Although the data vary, the review by Palm et al. (Reference Palm, Blanco-Canqui, DeClerck, Gatere and Grace2014) indicates that runoff and erosion is reduced by one order of magnitude with conservation agriculture.
Better Water Provision
The large decrease in runoff and erosion losses means that additional water can be stored in the soil with conservation agriculture. Also, the higher SOC content improves soil structure (except in sands and loamy sands), resulting in higher infiltration rates due to more continuous macropores and higher soil moisture content, retained for longer periods. Improved soil structure facilitates earlier planting since the soil is softer and thus easier to plant by no-till.
Soil Compaction
Although plow pans are eventually eliminated by root and macrofauna, no-till planting equipment often compacts the topsoil due to its weight (Blanco-Canqui and Lal Reference Blanco-Canqui and Lal2007). This is the reason why some farmers, although no-till advocates, do occasional deep tillage to ameliorate soil compaction.
Climate Regulation
The increase in topsoil SOC suggests that conservation tillage increases carbon sequestration and thus reduces carbon dioxide emissions to the atmosphere. Nowadays, carbon sequestration by conservation agriculture is considered one of the main pillars of climate-smart agriculture. The review by Palm et al. (Reference Palm, Blanco-Canqui, DeClerck, Gatere and Grace2014) shows considerable variation in carbon sequestration in the top 40 cm due to differences among soils in texture, mineralogy, initial SOM content, the amount of crop residues added (a management variable) and crop-rotation schemes (another management variable). They recommend using the equivalent-soil-mass method and not the equivalent-soil-depth method that is normally used, as well as sampling the soils to at least 40 cm.
Using the equivalent-depth method in soils that have lower bulk density due to no-till may underestimate carbon sequestration under no-till, and sampling to 40 cm may overestimate carbon sequestration in no-till systems because depths of 20–40 cm usually show decreases in carbon content with no-till. Even with the appropriate methodologies, many conservation agriculture systems do not show increased carbon sequestration, while many others show decreases and a few show no change at all (Palm et al. Reference Palm, Blanco-Canqui, DeClerck, Gatere and Grace2014, Powlson et al. Reference Powlson, Stirling, Gerard, Jat, Palm, Sanchez and Cassman2014). Therefore, it is not clear that conservation agriculture leads to increased carbon sequestration.
The addition of large quantities of crop residues often results in nitrogen immobilization for the first few years, and anaerobic conditions in the top few centimeters, necessitating additional nitrogen fertilizers to overcome this; but afterwards, mineralization of soil nitrogen exceeds the immobilization. The initial period may increase nitrous oxide emissions, but the available data do not clearly show the effects of conservation agriculture on nitrous oxide, and also methane emissions (Palm et al. Reference Palm, Blanco-Canqui, DeClerck, Gatere and Grace2014). Therefore, the climate regulation function of conservation agriculture should not be taken for granted. However, the elimination of tilling most of the soil surface saves time, labor and fuel (with lower carbon dioxide emissions from fossil fuels).
The core soil properties, namely texture, mineralogy and SOM, largely determine whether or not conversion from conventional tillage to conservation agriculture is advisable. The vast tropical literature and my own observations are summarized below.
6.8.2 Soils in Which Conservation Agriculture Works
Oxisols, Andisols, Nitisols, Oxic Groups of Ultisols and Alfisols (Ci, Lx Soils in the FCC system), on Gentle Slopes
These strongly aggregated soils are well suited for conservation agriculture. The Oxisol story in the Cerrado ustic savanna of Brazil illustrates this point. The Cerrado began its rapid and successful development in the 1970s. The first two decades focused on overcoming extreme acid soil infertility of the Oxisols, using disk plowing up to 30 cm depth to incorporate lime (González-Erico et al. Reference Gonzalez-Erico, Kamprath, Naderman and Soares1979). Gradually, the soil structure began to deteriorate, plow pans often developed and SOC decreased, while erosion losses and runoff increased (Lopes and Daher Reference Lopes and Daher2008). The large farm size (~1000 ha) aggravated these problems, forcing quick land preparation, leaving the pulverized soil exposed to the first intensive rains of the single rainy season.
Conservation agriculture, using heavy seeding machinery and herbicides, began in earnest, increasing from essentially nothing in 1990 to 11.5 million hectares in 2005. No-till practices reduced soil erosion by 75 percent and runoff by 25 percent, while increasing crop yields (Lopes et al. Reference Lopes, Wietholter, Guilherme and Silva2004, Resck et al. Reference Resck, da Silva, Lopes, da Costa, Lal, Kimble and Stewart2006). A 21-year comparison of several crop rotations in a Typic Hapludox of southern Brazil showed that no-till management systems had more stable aggregates and SOC than conventionally plowed fields; much of the SOC was in the 2 mm macroaggregate size class (Castro Filho et al. Reference Castro Filho, Lourenço, Guimarães and Fonseca2002). No-till planting in Brazil covered about 32 million hectares in 2015 (Motter and Almeida Reference Motter and de Almeida2015).
Still, other barriers remained. Year-round soil cover did not occur because cropland was not used during the 6-month dry season, resulting in weed growth and wind erosion. In lands devoted to grazing livestock, pastures degrade with time, and cattle production declines, with major live-weight losses, during the dry season. Embrapa researchers then developed an integrated crop–livestock system (integração lavoura–pecuária), one of the most intelligent rainfed tropical farming systems, which reached about 700 000 hectares in 2003 (Kluthcouski et al. Reference Kluthcouski, Stone and Adiar2003), over 1.5 million hectares in 2009 (Alfredo Lopes, personal communication, 2010) and 11.5 million hectares in 2017. The system, as I saw in a 1500-ha farm in Baldim, Minas Gerais, in 2008, is fully described in the chapter on livestock (Chapter 18) and summarized below.
Starting from a degraded pasture, farmers plow conventionally, incorporating the necessary amendments and fertilizers down to 30 cm, and planting maize. Seeds of Brachiaria ruziziensis are broadcast over the maize rows. Maize is harvested by small combines, leaving the crop residues on the surface, through which the stoloniferous Brachiaria grows. Cattle start grazing during the dry season, and continue for about 18–24 months. When farmers decide it is time to rotate back to crops, because the pasture begins to degrade, grazing pressure is increased to reduce pasture biomass. Soybeans are then planted with no-till machinery (Fig. 6.28), combine-harvested, and the cycle repeats itself with an average duration of 4 years. By creating a biological superstructure in and over the soil, comprised of deep-root biomass and a constant vegetative cover over the soil surface, a year-round productive land-use system becomes possible. It was remarkable to see well-nourished heifers gaining weight by grazing pastures that had received no rain in 5 months.
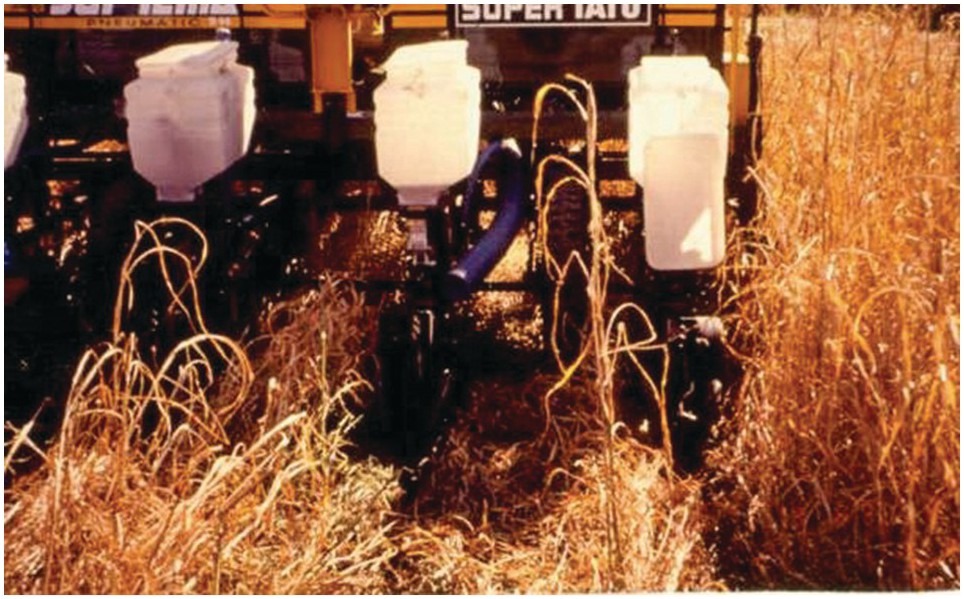
Fig. 6.28 No-till planting of soybeans in pastures, in an Oxisol of Baldim, Minas Gerais, Brazil.
This is intelligent tropical agriculture and what conservation agriculture is all about. Notice that an essential component was to do conventional tillage first, in order to restore soil fertility, which could not be accomplished with strict conservation agriculture guidelines.
In the northern part of the Cerrado, conservation agriculture is practiced at a very large scale. The spectacular Fig. 6.29 shows the simultaneous harvesting of soybeans followed by no-till planting of cotton in Oxisols in Mato Grosso State, Brazil. This is another example of intelligent tropical soil management using conservation agriculture with high capital inputs in Oxisols, which were believed by many to be unsuitable for agriculture (Chapter 3).
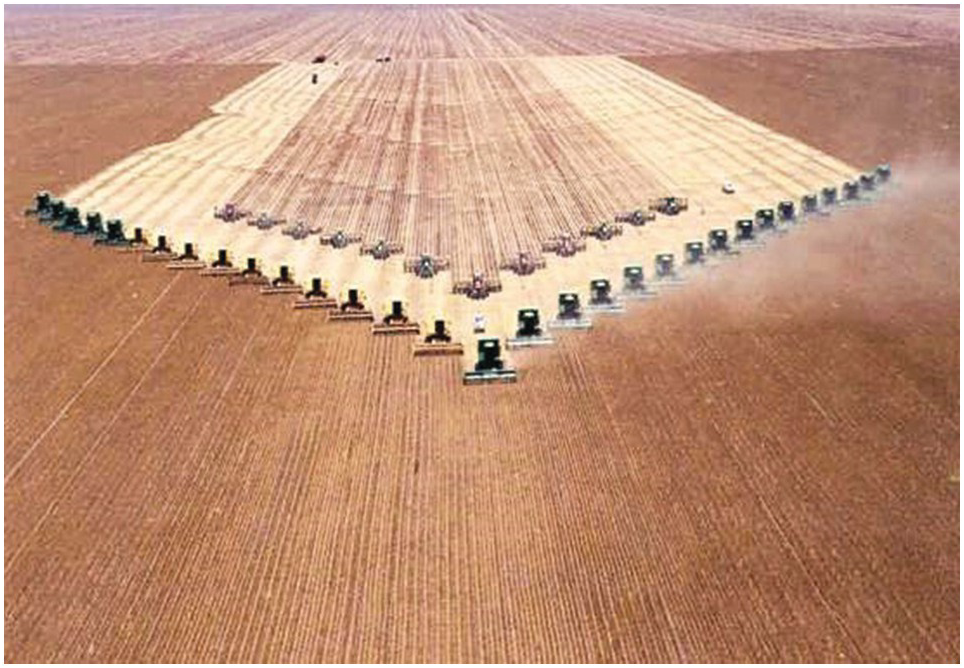
Fig. 6.29 Combine harvesting of soybeans followed by no-till planting of cotton in Oxisols in Mato Grosso, Brazil.
Soils with similar core properties (Ultisols, Oxisols and some Andisols) have also been found to be suitable for conservation agriculture in smallholder tropical farming systems. The conservation agriculture movement has also taken hold in what are called small farms in Latin America (5–20 hectares of cropland), but are really medium-sized from a pan-tropical perspective. Many systems are described by Buckles et al. (Reference Buckles, Triomphe and Sain1998aReference Buckles, Eteka, Osiname, Galiba and Galianob), Eilittä et al. (Reference Eilittä, Mureithi and Derpsch2004) and Goddard et al. (Reference Goddard, Zoebisch, Gan, Ellis, Watson and Sombatpanit2008), most of which occur in two regions, the hillsides of Mesoamerica and the subtropical state of Santa Catarina, Brazil, with adjacent regions of Paraguay.
A remarkable one is abonera, a maize–mucuna relay intercropping system, now widespread in the humid tropical hillsides of Mesoamerica, where the soils are mainly Ultisols (Triomphe and Sain Reference Triomphe, Sain, Eilittä, Mureithi and Derpsch2004). Farmers plant a fallow of Mucuna pruriens (velvet bean, frijol terciopelo) during the first rains, and later maize, using a planting stick in the slashed, thick mucuna mulch at the end of the rainy season. The fast-growing herbaceous legume reestablishes itself though natural reseeding near maize harvest time; it is allowed to regrow but it is always slashed prior to the next maize planting.
Mucuna provides a continuous cover throughout the year, prevents erosion in very steep slopes and controls weeds including the aggressive Rottboellia cochinchinensis. If well established, mucuna fixes nitrogen and reduces labor, and farmers are able to take advantage of the higher prices of the dry-season maize. But if mucuna is not slashed in a timely fashion, it can grow over the maize and increase labor at harvest. Maize yields increased by about 50 percent in these systems (Triomphe and Sain Reference Triomphe, Sain, Eilittä, Mureithi and Derpsch2004).
Loamy, Gravelly Alfisols (LCr+, SL, LC soils)
Loamy, gravelly Alfisols without steep slopes are very common throughout subhumid West Africa and are also suitable for conservation agriculture. In fact, Rattan Lal pioneered no-till research in the tropics in such soils (Lal et al. Reference Lal, Wilson and Okigbo1978, Reference Lal, Wilson and Okigbo1979, Lal Reference Lal, El-Swaify, Moldenhauer and Lo1985, Reference Lal, Lal, Sanchez and Cummings1986, Opara-Nadi and Lal Reference Opara-Nadi and Lal1987, Lal Reference Lal1989, Reference Lal1991, Kayombo and Lal Reference Kayombo and Lal1993, Lal Reference Lal1995, Reference Lal1999). Lal and colleagues observed that conventional tillage in these soils caused rapid runoff, erosion and in some cases compaction, while no-till avoided much of this damage (see Fig. 6.30).
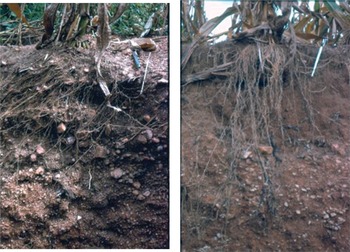
Fig. 6.30 Profiles of the top 30 cm of the same loamy, gravelly Alfisol at IITA, Ibadan, Nigeria, after 6 years of conventional tillage (left) and no-till (right) in Rattan Lal’s plots. Conventional tillage caused the loss of primary soil particles from the topsoil, thus increasing the gravel content. The soil under no-till certainly looks better.
In these gravelly, loamy Alfisols, Lal (Reference Lal, El-Swaify, Moldenhauer and Lo1985) observed that water retention at –10 kPa increased from 14.7 percent to 17.5 percent in the no-till watershed after 6 years of continuous mechanized farming, whereas it decreased from 17.7 percent to 13.8 percent in the plowed watershed, both at 0–10 cm depth.
Entisols and Inceptisols of the Indo-Gangetic Plain
Soils of the Indo-Gangetic Plain, mostly Entisols and Inceptisols, show a broad textural gradient, from sandy soils at the western end in the Pakistani and Indian Punjab, to loamy soils in the middle in Uttar Pradesh, Haryana and Bihar in India and Nepal, to clayey soils in West Bengal and Bangladesh at the eastern end. In the cradle of the Asian Green Revolution, most farmers practice a rice–wheat annual rotation, nowadays with excessive irrigation and excessive tillage that have resulted in yield stagnation, salinization, micronutrient deficiencies and severe aquifer depletion (Gupta et al. Reference Gupta, Naresh, Hobbs, Zheng and Ladha2003). Bhan and Bharti (Reference Bhan, Bharti, Goddard, Zoebisch, Gan, Ellis, Watson and Sombatpanit2008) described the development of no-till plus fertilizer drills for planting wheat into rice stubble. No-till for wheat does away with intensive and repeated plowing of farmers’ fields, is increasing wheat yields, reducing water use by as much as 50 percent and requiring less fuel for running tractors (Harrington and Erenstein Reference Harrington and Erenstein2005). These and other forms of minimum tillage cover 1.9 million hectares in the Indo-Gangetic Plain, about 15 percent of the 13 million hectares under this system in Pakistan, India, Nepal and Bangladesh (Ladha et al. Reference Ladha, Pathak, Tirol-Padre and Gupta2003, Derpsch Reference Derpsch, Goddard, Zoebisch, Gan, Ellis, Watson and Sombatpanit2008).
But the challenge is the rice crop, which is grown in bunded paddies, with land preparation by puddling. Puddling is designed to destroy soil structure in order to decrease water losses by percolation (Sanchez Reference Sanchez1973). Puddled soils of loamy texture often develop a plow pan below the puddled layer, and dry slowly. The clayey ones become hard and difficult to till, either by conventional or conservation tillage. Puddling delays the timing of wheat planting, while waiting for the soil to be at the moisture content appropriate for planting (Sharma et al. Reference Sharma, Ladha and Bhushan2003). This farming system has the paradox of first destroying soil structure to grow rice and then restoring it to grow wheat, all in a 2-month window.
Puddled soils regain their original structure more quickly in sandy soils than in clayey soils. There is little rice yield response to puddling when the soil is able to remain flooded during rice growth (Sanchez Reference Sanchez1973), and there are tradeoffs between the intensity of puddling and weed growth. The more intense the puddling, the greater the weed destruction (Sharma et al. Reference Sharma, Ladha and Bhushan2003). There is more discussion of puddling in Chapter 17.
Unfortunately, most of the rice straw is harvested for livestock feed or burned in situ, and cattle manure is mostly used as fuel for cooking, so there is little crop residue for conservation agriculture. The same happens with the wheat straw.
Conservation agriculture, therefore, must look at the cropping system, with the possibility of eliminating puddling in the soils with good water control, leaving as much rice and wheat stubble on the soil as possible, incorporating no burning practices and using no-till planters, as shown by Bhan and Bharti (Reference Bhan, Bharti, Goddard, Zoebisch, Gan, Ellis, Watson and Sombatpanit2008). Unlike the previous examples, this one is still work in progress at the time of writing.
Loamy and Clayey Alfisols – The Zambian Model
A different form of conservation agriculture is being practiced by over 180 000 small-scale farmers (less than 5 hectares) in the subhumid to semiarid central and southern provinces of Zambia (Peter Aagard, personal communication, 2009). These are areas of gentle topography, which are dominated by loamy to clayey Alfisols, without gravel and with permanent charge. Farmers dig micro-basins with a specially designed implement (Fig. 6.31), laid out in a precise grid that disturbs about 10 percent of the field, thus meeting the definition of conservation tillage. These 30-cm-long basins are dug by hand with hoes, at the start of the dry season, when the soil is still soft. This reduces the labor needs at the busy start of the rainy season, allowing time for early planting and early weeding. The basins catch the first and erratic rains that allow early planting, and are dug up again in following years, becoming a permanent feature of these fields. A variant of the system is using ox-drawn rippers in lines, instead of hand hoeing, for the 10 percent of farmers that own oxen or can hire a tractor equipped with a reaper. In either case, crop residues remain in the field. Improved seeds, precisely placed fertilizers and crop rotations with legumes are also key components of the system.
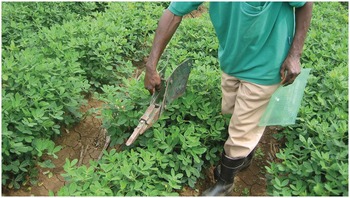
Fig. 6.31 Implement used to dig the permanent planting basins near Shimubala, southern Zambia.
Maize yields increased by 1.5 t/ha, probably doubling the yields under conventional tillage. Haggblade and Tembo (Reference Haggblade and Tembo2003) broke down this yield increase as follows: 0.4 t/ha from early planting; 0.7 t/ha from water harvesting in the microbasins; and the remaining 0.4 t/ha from higher doses of fertilizer and high-yielding varieties. I saw that a nearby farmer who did not use conservation tillage and planted late, with no fertilizer, obtained basically no yield.
The curse of rainfed farms is late planting. By preparing the land during several operations during the dry season, applying the correct amounts of properly placed fertilizers, dry planting before the rains, having the basins to capture rainfall and controlling weeds with a herbicide that does not have a residual effect, these microbasins become permanent. In some systems, the maize is rotated with peanuts or soybeans, leaving the maize stover on top of the soil. This is probably the most practical form of conservation agriculture I have seen in Africa. It meets all five requirements of conservation – minimum tillage, keeping the soil covered, herbicide use, crop rotation and appropriate fertilization. This form of conservation agriculture is another example of intelligent agriculture.
6.8.3 Soils in Which Conservation Agriculture is Difficult
Wet Soils (g Soils)
No-till is not advisable for poorly drained soils that are often waterlogged at the surface (Derpsch Reference Derpsch2005). Puddling, the extreme opposite of no-till, is the main tillage method for paddy soils (see Chapter 17). The purpose of cultivation for wetland rice is the opposite of conservation agriculture: destroy the soil’s structure. This is not applicable to upland rice, where rice is grown under aerobic conditions like any other cereal.
Vertic Soils (v Soils)
Vertisols pose particular challenges because of their hardness while dry, and rapid swelling when the rains start, which often results in waterlogging. In parts of India and Ethiopia, no planting is done on Vertisols during the rainy season; farmers wait until the soil dries, till and then farm on residual moisture (Syers et al. Reference Syers, Penning de Vries and Nyamudeza2001). Tillage is usually done by animal power or tractors. Research in India (Krantz et al. Reference Krantz, Kampen and Virmani1979) and in Ethiopia (Astatke and Jabbar Reference Astatke, Jabbar, Syers, Penning de Vries and Nyamudeza2001) resulted in the development of an oxen-driven broadbed maker that produces shallow (20 cm) furrows for drainage and 80–120-cm-wide beds. Drainage water is channeled downhill. This necessitates farmers in the catchment developing these canals together so no one gets flooded from the field higher up. Excess water can be stored in ponds or microdams. Runoff is halved, while soil erosion is drastically reduced. Wheat yields in Ethiopia with the broadbed and accompanying agronomic technologies have averaged 1.5–3.0 t/ha as compared with the traditional 0.6–0.7 t/ha (Jabbar et al. Reference Jabbar, Mamo, Mohamed Saleem, Syers, Penning de Vries and Nyamudeza2001).
If reduced tillage can be done during the short period when Vertisols are neither too wet nor too dry and hard for the heavy no-till planting machines to operate well, then conservation agriculture is possible, provided that enough crop residues are produced to cover the soil year-round, and the crops are fertilized.
Structurally Inert Soils (SLz Soils)
Conservation agriculture is unlikely to work in soils that develop surface sealing. The ample literature from the Sahel, Botswana and Australia indicates that some form of shallow tillage is necessary to break the crusts and allow water to infiltrate and seeds to emerge. Opening a slit on the soil surface leaves the rest of the soil surface-sealed. In such soils in Senegal, the bulk density of the first few centimeters decreased from 1.6 t/m3 to 1.4 t/m3 with shallow hoe cultivation to break the crusts. With tractor plowing, the same values were reached to a depth of 10–30 cm (Charreau and Nicou Reference Charreau and Nicou1971, Charreau Reference Charreau1972), essentially overcoming hardsetting where it also occurs. Significant crop yield increases were attained. The results are shown in Table 6.22. In these soils, decreases of 0.1 t/m3 in bulk density have a beneficial effect on root development and yields. Root density in the top 20 or 30 cm was closely correlated with grain yields (Nicou Reference Nicou1972).
Table 6.22 Positive crop yield responses to shallow hoe tillage to break the crust in structurally inert sandy Alfisols in Senegal. Adapted from Charreau and Nicou (Reference Charreau and Nicou1971) and Charreau (Reference Charreau1972).
| Crops | No-till | Shallow hoe tillage |
|---|---|---|
| Grain yields (t/ha) | ||
| Sorghum | 1.93 | 2.42 |
| Maize | 2.59 | 3.49 |
| Upland rice | 1.16 | 2.36 |
| Peanuts | 1.45 | 1.77 |
Mounds for Root Crops
Large mounds, up to 40 cm high and 50 cm in diameter, are built to grow yams (Dioscorea spp.) in sandy and loamy Alfisols of humid West Africa, in soils otherwise suitable to conservation agriculture. This requires an enormous amount of manual tillage, and the reason for it is to provide a loose soil for these large tubers to grow, considering the subsoil is often gravelly and clayey. In Nitisols (Rhodic Haplustalfs) of Cuba, the same yams grow well in conventionally plowed and furrowed land, as the soil structure is much better.
6.8.4 Small-Scale Farms in Africa
Considering the wide array of soils where conservation agriculture is feasible, as well as the instances where it is unlikely to work, why has this practice not taken root in smallholder tropical African farms as it has in large swathes of smallholder farms in tropical Asia and Latin America?
Conservation agriculture in smallholder African farms faces three major obstacles: the energy needs of planting equipment, keeping crop residues in the field and the need for herbicides. Results from African research are neither clear nor consistent (Giller et al. Reference Giller, Witter, Corbeels and Tittonell2009). What is clear is that conservation tillage decreases runoff and erosion (Lal Reference Lal, Lal, Sanchez and Cummings1986, Kayombo and Lal Reference Kayombo and Lal1993).
Giller et al. (Reference Giller, Witter, Corbeels and Tittonell2009), in their “heretic” review, indicate several tradeoffs that the smallholder African farmer often has to make to shift to conservation agriculture. Is mulching the most sensible, efficient or profitable use of crop residues? Is there a yield penalty in the short term and a yield gain in the long term? Does conservation agriculture save labor? Does conservation agriculture increase SOM and soil fertility? Also, can they afford herbicides and no-till machinery?
In my view, smallholder African farmers need to obtain no-till planting machinery (ideally the small ones used in southern Brazil, some of them pulled by cattle), keep at least half of the crop residues in the field and shift from hand weeding to herbicides. Farm service companies can rent suitable equipment to smallholders. In fact, there is an “Uber”-like company that rents farm equipment to smallholder farms in Tanzania (Cheryl Palm, personal communication, 2017).
The results of Aagard’s (Reference Aagard2009) southern Zambia model shows that it can be done in farms of 1–5 hectares and taken up at scale, avoiding the need to purchase no-till planting machinery. The labor required to plant by hoe (Fig. 6.16) or to make ridges and furrows every year (Fig. 6.17) is so deeply ingrained in farmers with 1 hectare or less that only a comprehensive effort will be effective. One that addresses not only tillage, but crop residue use, crop rotation and herbicide and fertilization, with a financial stimulus package to cover the additional costs and probably the initially lower yields.
Farmers get paid for soil conservation in many rich countries as an ecosystem service. Certainly the millions of smallholder African farmers can benefit in a similar way.
Conservation agriculture is a major and positive paradigm shift in world agriculture, and the larger farms of the tropics are already benefiting. The challenge is for the smallholder farmers to benefit as well.
6.9 Summary and Conclusions
Soil texture, mineralogy and soil organic matter (SOM) control most physical soil processes.
The overarching management principle is to keep the soil covered throughout the year with a vegetative layer.
Soil Depth
The most obvious physical limitation – insufficient soil depth for adequate root development – is often ignored. Physical barriers to root development are probably less common in the tropics than in the temperate region.
Soil Temperature
Extreme soil temperatures, either too high or too low, are a limiting factor in certain areas of the tropics. The solution is usually to mulch with various materials, depending on whether temperatures need to be decreased or increased. Plastic mulches are increasingly used.
Soil Structure
Soil structure is the size, shape and arrangement of solids and voids, the continuity of voids and their capacity to retain and transmit air and water.
Water-stable aggregates give soils a good structure. Aggregates are generally grouped in two sizes: macroaggregates (> 250 μm), with macropores between them, generally larger than 50 μm in diameter, which drain gravimetric water; and microaggregates (50–250 μm), with micropores ranging from 0.2 to 50 μm in diameter, which hold water at –10 kPa to –1500 kPa of soil moisture tension. These micropores, therefore, hold most of the water available to plants.
Texture, mineralogy and SOM determine soil aggregation. In sandy and loamy sand textures (< 15 percent clay), the primary particles tend to remain single-grained because the large macropores between them make microorganisms rapidly respire away organic inputs as carbon dioxide, instead of decomposing them slowly to form SOM by binding the primary particles into aggregates. It takes loamy textures (15–35 percent clay) and clayey ones (> 35 percent clay) to make water-stable aggregates.
The highly aggregated structure of Oxisols, Andisols and oxidic families of Ultisols and Alfisols presents tremendous advantages and serious disadvantages. The very stable aggregates that are coated with oxides and SOM extend the time period of land preparation because they drain gravitational water, much like sands. Strong aggregation also diminishes compaction and erosion problems. The disadvantages lie in the low range of available moisture of these soils in spite of their capacity to hold large quantities of water at high tensions inside the aggregates. Many clayey Oxisols are actually “droughty” soils, and leaching in these soils is considerable.
Ultisols and Alfisols that are not oxidic have a less stable structure that presents different management problems. Exposure and cultivation can lead to soil compaction, runoff and erosion. The moisture range suitable for tillage operations is narrower than in the case of Oxisols. On the positive side, many of these soils hold more available water in their profiles than do Oxisols.
Structurally inert Alfisols with high fine-sand and silt content, low SOM and kaolinitic clay mineralogy (z soils in the FCC system), typical of many semiarid areas, behave very differently from other Alfisols, developing surface sealing that impedes rainfall infiltration and causes major runoff.
The fourth large group of tropical soils consists of loamy to clayey soils with permanent-charge mineralogy, classified as Vertisols, Aridisols, Mollisols and many Entisols and Inceptisols. Among them, Vertisols present special physical limitations due to shrinking and swelling and their narrower moisture range that is suitable for tillage operations. Management practices developed in the temperate region for such soils should be applicable, with a minimum of adjustment, to tropical soils with permanent-charge mineralogy.
Soil Compaction
Soil compaction is a major problem in the tropics because of excessive tillage, overgrazing and even foot traffic. The major forms are surface sealing and crusting, hardsetting and plow pans.
The structurally inert Alfisols are very susceptible to surface sealing when wet and to crusting when dry. Surface sealing and crusting prevents seedling emergence, sharply reduces infiltration, decreases water storage in the soil and triggers runoff and hence erosion. Unlike other kinds of soil compaction, surface sealing is largely due to raindrop impact.
Hardsetting occurs when much of the entire soil profile becomes very hard as it dries, such that it is virtually impossible to cultivate until it is rewetted. Hardsetting in a cultivated soil usually involves slumping and an increase in bulk density, without the application of an external force, making this process a unique form of natural soil compaction. Hardsetting happens mainly in soils that have few water-stable aggregates.
Tillage and farm machinery traffic can also induce subsoil compaction in the form of a plow pan. The depth of the pan varies from 10 cm to 60 cm and is usually several centimeters thick. Plow pans can develop in most tropical soils except Vertisols, where shrinking and swelling through the profile prevents their formation.
Soil Water
The differences in structure among broad types of tropical soils result in dramatic differences in their water-retention properties. Sandy soils empty their pores of gravitational water at tensions close to –10 kPa, while soils with smectitic clays do this at –50 kPa. This is what is traditionally known as “field capacity,” but the tensions vary from the classic 0 kPa to –30 kPa definition.
The moisture-retention pattern of a clayey, well-aggregated Oxisol is a hybrid of these two. These Oxisols hold as much water as smectitic clays, up to approximately –10 kPa, but drain their macropores at about that tension, thus reaching field capacity as sands do. Oxisols act like sands at low tensions because of their strong, sand-sized macroaggregates, but hold water like smectitic clays at higher tensions. Therefore, they have a narrower available water range than other clays. The most commonly accepted definition of Oxisol field capacity is about –10 kPa.
Soil Erosion
Soil erosion is often the most visible evidence of land degradation and is a major problem in much of the tropics. Soil erosion by water is a function of five factors: rainfall erosivity, soil erodibility, slope gradient and length, soil cover and protective structures such as terraces. Rainfall erosivity is generally higher in the tropics than in the temperate regions because higher air temperatures provide more energy.
Soils dominated by low-activity clays and iron oxides (Oxisols, Ultisols) as well as allophane (Andisols) have generally lower soil erodibility than soils with high-activity clays (Aridisols, Mollisols, Vertisols). The most erodible soils are soils with 40–60 percent silt content, uncommon in the tropics.
Land degradation in many policy studies equals soil erosion. To our shame, many economists use the straight soil-loss data from the Wischmeier plots as representative of real conditions at the field, watershed and even national scales. Most soil scientists know well that this methodology overestimates or sometimes underestimates erosion losses due to the small size of these plots. But what is eroded from one spot is most frequently deposited in another one in the same field or watershed, often leading to no losses at those scales. Soil erosion, therefore, is better estimated at the watershed (catchment) scale.
Soil and Water Conservation Practices
Soil conservation practices are generally of two types: providing protective barriers against erosion and keeping a vegetative cover over the soil. Planting along the contours, instead of up and down the slope, is a sound practice, but the advantage of contour cultivation is more evident for steep slopes. Planting trees or stoloniferous grasses along the contour provides effective barriers against erosion. “Biological terraces” are produced by the erosion process within the contour hedges, with the tree or grass growth keeping up with the higher soil surface at the lower end – something stone bench terraces cannot do. Steep backslope terraces (fanya juu) are effective and widespread in East Africa. Ridge and furrow systems, including tied ridges and trench bunds, when laid along the contour, hold water for a longer time in most soils.
When cropland is next to hills or scarps, the potential for capturing runoff and storing it in the subsoil can be very significant. Water can be channeled using stone bunds and percolation ponds, where water is stored in the subsoil and recovered by shallow wells downstream. Another major source of rainfall capture are the ditches along roads.
The restoration of gullied lands involves larger-scale efforts – stone and gabion check dams. They successfully capture sediments and prevent new gullies from being formed that could threaten current fields. Gully bottoms are generally fertile and are often planted.
Conservation Agriculture
Conservation agriculture is based on five components: minimum or no tillage, crop residue return, herbicide use, crop rotation and appropriate fertilizer use. Conservation agriculture is often equated to minimum or no tillage (no-till), ignoring the other four components, and causing confusion in the literature. Recent analyses suggest that conservation agriculture does not always provide the benefits that are widely publicized.
Oxisols, loamy and clayey Alfisols, Ultisols, Andisols and many Inceptisols and Entisols are suitable for conservation tillage, provided they are not poorly drained. Conservation agriculture is very difficult to do in wet soils, vertic soils and in soils susceptible to surface sealing (g, v and z soils in the FCC system).
When only the no-till component is used, a meta-analysis found that crop yields were 11 percent lower than with conventional agriculture. When no-till was combined with residue return the conservation agriculture yield penalty was reduced to about 6 percent, and when the three components were applied, the difference was reduced to practically nothing after 10 years. The two remaining components, herbicide use and adequate fertilization, were practiced uniformly in this meta-analysis.
Crop residue return is the most critical component because it provides new carbon to the soil as well as year-round soil cover, while the effects of crop rotation are more often related to weed, pest and disease control.
Soil organic carbon (SOC) increases in the top 10 cm of the soil after 5 to 10 years of continuous zero tillage, particularly if it is accompanied by crop residue return.
The increase in SOC under conservation agriculture results in higher biological activity, including that of macrofauna such as earthworms and termites, as well as improved nutrient cycling. Plow pans are eventually eliminated by root and macrofauna activity. However, the heavy no-till planters sometimes cause soil compaction. Occasional deep tillage is often needed to eliminate compacted layers.
No-till and leaving crop residues partly on the soil surface decreases runoff and soil erosion by at least 10 times. This is the clearest effect of conservation agriculture. The large decrease in runoff and erosion losses means that additional water can be stored in the soil with conservation agriculture.
Carbon sequestration by conservation agriculture is considered one of the main pillars of climate-smart agriculture. The data, however, do not provide a clear trend, due to considerable variation in carbon sequestration in the top 40 cm due to differences in texture, mineralogy, initial SOM content, the amount of crop residues added and crop rotation schemes. Data on nitrous oxide and methane emissions do not show a clear trend either. Therefore, the climate regulation function of conservation agriculture cannot be taken for granted.
Conservation agriculture works well in many large-scale mechanized farms, but it is generally difficult to implement in smallholder farms, which lack sufficient crop residue return and do not use herbicides. Nevertheless, there are successful conservation agriculture systems practiced in small farms of Central America and in southern Zambia.