


Background
In the past few decades, China has experienced profound socioeconomic transformation that includes, but is not limited, to rapid economic growth, increased urbanisation and migration, transformed family structure and an enhanced social welfare system. Among these, economic growth is particularly striking, as gross domestic product has increased from 367.9 billion in 1978 to 90 030.9 billion in 2018. A positive outcome is that the population who live in extreme poverty have reduced from near 240 million in 1978 to 16.6 million in 2018. China has contributed over 70% of the global total achievement on poverty reduction.Reference Way1 Despite this tremendous achievement, poverty alleviation is still an important issue for China, as new structured poverty traps have been created alongside the dramatic improvement. Poverty reduction for vulnerable groups such as people with mental illness has become even tougher.Reference Li and Bai2 Instead of relying further on development, China has stepped into an era of targeted poverty alleviation.Reference Li, Su and Liu3
Impact of severe mental illness on poverty
Compared with other vulnerable groups, people with severe mental illness (SMI) may be even more disadvantaged because of stigma and higher social stress.Reference Trani, Bakhshi, Kuhlberg, Narayanan, Venkataraman and Mishra4 SMI is characterised as mental, behavioural or emotional disorders that can result in serious functional impairment. Commonly, SMI includes schizophrenia and mood disorders (e.g. major depressive disorder and bipolar disorder), which are leading causes of disability.Reference Ran, Weng, Yujun, Zhang, Yu and Peng5,Reference Liu, Zhang, Pang, Li, Chen and Zheng6 Evidence strongly suggests that people with SMI are at increased risk of drifting into or remaining in poverty because of reduced productivity, increased medical costs, stigma and loss of employment-associated earnings.Reference Lund, De Silva, Plagerson, Cooper, Chisholm and Das7 Meanwhile, a negative impact because of SMI also occurs at the household level, especially in societies that rely on the role of families in patient care.Reference Hulme, Moore and Shepherd8 Having a family member with SMI is associated with treatment costs, caregiving and income loss.Reference Patel, Araya, Chatterjee, Chisholm, Cohen and De Silva9 In general, those households are less likely to benefit from the trickle-down effect of external development.Reference Ran, Weng, Yujun, Zhang, Yu and Peng5,Reference Norton10
The most recent nationwide data from the China Mental Health Survey showed the weighted prevalence of any disorder (excluding dementia) in China was 16.6%, with the lifetime prevalence of schizophrenia and any mood disorder being 0.6 and 7.4%, respectively.Reference Huang, Wang, Wang, Liu, Yu and Yan11 Data regarding poverty among people with SMI is scarce in China. A survey suggests that there are 11.7 million adults with a mental disability, and around 38.2% of them are poor.Reference Li, Pang, Du, Chen and Zheng12 Available data to show how many families have been affected by SMI and to what extent is rarer. What is known is that, according to the National Bureau of Statistics, the rate of social participation for people with SMI has declined in recent years to less than 50%. Given deep-rooted family collectivism,Reference Xu and Xia13 a broad impact of SMI on a household's economy may exist, and should be explored and addressed.
Aims
Although household poverty among people with SMI has been documented in many studies,Reference Patel, Araya, Chatterjee, Chisholm, Cohen and De Silva9,Reference Lund, Breen, Flisher, Kakuma, Corrigall and Joska14 few of them has been conducted in China's development context or taken a dynamic perspective to view changes over time. Applying data from an ongoing mental health project in a less developed area of China, the objectives of this study were: (a) to examine the poverty trends of households containing people with SMI in the context of general socioeconomic development, and (b) to explore the reasons behind such changes. Consequently, this study compares different poverty measures for households containing people with SMI at two time points, and assesses the effects of growth and equity on those changes.Reference Maasoumi and Mahmoudi15 Then, we test the relevant factors at each time points and compared their relative roles. This study may provide clues about household poverty in people with SMI during a period of development, thus providing evidence for further integration of mental health recovery and targeted poverty alleviation.
Method
Data source
This study was based on data from the Chengdu Mental Health Project (CMHP), an ongoing project on mental illness and mental health services in Xinjin county, Chengdu that started in the early 1990s. Data for this study were derived from two epidemiological mental health surveys in the same six townships of Xinjin county in 1994 and 2015.
In this study, SMI included schizophrenia and mood disorders. The ICD-10Reference Ran, Yang, Liu, Huang, Mao and Lin16 was applied as the diagnostic tool in both rounds of mental health surveys. The survey in 1994 covered a population of 123 572 (≥15 years old) and diagnosed 711 people with SMI (schizophrenia: n = 515; mood disorders: n = 196). Another round of the survey in 2015 covered a population of 152 776 (≥15 years old) and revealed a total of 1042 people with SMI (schizophrenia: n = 671; mood disorders: n = 371).
Detailed methods regarding the two surveys have been described elsewhere.Reference Ran, Weng, Yujun, Zhang, Yu and Peng5,Reference Ran, Yang, Liu, Huang, Mao and Lin16,Reference Ran, Yu, Peng, Liu, Zhang and Hu17 Briefly, both surveys were completed in two steps. First, the Psychoses Screening ScheduleReference Ran, Weng, Yujun, Zhang, Yu and Peng5 was completed in face-to-face interviews with household heads to identify potential individuals with mental disorders. Key information from village doctors and neighbours was also considered. Second, trained psychiatrists conducted a comprehensive general psychiatric interview with the person with a potential mental disorder for further diagnosis. The instruments employed in the survey in 2015 were modified based on those used in 1994 and some new variables such as social welfare, stigma and social support were added. The measurement of most variables selected for use in the present study were the same in 1994 and 2015. The ICD-10 was applied as the diagnostic tool in both rounds of surveys.
These surveys were approved by the University Human Research Ethics Committee. All research participants provided informed consent after receiving a complete description of the study.
Chengdu is a provincial city in Western China. Compared with first-tier cities, it is less developed. Nevertheless, the surveyed county has also experienced huge development during the past few decades. In 1994, when the CMHP group conducted the first survey, Xinjin county was a representative middle-income rural county in Southwestern China. It had shifted to being one of the most favoured places for investment in Western China when the CMHP group conducted the second survey in 2015. According to the data from local National Bureau of Statistics, the residential income in Xinjin has experienced substantial growth, with per capita disposable income increased from 4014 Chinese yuan (CNY) (urban residents) and 1757 CNY (rural residents) in 1994 to 31 637 CNY (urban residents) and 18 492 CNY (rural residents) in 2015. The development of Xinjin is an epitome of China, thus it is representative to achieve the abovementioned research objectives.
Analytic strategy
Poverty in this study refers to monetary poverty. Households with a reported annual income per capita lower than the poverty standard were defined as poor. The minimum living standard in Xinjin, defined by the Chengdu government, was applied as the poverty standard; these were 850 CNY and 5400 CNY, respectively, for the years 1994 and 2015. The standard in 1994 was adjusted based on that of the 2015 Consumer Price Index (CPI). Analysis in this study includes: (a) comparison and decomposition of poverty; and (b) regression analysis.
First, household income and poverty at two time points were compared. The well-known Foster-Greer-Thorbecke (FGT) poverty indexReference Foster, Greer and Thorbecke18 was applied, in which poverty was broken down into three aspects: breadth (P0); depth (P1) and severity (P2). P0 describes the headcount ratio of poor households, P1 describes the gaps between poverty status of poor households and the poverty standards and P2 describes the status of the poorest poor among the group. The FGT index synthesised the idea of poverty breadth, depth and severity in one equation as illustrated in equation (1), in which xi represents the per capita income of a household i, n is the total number of households, z is the poverty line and α (≥ 0) is the degree of aversion to inequality.
 $$P_\alpha = \displaystyle{1 \over n}\sum\limits_{i = 1}^q {{ ( {{z-x_i} \over z} ) }^\alpha } {\rm} = \displaystyle{1 \over n}\sum\limits_{i = 1}^n {[ {\lpar \displaystyle{{z-x_i} \over z}\rpar }^\alpha I\lpar x_i \lt z\rpar \rsqb } \comma \;$$
where
 $$I\lpar x_i \lt z\rpar = \left\{{\matrix{ {1\comma \;} & {if\,x_i \lt z} \cr {0\comma \;} & {if\,x_i \ge z} \cr } } \right.$$
All poverty measures of P0, P1 and P2 in 1994 and 2015 were compared, and the changes were further decomposed using a widely applied static decomposition method.Reference Datt and Ravallion19,Reference Mishra20 In this decomposition, a poverty measure Pt at date t is characterised in terms of the poverty line (z), the mean income of the distribution (ut) and the Lorenz curve (Lt), which represents the relative income inequalities. Pt is written as equation 2:
 $$P_t = P\lpar \displaystyle{z \over {u_t}}\comma \;L_t\rpar $$
Correspondingly, the growth component of change is defined as the change in poverty because of a change in mean income while holding the Lorenz curve constant at some reference level Lr. The redistribution component means a change in poverty because of the change in the Lorenz curve while the mean income remains constant at the reference level ur, thus the growth effect and redistribution effect on changes in poverty can be decomposed as equation 3:
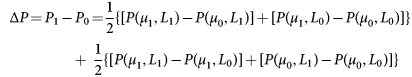 $$\eqalign{& \Delta P = P_1-P_0 = \displaystyle{1 \over 2}\lcub \lsqb P\lpar \mu _1\comma \;L_1\rpar -P\lpar \mu _0\comma \;L_1\rpar \rsqb + \lsqb P\lpar \mu _1\comma \;L_0\rpar -P\lpar \mu _0\comma \;L_0\rpar \rsqb \rcub \cr & \hskip-1.7pc {\kern 1pt} {\kern 1pt} {\kern 1pt} {\kern 1pt} {\kern 1pt} {\kern 1pt} {\kern 1pt} {\kern 1pt} {\kern 1pt} {\kern 1pt} {\kern 1pt} {\kern 1pt} {\kern 1pt} {\kern 1pt} {\kern 1pt} {\kern 1pt} {\kern 1pt} {\kern 1pt} {\kern 1pt} {\kern 1pt} {\kern 1pt} {\kern 1pt} {\kern 1pt} {\kern 1pt} {\kern 1pt} {\kern 1pt} {\kern 1pt} {\kern 1pt} {\kern 1pt} {\kern 1pt} {\kern 1pt} {\kern 1pt} {\kern 1pt} {\kern 1pt} {\kern 1pt} {\kern 1pt} {\kern 1pt} {\kern 1pt} {\kern 1pt} {\kern 1pt} {\kern 1pt} {\kern 1pt} {\kern 1pt} {\kern 1pt} {\kern 1pt} {\kern 1pt} {\kern 1pt} {\kern 1pt} {\kern 1pt} {\kern 1pt} {\kern 1pt} {\kern 1pt} {\kern 1pt} {\kern 1pt} {\kern 1pt} {\kern 1pt} {\kern 1pt} {\kern 1pt} {\kern 1pt} {\kern 1pt} {\kern 1pt} + {\kern 1pt} {\kern 1pt} {\kern 1pt} \displaystyle{1 \over 2}\lcub \lsqb P\lpar \mu _1\comma \;L_1\rpar -P\lpar \mu _1\comma \;L_0\rpar \rsqb + \lsqb P\lpar \mu _0\comma \;L_1\rpar -P\lpar \mu _0\comma \;L_0\rpar \rsqb \rcub } $$
After this, both linear and logistic regressions were performed to estimate the roles of relevant factors. For the purpose of comparison, the same variables in 1994 and 2015 were selected. Variables selected for regressions were based on literature review and data availability. Evidence showed that variables that might influence the income and poverty status of households included ability to work, physical health status, disability level, household size, social support and caring burden for people with SMI.Reference Vigo, Thornicroft and Atun21–Reference Chiou, Chang, Chen and Wang25 Household size was defined as the number of people who ‘eat from the same pot or live in the same residential unit’, as reported by the respondents.Reference Hulme, Moore and Shepherd8
Given the different socioeconomic development level of each township, household location might also differentiate household poverty among people with SMI.Reference Arndt, Hussain, Jones, Nhate and Tarp26 Based on available data-sets, four blocks of variables were put in the regressions analysis, which included (a) patient's sociodemographic characteristics (i.e. age, gender, marital status and education); (b) competence-related indicators (i.e. diagnosis of SMI, duration of mental illness, ability to work, physical illness and disability level), (c) the household-level factor (i.e. household size) and (d) household location (i.e. the townships in which these households resided).
Results
Sociodemographic characteristics
Table 1 shows participant's sociodemographic and clinical characteristics at different time points (1994 and 2015). In 1994, there were 515 (72.4%) people with schizophrenia and 196 (27.6%) people with mood disorders. In 2015, there were 671 (64.4%) people with schizophrenia and 371 (35.6%) people with mood disorders. More people with mood disorders were included in this study in 2015 than 1994 (P < 0.001).
Table 1 Sociodemographic and clinical characteristics of people with severe mental illness in 1994 and 2015
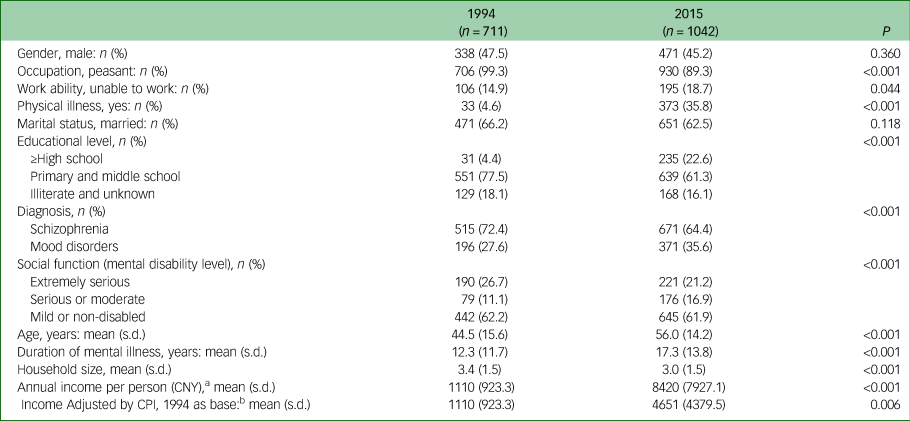
CNY, Chinese yuan; CPI, Consumer Price Index.
a. The per capita disposable income increased from 4014 CNY and 1757 CNY in 1994 to 31 637 CNY and 18 492 CNY in 2015 for urban and rural residents, respectively, in Xinjin county.
b. Adjusted by CPI, the income for urban and rural residents in 2015 were 17 479 CNY and 10 216 CNY, respectively.
There were substantial changes in the characteristics of people with SMI and their households in Xinjin county. Compared with households containing people with SMI in 1994, participants in 2015 had a significant lower proportion of people who were peasants (P<0.001), although the proportion of peasants was still very high (89.3%). There was also a higher proportion of people who were unable to work (18.7%, P < 0.05), with physical illness (35.8%, P < 0.001), who had attained a higher level of education (22.6%, P < 0.001), as well as a lower rate of people with extremely serious mental disability (21.2%, P < 0.001). In addition, participants in 2015 were significantly older and had a longer duration of mental illness than those in 1994 (P < 0.001).
The household size in 2015 was significantly smaller than that in 1994 (P < 0.001). The annual household income per person had increased significantly from 1110 CNY in 1994 to 8420 CNY in 2015 (P < 0.001). Adjusted for the CPI, the annual household income per person in 2015 were 4651 CNY, which was significantly higher than that in 1994 (P < 0.01). The annual disposable income for urban and rural residents in Xinjin in 1994 and 2015 are reported as a footnote in Table 1. For both years, the annual income for households with people with SMI was lower than that of the rural average in Xinjin.
Household income and inequality in 1994 and 2015
Figure 1 illustrates the income distributions among households containing people with SMI in 1994 and 2015. The income distribution curve in 2015 appears on the far right in Fig. 1(a), showing that the household income per capita in 2015 was much higher than that in 1994 and also after adjustment for CPI. However, the distribution of wealth in 1994 adjusted by the poverty standard in Fig. 1(a) crossed with that in 2015 at the cumulative household ratio of around 50%, which means the economic status of near 50% of households were worse than their counterparts when the poverty standard was considered. In other words, the income inequality in households containing people with SMI has increased in 2015. Figure 1(b) further demonstrates the income inequality with the Lorenz curve. Compared with 1994, the distribution of cumulative income in 2015 deviated further from the diagonal line.

Fig. 1 Household income distribution of people with severe mental illness in 1994 and 2015.
Changes in household poverty and its decomposition
Table 2 shows the changes in household poverty for different measures. The proportion of poor households, as measured by the headcount ratio (P0), increased significantly from 29.8% in 1994 to 39.5% in 2015 (P < 0.001). A significant rise in P1 (P < 0.05) from 7.5 to 11.8 indicated the average income of poor households had decreased. Although P2 – the indicator of poverty severity – had also increased from 3.8 to 6.8, the test of difference was not significant (P = 0.102).
Table 2 Changes in poverty (P) measures and the decomposition of people with SMI, 1994–2015
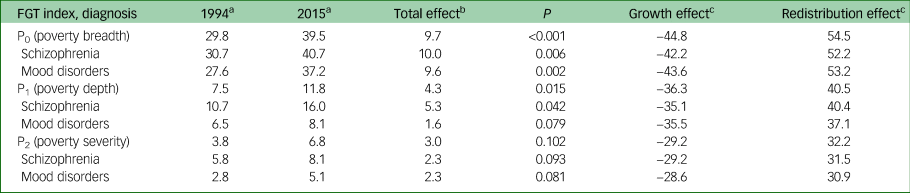
FGT, Foster-Greer-Thorbecke.
a. All calculated values have been multiplied by 100.
b. Total effect equal to the rise of P (n = 0, 1, 2) in 2015, compared with that of 1994. The P-value is the significance test of each poverty measure in 1994 and 2015. The test was adjusted by the degree of freedom (d.f.), sampling weight and household size.
c. In the decomposition, positive values indicate poverty growth whereas negative ones indicate poverty alleviation.
In terms of household poverty by diagnosis of SMI, in general, poverty faced by households of people with schizophrenia was worse at both time points, as all numbers for P0, P1 and P2 were larger than those for people with mood disorders. Meanwhile, the increase in P0 and P1 were also larger for people with schizophrenia.
Growth and redistribution had contributed differently for the abovementioned changes in poverty, as all numbers on growth effect were negative while they were positive in the column for redistribution effect (Table 2). Increased income inequality (i.e. redistribution effect) was the main reason behind the deterioration in poverty levels from 1994 to 2015 for those households containing people with SMI. For example, an 11.9% increase in P0 could be explained by a pure growth effect of −42.6% and a pure redistribution effect of 54.5%. In other words, if growth had not changed, the redistribution in 2015 would have increased the household poverty ratio by 54.5%. Compared with the redistribution effect, values on growth effect were negative but smaller.
Factors associated with household poverty in 1994 and 2015
Table 3 shows the results of regression analysis for household income and poverty status. Patient's educational attainment, diagnosis of SMI, duration of mental illness and household location in different townships were not significantly associated with household poverty in both 1994 and 2015 (P>0.05). Instead, age and the household size had a salient relationship with household poverty at both time points (P < 0.05). Specifically, younger patients and a larger family size had a significant positive relationship with higher household income and being above the poverty line. Households with patients who were male, unmarried and severe mentally disabled were worse off. Patient's ability to work was a factor that was only significant in 2015, as being unable to work was associated negatively with household income and status of above the poverty line (P < 0.001).
Table 3 Associative factors for household income and poverty status in 1994 and 2015
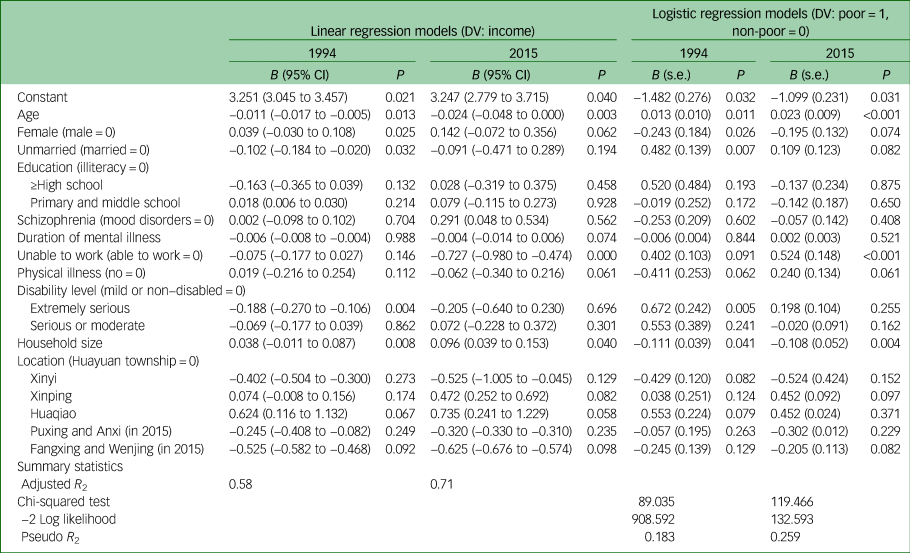
DV, dependent variable; non-poor, above the poverty line.
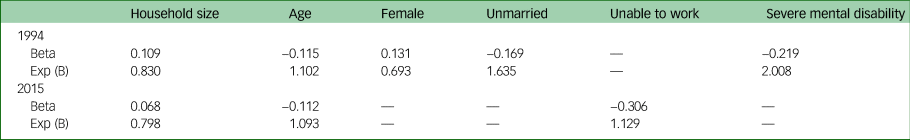
Table 4 illustrates the standardised coefficient (i.e. beta) and the odds ratio (i.e. Exp (B)) for the significant associative factors with household poverty that are detailed in Table 3. In 1994, having a person with severe mental disability in a household was the most important factor explaining household poverty (B = −0.219 and Exp (B) = 2.008 for the status of being severe mentally disabled), followed by a patient's marital status, gender, age and the household size. The most important factor that was associated with household poverty in 2015 was patient's ability to work (B = −0.306 and Exp (B) = 1.129 for the status of being unable to work), followed by a patient's age and the household size. Household size was the least significant factor at both time points.
Table 4 Standardised coefficient and odds ratio of significant factors in 1994 and 2015
Discussion
Main findings
This study provides a profile of changes in poverty in households containing people with SMI in the context of China's rapid socioeconomic development. To the best of our knowledge, this is the first attempt to study changes in household poverty in people with SMI over a long time span (1994–2015). Our findings suggested that although mean income was significantly higher in 2015 for households of people with SMI (P < 0.01), wealth distribution had also become more unequal, as the Lorenz curve in 2015 deviated further from the line that represented equal wealth distribution. This study adds to evidence demonstrating increased income inequality along with general raised mean income in China.Reference Xie and Zhou27 Not only did the income gap between the households of people with SMI and other households increase,Reference Ran, Yu, Peng, Liu, Zhang and Hu17 but also the income inequality within this unique group has increased.
The results of this study show that the situation regarding levels of poverty faced by households containing people with SMI in 2015 was even worse than that faced by their counterparts in 1994; all measures on poverty breadth, depth and severity were higher. This is inconsistent with China's general context of poverty reduction.Reference Montalvo and Ravallion28 Further static decomposition suggested that the anomaly was rooted in increased income inequality, as all changes in poverty measures were dominated by the redistribution effect. The growth effect had contributed negatively to poverty deterioration but it was insufficient to off-set the role of income inequality. It indicates that poverty among people with SMI is not likely to be alleviated automatically through promoting fast growth. Instead, increased inequality alongside economic growth has further aggravated poverty in the households contain people with SMI. These findings are consistent with earlier views of an association between poverty and inequality.Reference Maasoumi and Mahmoudi15 To achieve the goal of reducing poverty requires strong, country-specific combinations of both growth and distribution policies.Reference Perry, Lopez, Maloney, Arias and Servén29
Eradicating poverty
Although the poverty trends for households containing people with SMI were not optimistic, the results of this study indicated that poverty severity (P2) had not increased significantly from 1994 to 2015. In other words, the poorest poor among people with SMI had not fallen further below the poverty line. This may be partly explained by basic social welfare supplies for such households, include the basic living allowance, subsidy for disabled people and endowment insurance that matches with disability assessment.Reference Yang and Wu30
Further targeted poverty alleviation programmes are still needed to reduce poverty, especially its breadth and depth. Poverty measures in this study are also helpful in estimating the size of resources needed to ‘eradicate’ poverty.Reference Cerqueti and Ausloos31 If policy implementation was possible to perfectly allocate resources to the poor, then, in 2015 a total amount of 0.65 million CNY (P1 × the poverty line × surveyed population) would have been needed to raise the income of all poor households of people with SMI above the poverty line in Xinjin county.
Relevance of dependency ratio
Apart from knowing how socioeconomic development had shaped the trends in household poverty, regression analyses were employed to reveal possible factors that related to household poverty at different times among these unique households. Larger household size and younger age of people with SMI had salient positive relationship with better income and a non-poor status of a household in both the years of 1994 and 2015. This may be explained by the dependency ratio of a household that contains people with SMI. SMI can restrict a person's labour productivity and, in this case, larger household size may lower the dependency ratio of those households thus maintaining a relative higher income.Reference Mitra, Posarac and Vick24 Similarly, patients with SMI of younger age may have not become the main income earner of a household thus their influence on household poverty may be relatively smaller.
For older people with SMI, the caregiving burden for patients may overlap with elderly care, a situation in which caregiving may result in a higher dependency ratio. What really matters for household poverty may be the dependency ratio rather than the household size or the age of the patient.Reference Sikander and Ahmed32
Gender, marital status and severity of illness
The results of this study showed that being male, being unmarried and severe mental disability were positively associated with household poverty in 1994. The reason for gender differences may be that a labour force of men is more important in a rural agricultural areas,Reference Alesina, Giuliano and Nunn33 which was the context of Xinjin in 1994, thus the negative impact associated with men with SMI was more severe. The association between patient's status of being unmarried and household poverty can be partly explained by social support that linked tightly with marriage in Chinese rural culture. Without marriage, the social network for reciprocating favours and income earning could have been restricted.Reference Kleinman and Kleinman34 Patients from low-income families might be disadvantaged in marriage.Reference Li35 This may also be one reason that explains the association between marriage and household poverty.
After 21 years of development, Xinjin county had been transformed from a rural agriculture-dominated county into one of the most favoured places for investment in Western China. The role of gender and marital status of people with SMI were insignificant in the new context of 2015. Because of basic social welfare, the association between mental disability and household poverty, which was the strongest association in 1994, was also insignificant in 2015. The new additional significant factor in 2015 was a patient's ability to work. Again, this can be explained by the dependency ratio of a household, as being unable to work means a higher dependency ratio. In the previous rural context (i.e. 1994), work ability cannot differentiate household income because the labour supply in rural areas was more likely to be redundant, meaning that many people may not have been employed.Reference Ge and Yang36 Whether a person with SMI can work or not in a rural context may not be as important as in the current context of urbanisation. In the current context, although the majority of people with SMI were still working in farming, those with the ability to work may search for extra part-time work opportunities.
Social development theory and SMI
Although China has achieved remarkable economic growth and an impressive record of poverty reduction over the past four decades, poverty, especially relative poverty, still remains a key challenge.Reference Ran, Weng, Yujun, Zhang, Yu and Peng5,Reference Li, Luo and Sicular37 The results of this study also support the social development theory of people with mental disorders,Reference Ran, Weng, Yujun, Zhang, Yu and Peng5 that is, social development has a strong impact on the pace and direction of poverty changes for people with mental disorders. Currently, China has the national strategic aim of targeted poverty alleviation.Reference Li, Su and Liu3 However, no specific, targeted antipoverty policies have been formulated for households containing people with SMI. This study provides solid evidence that shows how overall social prosperity has contributed to poverty deterioration for those households containing people with SMI. Formulating policies to alleviate poverty in households with people who have SMI and improving mental health recovery for people with SMI should be a priority for China in the context of the millennium development goals.Reference Skeen, Lund, Kleintjes, Flisher and Consortium38
Implications
There are two major policy implications of this study. First, given that the trickle-down effect of economic growth, which highlights overall economic growth or increasing, is ineffective in tackling poverty resulting from income inequality, further redistribution policies should be formulated to narrow income gaps. At the very least, poverty severity (P2) should be further lowered and eradicated through targeted social welfare programmes. In addition, lowering poverty breadth (P0) and depth (P1) should also be considered.
Second, the impact of SMI on household economic status, as has been illustrated in this study, requires further antipoverty policies to be formulated for both people with SMI and their families. On the one hand, policymakers should seriously consider how to strengthen the current mental health system, especially community-based mental health services for people with SMI, which are essential for them to improve work and other social functions.Reference Griliches and Hausman39 On the other hand, the integration of mental health recovery and precise poverty alleviation programmes and culture-specific family interventions to empower the whole family should also be a focus.Reference Ran, Yang, Liu, Huang, Mao and Lin16,Reference Ran, Yu, Peng, Liu, Zhang and Hu17 For example, taking the dependency ratio of a household into consideration and formulating differentiated antipoverty strategies.
Limitations
The limitations of this study include the following. First, this study is rooted in the Chinese context of rapid socioeconomic development in the recent quarter of a century, and is based on a strong culture of family collectivism, therefore the results of this study may not be fully applicable to other upper-middle-income countries or those societies with strong individualism and weak family care.
Second, studying trends with only two time points separated by 20 years is also a limitation, as what has happened in between these time points is not included. Considerable variations may also exist due to differences in the measures used between the two rounds of surveys, which can be a problem for studies that analyse changes.Reference Griliches and Hausman39 Third, regression analysis in this study was applied to two waves of cross-sectional data; a causation relationship cannot be verified using this approach. Further studies may benefit from adopting a longitudinal design to examine the exact role of SMI on poverty and changes over time.
Fourth, because of limitations of the data some important variables for analysing household poverty such as family structure and dependency ratiosReference Giesbert and Schindler40 were not included. Future studies should include more household-level factors as control variables.
Finally, only data for people with SMI were available for this research. Therefore, this research cannot reveal the level of poverty faced by households that did not contain people with SMI, or the general population. Further studies should be conducted to explore household poverty that includes both households with and without people with SMI.
In conclusion, this study has generated evidence that shows how conditions of poverty can worsen in the context of social prosperity. Household poverty, especially relative poverty, among people with SMI is not likely to be alleviated automatically within the process of socioeconomic development. Instead, growth has resulted in an increased income inequality and further aggravated poverty for households containing people with SMI. Our conclusions support the need for more intense and targeted antipoverty policies and programmes for households containing people with SMI. Targeted antipoverty policies and programmes should be developed for all people including those with SMI who are in absolute and relative poverty, and these policies and programmes are crucial for achieving the strategic goal of Healthy China 2030.Reference Ran, Yu, Peng, Liu, Zhang and Hu17
Data availability
The data are not publicly available because they contain information that could compromise the privacy of research participants.
Acknowledgements
The authors thank all the collaborative institutes (Xinjin Second People's Hospital, Chengdu Mental Health Center, Sichuan Veterans Hospital, Jingzhou Mental Health Center, Guangyuan Mental Health Center, Santai Mental Health Center, Sichuan College of Traditional Chinese Medicine, Southwest Medical University, Chongqing Medical University, Chengdu Mental Hospital, Panzhihua Mental Health Center) and the Chengdu Mental Health Project study group for collaboration, support and data collection.
Author contributions
M.-S.R. designed and conducted the study. Y.-H.Y. conducted the major analysis. M.-S.R. and Y.-H.Y. wrote the first draft of the paper. Critical revision of the manuscript: M.-S.R., Y.-H.Y., Y.G., G.T., C.L.W.C. Data collection: M.-S.R., B.L., M.-X.H., X.Y., B.L., C.L.W.C. All authors participated in the discussions of the revisions of the paper.
Funding
The mental health survey in 1994 was supported in part by a grant from the China Medical Board in New York (CMB, 92-557). The mental health survey in 2015 was supported in part by Seed Funding Programme for Basic Research (HKU, 2014-2016), Seed Funding Programme for Applied Research (HKU, 2014-2016), Strategic Research Theme (SRT): Contemporary China Seed Funding (HKU, 2014-2016) and Mental Health Research in Chengdu, China (Dept. Matching Fund, 2015-2017).
Declaration of interest
None.
ICMJE forms are in the supplementary material, available online at https://doi.org/10.1192/bjo.2020.95.


 Open access
eLetters
No eLetters have been published for this article.