


Introduction
Digital holographic microscopy (DHM) has been recently gaining acceptance as an efficient method for studying micron-sized objects, such as living cells (Cotte et al., Reference Cotte, Toy, Jourdain, Pavillon, Boss, Magistretti, Marquet and Depeursinge2013; Lee et al., Reference Lee, Kim, Jung, Heo, Cho, Lee, Chang, Jo, Park and Park2013; Donnarumma et al., Reference Donnarumma, Rawat and Brodoline2018b; Park et al., Reference Park, Depeursinge and Popescu2018; Zuo et al., Reference Zuo, Sun, Li, Asundi and Chen2020). Although the spatial resolution of DHM currently used in practice is approximately 100 nm, the three-dimensional (3D) morphology of target samples can be conveniently visualized without any pretreatments, such as staining. Furthermore, the inner structures of living cells can also be distinguished by DHM based on optical information such as the refractive index (RI) of each pixel of the obtained data (Kemper et al., Reference Kemper, Kosmeier, Langehanenberg, von Bally, Bredebusch, Domschke and Schnekenburger2007; Belashov et al., Reference Belashov, Zhikhoreva, Bespalov, Vasyutinskii, Zhilinskaya, Novik and Semenova2017; Bohannon et al., Reference Bohannon, Holz and Axelrod2017; Frometa et al., Reference Frometa, Moreno, Ricardo, Arias, Muramatsu, Gomes, Palacios, Palacios, Velazquez, Valin and Ramirez2017). Bianco et al. (Reference Bianco, Pirone, Memmolo, Merola and Ferraro2021) successfully analyzed fractal geometry of microplastics in polluted water, thus demonstrating a unique application of DHM.
With regard to observing biological samples using DHM, observations of animal cells, including red blood cells (RBCs), have been intensively demonstrated by various researchers (Doblas et al., Reference Doblas, Roche, Ampudia-Blasco, Martinez-Corral, Saavedra and Garcia-Sucerquia2016; Grzhibovskis et al., Reference Grzhibovskis, Kramer, Bernhardt, Kemper, Zanden, Repin, Tkachuk and Voinova2017; Donnarumma et al., Reference Donnarumma, Brodoline, Alexandre and Gross2018a; Funamizu & Aizu, Reference Funamizu and Aizu2019; O'Connor et al., Reference O'Connor, Shen, Liang and Javidi2021). Observation of microorganisms such as diatoms, which are major photosynthetic planktons, and diatomites, which are fossils of diatoms, has also been intensively reported (Xu et al., Reference Xu, Jericho, Meinertzhagen and Kreuzer2001; Zetsche et al., Reference Zetsche, El Mallahi and Meysman2016; Memmolo et al., Reference Memmolo, Carcagni, Bianco, Merola, da Silva, Goncalves, Ferraro and Distante2020; MacNeil et al., Reference MacNeil, Missan, Luo, Trappenberg and LaRoche2021). For example, 3D RI tomograms of phytoplanktons, including Navicula, Pseudo-nitzschia, and Thalassiosira, were reported by Lee et al. (Reference Lee, Kim, Mubarok, Panduwirawan, Lee, Lee, Park and Park2014). Recently, Zetsche et al. (Reference Zetsche, Larsson, Iversen and Ploug2020) analyzed the flow and diffusion around and within diatom aggregates. Memmolo et al. (Reference Memmolo, Carcagni, Bianco, Merola, da Silva, Goncalves, Ferraro and Distante2020) succeeded in classifying diatom species by analyzing DHM images using machine learning.
However, sample preparation methods for biological DHM studies have not been well established yet. Many previously used protocols in published research involve target objects for observation being deposited on a glass substrate, or in a glass chamber, without any additional treatment (Baczewska et al., Reference Baczewska, Eder, Ketelhut, Kemper and Kujawinska2021). Some procedures involve filling the glass substrate/chamber with certain glues to optimize the conditions of the samples. Hence, we recognize a huge demand for establishing a wide range of sample preparation methods for diverse research purposes.
In this study, we present a new sample preparation procedure for biological DHM studies. The sample preparation procedure used generally for DHM observation is shown in the diagram on the top (Fig. 1a). In the generally used procedure, samples such as cell suspensions or microbeads are added dropwise on a glass substrate/chamber and then observed by DHM. This procedure is effective for many types of samples; however, this procedure requires the samples to be in the form of solutions or suspensions. In the usual method as shown in Figure 1a, the structure of the diatom frustule is broken up in the process of preparing it in solution, and it cannot be observed in an unseparated state. The target objects, frustules, in the case of our experiments, were pretreated on a mica surface. Next, the mica was placed in reverse in a glass chamber (Tomodish), which was filled with 1% sodium dodecyl sulfate (SDS). This procedure enabled the pretreated target objects to be transferred from the mica surface to the glass chamber without losing their pretreated structures (Fig. 1b). The frustules can thus be clearly observed using DHM with their structural integrity being preserved. We believe that our sample preparation method can be applied to DHM-based observations of various target objects, not limited to frustules. Our new method reported in this paper will contribute to expanding the options for pretreatment methods that were lacking in the study of DHM observation.

Fig. 1. Schematic view of the proposed method. (a) Typical method for DHM sample preparation: solutions or suspensions are directly deposited onto a glass substrate or into a glass chamber. (b) Proposed method for the pretreatment of samples: The target objects are pretreated on a mica surface. The mica is placed in reverse in a glass chamber (Tomodish), which is filled with 1% sodium dodecyl sulfate solution to transfer the objects from the mica surface to the glass chamber.
Materials and Methods
Nitzschia sp. were collected from Okinoshima Island in the Chiba Prefecture and subcultured several times using Guillard's (F/2) culture medium (G9903; Sigma-Aldrich, Munich, Germany) with Daigo artificial seawater (395-01343; Nihon Pharmaceutical, Tokyo, Japan) for approximately 2 months (Murase et al., Reference Murase, Kubota, Hirayama, Kumashiro, Okano, Mayama and Umemura2011, Reference Murase, Kubota, Hori, Hirayama, Mayama and Umemura2012; Umemura et al., Reference Umemura, Sadoya, Nagao, Oikawa, Hanada, Sugioka and Mayama2015; Ide et al., Reference Ide, Matsukawa, Miyashiro, Mayama, Julius and Umemura2020; Shoumura et al., Reference Shoumura, Hamano, Hanada, Mayama and Umemura2020; Hamano et al., Reference Hamano, Shoumura, Takeda, Yamazaki, Hirayama, Hanada, Mayama, Takemura, Lin and Umemura2021).
Purification of diatom frustules was carried out using nitric acid (Ming et al., Reference Ming, Meng and Wang2007; Sakuma et al., Reference Sakuma, Hori, Hayashida, Mayama and Umemura2013; Van Eynde et al., Reference Van Eynde, Hu, Tytgat, Verbruggen, Watte, Van Tendeloo, Van Driessche, Blust and Lenaerts2016). The artificial seawater from cell suspensions was replaced with pure water by centrifugation (3,000 rpm, 5 min, 5 times). A quantity of concentrated nitric acid four times as that of the cell suspension was added for removing any organic components. The mixture was incubated for 40 min at 95°C. After incubation, an amount of potassium nitrate measuring a cupful of a medical spoon was immediately added to the cell suspension and diluted with pure cold water on ice. Then, nitric acid was removed by centrifugation (3,000 rpm, 5 min, 7 times). The suspension thus obtained was stored in a refrigerator as a frustule suspension.
The DHM samples were prepared using the following different procedures:
To observe the aforementioned chemically purified frustules, 20 μL of the suspension was added dropwise into a Tomodish (Tomocube Inc., Daejeon, South Korea). The suspension was diluted with pure water, when required. The upper side of the Tomodish was sealed with a coverslip.
To obtain the baked diatom samples, cleaved mica was immersed in culture medium containing living cell suspension and incubated for 2–3 weeks. Glutaraldehyde (GA) was added to the culture medium (final concentration 1%). The medium was then incubated for 1 h at room temperature. The mica substrate was then rinsed with pure water and baked for 4 h at 600°C (Umemura et al., Reference Umemura, Noguchi, Ichinose, Hirose, Kuroda and Mayama2008, Reference Umemura, Noguchi, Ichinose, Hirose and Mayama2010). For DHM observation of the baked samples, 20 μL of 1% SDS was added dropwise into a Tomodish; next, the mica substrate was reversed and placed on the SDS droplet in the Tomodish. After 10 min of incubation, the mica substrate was removed, and a coverslip was placed in the Tomodish. Using this process, frustules were detached from the mica surface and added dropwise onto the Tomodish surface.
For sputtered frustules, an aliquot of the chemically purified frustule suspension was added dropwise onto a cleaved mica surface and air-dried. Several frustules could be observed at a magnification of 100 μm2 by means of optical microscopy. The samples were sputtered using MSP-1S (VACUUM DEVICE Inc., Ibaraki, Japan) with a gold–palladium (Au–Pd, 4:6) target. The sputtering operation periods were set as 2, 4, 6, 8, and 10 min. The specification of the instruments constrained the maximum setpoints for one operation to 2 min. Therefore, operations with longer periods were achieved by repeating 2 min operations. For example, in the case of a 10 min operation, a 2 min operation was repeated five times. The first minute of any operation was dedicated to establishing a vacuum for the operation; thus, the actual discharge period for any operation was one minute lesser than the specified period. This makes the actual sputtering periods to be 1, 2, 3, 4, and 5 min. The sputtering current was 34 mA. Bare frustules were also prepared as a control. The DHM observation of the sputtered samples was performed by transferring the frustules to the Tomodish, as was done for the baked frustule samples.
All DHM observations were performed using a commercially available DHM (HT-2, Tomocube Inc., Daejeon, South Korea). Water droplets were inserted between the lenses and the Tomodish. The laser for the DHM observation had a wavelength of 532 nm and a power of 0.05 mW. The field of view (FOV) and exposure period were 40.816 μm and 0.971 ms, respectively. All the experiments were repeated three times; thus, 21 frustules were observed for each sputtering condition. The DHM data were analyzed using TomoStudio (Tomocube Inc., Daejeon, South Korea). The RI of pure water was assumed as 1.333.
Results and Discussion
This study found that pretreated diatom frustules on a mica substrate were easily observed using DHM by transferring them to the chamber with 1% SDS while preserving their structure. First, the maximum intensity projection (MIP) image observed by DHM shown in Figure 2a1 is a frustule purified by the usual method shown in Figure 1a. The MIP image displays the projection surfaces of the 3D data from an arbitrary viewpoint. The maximum values in the projection path are indicated on the projection surface. The nanoporous structures of frustules were also resolved at the edge of the frustule, although the resolution was obscure. A white particle seen in the frustule might have been a remnant of organic components. Figure 2b1 shows a typical MIP image of the baked frustule prepared by our method. In this sample, living diatom cells were deposited on a mica surface with 1% GA. After GA fixation of the cell, the mica surface was rinsed with water to remove excess GA. The mica substrate was then baked for 4 h at 600°C. Finally, the mica substrate was reversibly placed on a Tomodish, which was filled with 1% SDS solution, to transfer the baked frustules into the Tomodish. These techniques form our proposed procedure. This method allowed for the baked frustules to be well observed by DHM (Figs. 2b1, 2b2). In this case, most frustules were observed as unseparated structures comprising two parts, as indicated with arrows in Figure 2b2. A 3D image illuminated with two colors is shown in Figures 2a and 2b. The parts shown in gold had an RI ranging between 1.3400 and 1.3600. The frustules were well visualized in this RI range. The solvent (water) had an RI below 1.34. The RI range of the parts shown in violet was greater than 1.3600. Thus, the differences between the parts shown in gold (frustule) and the parts shown in violet were clearly identified by this RI analysis. Figures 2c1 and 2c2 show scanning electron microscopy (SEM) images of the purified frustules.
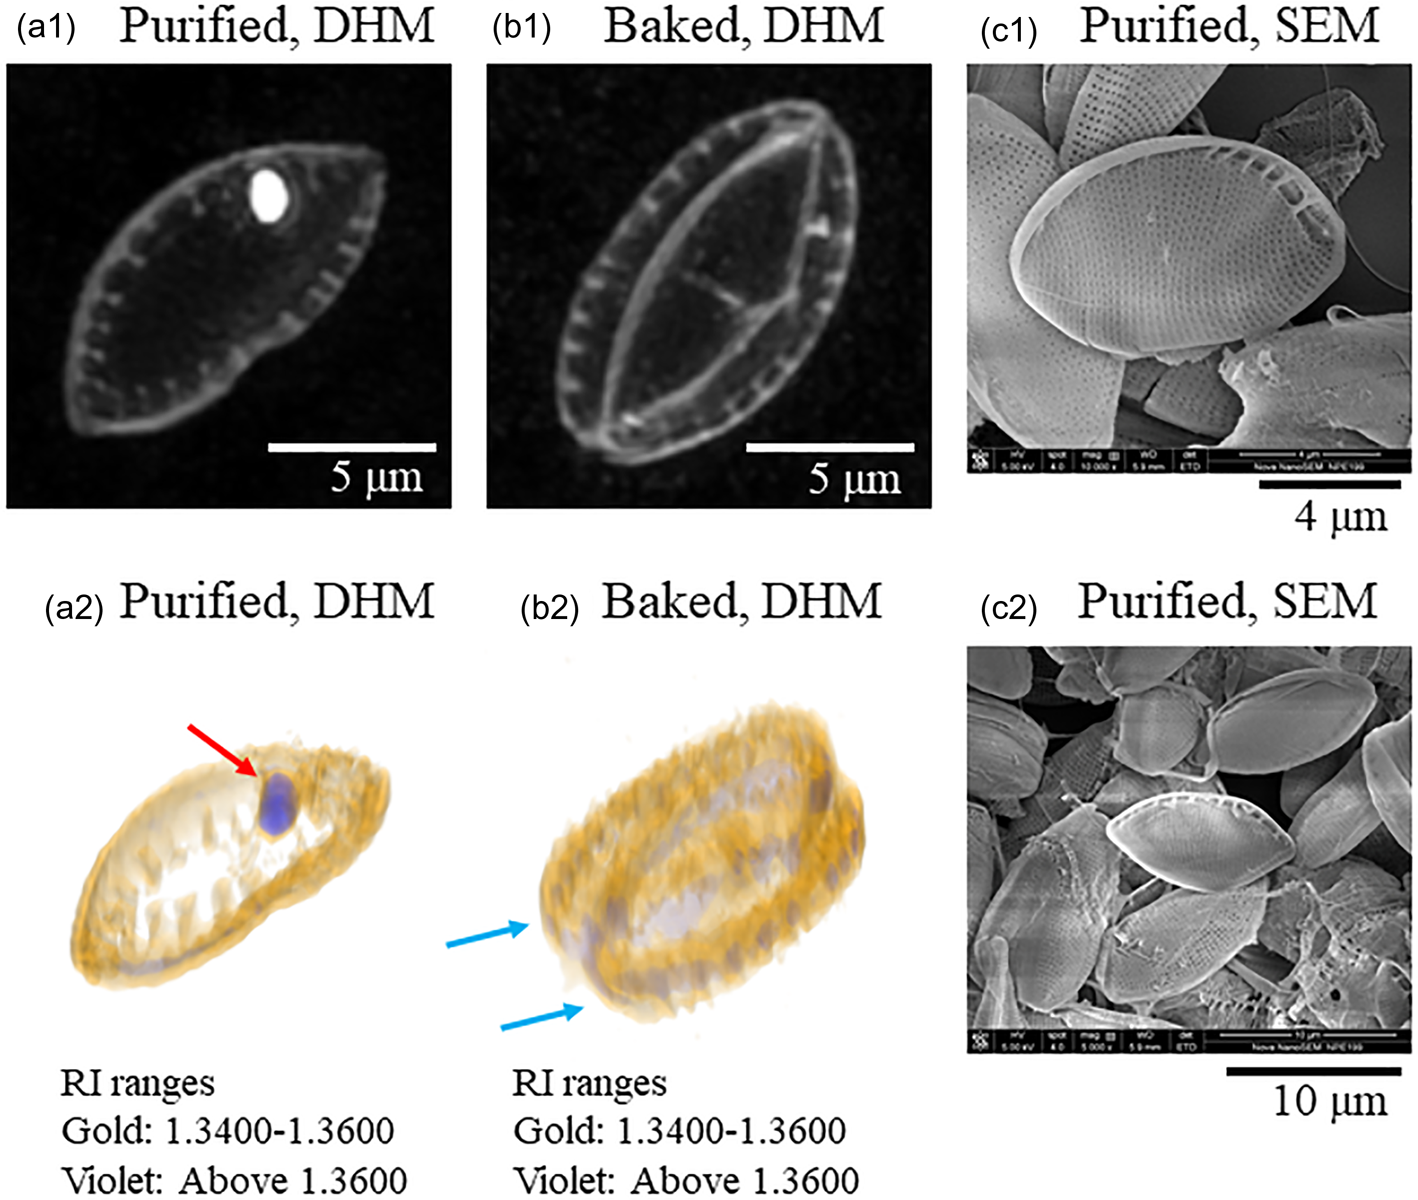
Fig. 2. Digital holographic microscopy (DHM) and scanning electron microscopy (SEM) images of purified and baked diatom frustules. (a1) A maximum intensity projection (MIP) image of a purified frustule. (a2) A three-dimensional (3D) image of a purified frustule. Gold: RI range 1.340–1.360. Violet: RI range above 1.360. Arrows indicate parts having high RI values. (b1) An MIP image of a baked frustule. (b2) 3D image of a baked frustule. Arrows indicate two parts of the unseparated frustule.
In general, diatom frustules consist of several components. The major parts are called the epitheca and hypotheca, which are observed to be positioned facing each other. During cell division, new epithecae and hypothecae are produced and separated into two cells. Chemical purification of the frustules leads to their loss of the combined structure. In the case of observing purified frustules, a single epitheca or hypotheca was observed in most cases, although there were some exceptions. Five DHM images of purified frustules are shown in Supplementary Figure S1a. Among the five different frustules, only one frustule was seen to have combined structures. On the other hand, in the case of baked frustules, the combined structures were well observed in many cases, although there were some exceptions. Five independent examples are presented in Supplementary Figure S1b. Among the five independent frustules, only one was seen to be separated. Therefore, we consider our method to be effective for observing the combined structures of frustules using DHM.
Figure 3a shows a schematic diagram of the sputtered treatment newly reported in this study. The purified frustules were placed on a mica surface and dried. The mica surface was then sputtered with an Au–Pd target. After this procedure, the mica was placed in reverse on a Tomodish filled with 1% SDS in order to transfer it to the sputtered frustules. Figure 3b shows a typical MIP image of the sputtered frustules. Frustules were smoothly moved to Tomodish. When pure water was used instead of 1% SDS, the transfer did not work well. In the case of the sputtered frustules, flares caused by laser scattering on the metals were observed in the 3D images (Fig. 3c). The number of flares seen gradually increased owing to the sputtering periods (Supplementary Fig. S2a). Thus, our report is the first to visualize the state of MIP and 3D images around the frustule at different sputtering periods. Since it was difficult to maintain the frustule structure and control surface modification with metal by the usual method, the state of frustule that could be observed was limited. When pretreatment is possible with our method, DHM expands the possibility of observing frustules in various states. In addition, this method can be applied not only to frustules but also to other cells, which will greatly contribute to the study of DHM observation.

Fig. 3. Schematic representation and digital holographic microscopy images of sputtered frustules. (a) Schematic representation of sputtering of purified frustules. (b) A maximum intensity projection (MIP) image of a sputtered frustule. (c) A three-dimensional (3D) image of a sputtered frustule.
Conclusion
In this study, we have proposed a new sample preparation method for DHM observation of biomaterials. When target objects, such as cells or microarchitectures, are functionalized or modified on a solid substrate surface using our proposed method, the pretreated objects can be easily transferred to a glass chamber using a surfactant and clearly observed in liquid by using DHM. We expect our proposed method to have a wide range of applications in DHM techniques for observing various microscopic biomaterials.
Supplementary material
To view supplementary material for this article, please visit https://doi.org/10.1017/S1431927622012508.
Financial support
This study was financially supported by JST SICORP Japan (grant number JPMJSC19E1).
Conflict of interest
The author(s) declare none.


 Open access