


The Skelton Glacier is located in the region from lat. 78° to 79° S. and long. 160° to 163° E., between the Worcester and Royal Society Ranges of the Great Antarctic Horst (Fig. 1). It is one of the many glaciers connecting the high Victoria Land Plateau to the western part of the Ross Ice Shelf. The elevations of the Skelton Glacier vary from 84 m. above sea-level near Teall Island on the Ross Ice Shelf to over 2,300 m. in the upper névé field. Unlike most other glaciers along the western side of the shelf, the lower part runs nearly north and south, though ice flow in the névé region is toward the east and south-east. The glacier has three source areas. Two are névé fields separated by the Neve and Halfway Nunataks and Clinker Bluff. The third supply is from the short, steep cirque glaciers of the Worcester and Royal Society Range peaks.
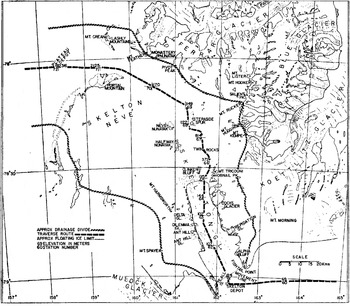
Fig. 1. Skelton Glacier and neighboring areas
During the 1958–59 Victoria Land Traverse operations, the plateau was reached in November 1958 through the Skelton Glacier along the trail of the Trans-Antarctic Expedition. During the ascent of the glacier, 12 major geophysical stations were occupied where seismic, gravity, magnetic and glaciological studies were made. In addition, other sites were occupied for intermediate gravity and elevation observations. Included in the studies were detailed measurements of ice thicknesses, water depths, absolute movement and relative movement along a 16 km. line across the mouth of the glacier at Site 61 near Teall Island, where the ice is floating; and two movement studies at Site 66 on the north-east branch of the upper grounded glacier at an elevation of 372 m. The return of the traverse party from the plateau was made along the same route in January 1959, two months later, and a complete resurvey was made of all movement stakes at that time. Additional data were obtained by the 1959–60 Victoria Land Traverse in October 1959 on the absolute movement of Site 61 and on the snow accumulation at various sites.
The cross-section of the glacier from Teall Island to Fishtail Point, shown in Figure 2, was obtained from 7 seismic stations. The ice thickness varied from 490 to about 600 m., with the ocean floor depth from 837 to 1,592 m. below sea-level, well below the ice which is grounded only at the ends quite close to the rock outcrops. The area of the vertical cross-section is 9.233 × 10⁶ m.2.

Fig. 2. Cross-section along movement line, Skelton Glacier
In Figure 3 the displacement vectors are plotted at the point of their respective stakes in plan view. In Figure 4 the two components of displacement and the elevations of the stakes are plotted against the distance across the glacier. These data are taken from the complete resurvey made in January 1959, 68 days after initial survey. Data obtained in October 1959 show an absolute movement 8 per cent larger, and have been used in the final calculations of ice flow.

Fig. 3. Displacement vectors along movement line, Skelton Glacier
A small glacier flowing down the slopes of Teall Island influences the west side of the movement profile as seen in Figure 3. The ice from Teall Island is deflected southward by the greater mass of the Skelton Glacier within less than a kilometer of the island and in Figure 4 is seen to cause the transverse velocities to be asymmetrical on the western side.
The very high increase of down-glacier velocity near the valley wall at Teall Island can be seen from the graph of the components of displacement in Figure 4. The values of the gradients of velocity with respect to the cross-glacier distance are given below for the first four kilometers from the valley wall:
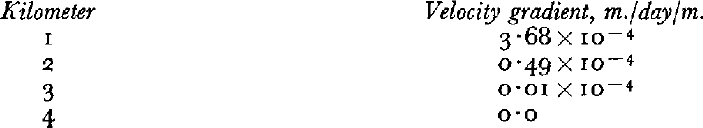

Fig. 4. Elevation profile and displacement components along movement line, Skelton Glaciers
Thus, for the most part, the floating Skelton Glacier seems to be moving as a solid block with nearly constant velocity. From a numerical integration of the curve of down-glacier component of displacement the average velocity was determined for the east half, the west half and the entire glacier. These three average velocities, corrected for the factor of 1.08, which represents the increase in absolute velocity at Site 61 using the complete 345 days. instead of the 68 days, are: 0.213 m./day for the east side, 0.273 m./day for the west side and an average of 0.243 m./day or 88.7 m./year for the entire glacier. The line of stakes. makes an angle of 75° with the glacier axis. Correcting for this angle, the volume of ice that flows annually from the Skelton Glacier is 791 × 106 m.3. Using an average density of 0.90, this represents a water equivalent of 712 × 106 m.3.
At Site 66, the absolute value of movement at the surface was determined by changes in the horizontal angles to several mountain peaks to be 12.7 m. for the 55 days, or a yearly flow of 75 m. From seismic sounding results the ice thickness at Site 66 is 803 m. The effective width of the glaciers here is about 4.5 km. Assuming an average ice thickness equal to that measured at the station, and a factor of 0.9 to get total column flow from surface flow, the volume of ice moving out of this branch of the glacier would be 245 × 106 m3, about one-third of the total volume found at the mouth of the Skelton.
Accumulation figures in the Skelton Glacier area are available from stakes located at three sites during the 1958–59 operations, and measured by the traverse crew of the 1959–60 season. At Station 59 (lat. 79° 05′ S., long. 165° 38′ E.), on the Ross Ice Shelf about 70 km. east of Teall Island, the accumulation was 52 cm. of snow in 273 days, or an annual water equivalent of 25 cm. Across the movement line at Site 61 near Teall Island, the variations were extremely large, ranging from 60 cm. of snow accumulation close to Teall Island to an ablation of 7 cm. on the eastern side of the glacier. The average obtained for the glacier surface here is 6 cm. of water equivalent per year. At the upper plateau in a line of stakes running west from Site 72, accumulation over 378 days was 29 cm. of snow, or an annual water equivalent of 11 cm. Representative accumulation on the Ross Ice Shelf as obtained from annual layering evident in the pits at 24 sites was 17 cm. water equivalent,Reference Boyd 1 and average elevation was 66 m.2 Discounting the 6 cm. obtained on the glacier surface near Teall Island as not typical of the average accumulation of the area feeding the Skelton, the assumption is made that the 17 and 11 cm. values above represent accumulation at elevations of 66 and 2,300 m. respectively. From upper atmosphere information obtained at the McMurdo Station and furnished by the U.S. Weather Bureau Meteorological Research Unit, the moisture content of the atmosphere varies nearly linearly with altitude in this elevation range. If a linear change of accumulation with elevation is used, and elevations estimated for the various areas of Figure 1 west to Site 72 contributing to the flow of ice past Teall Island, an average annual accumulation of 12.9 cm. water equivalent is obtained for the total area of 7,880 km.2, or a total annual deposition of 1,018 × 106 m.3. If the assumption is made that the lower areas of the Skelton between long. 160° and 163° E. lose 30 per cent of this estimated accumulation to the Ross Ice Shelf from strong katabatic winds, the above figure would be reduced to the 712 × 106 m.3 observed. The excessive accumulation found at Station 59, and also at other Ross Ice Shelf sites near the mountains on the southern part of the shelf,Reference Boyd 1 is of the right order to account for this loss by katabatic winds.
The accumulation figures were calculated for an area only as far west as Site 72. It is therefore clear that little or no plateau ice flows into the Ross Ice Shelf through the Skelton Glacier. This is also supported by independent evidence. The elevation at Site 72 was 2,316 m. From this point west for about 50 km. the elevations dropped to 2,143 m., then began a steady rise into East Antarctica.Reference Crary 2 Also the ice thicknesses of the Ross Ice Shelf Reference Crary 2 increase only toward the south-east indicating that the glaciers along the western part of the shelf contribute little to the shelf nourishment. The dry valleys west of McMurdo Sound are further evidence that the plateau ice which once dominated the Ross Sea area, has receded to the point where only sluggish or stagnant ice controlled by local accumulation remains. The elevations of the Ross Ice Shelf suggest also that the Skelton ice flow is probably typical of most of the glaciers along the west side of the shelf south to the Beardmore Glacier.
Some interesting information on the local ice regime can be obtained from the strain measurements if we assume that creep movement cannot occur in the direction normal to the ice flow, and that steady-state conditions exist. At Site 61, the strain-rate, or creep, of the base line was 1.06 × 10⁻³ per year, which, corrected for direction of maximum movement would be 1.10 × 10⁻³ per year. From the thickness, 650 m., and the estimated density, the total weight in a vertical unit column through the ice here would be 58,500 g., so the loss to the column annually from spreading would be 58,500 times 1.10 × 10−3 or 64 g. From the relative elevations determined during the survey for movement, the surface slope down-glacier is 85 cm. per km. Using the thickness-elevation relation obtained in this area by seismic soundings, this would mean a decrease in thickness of 7.7 m. per km. in the direction of the glacier flow. From the absolute movement given above, 89 m. per year, there should be a decrease in ice thickness of 69 cm. or 62 g. annually at a fixed glacier point, assuming that elevations at any geographic point are not changing in time. This 62 g. would account for all but 2 g. of the ice loss by creep which would need to be made up from accumulation at the top and bottom of the ice column. Some ice must certainly accumulate at the bottom as the water in this area would not be expected to supply the heat flow through the ice required by temperature differences. At any rate, little would be left for annual accumulation at the surface as was verified by the accumulation figures given above for this site.
Near Site 66, strain-rates down-slope were obtained at two places. At the site, where surface slope was 3.3° to the south, the strain-rate was 5.04 × 10⁻³ per year. About 2 km. south of the site, where the surface slope changed to 0.3° to the south, the strain-rate was negative, —1.35 × 10⁻³ per year. Details of the ice thickness changes are not known for this latter area, but the thickness at Site 66 was 803 m. and at Site 65, 8 km. south, the value was 1,470 m. with a thinning of the ice toward the south. Using the strain-rate at Site 66, the value of ice thickness and an estimated density, a unit column would lose 327 g. per year by spreading if the strain-rate were uniform with depth. Assuming that the average vertical spreading is 0.9 times the surface rates, a loss of 295 g. annually would result. Although there is evidence of high local accumulation here, it could hardly be that large, and it is inferred therefore that thinning of the ice must take place in the direction of motion. If one-half of the loss of ice were accounted for by accumulation, the thinning that would be necessary for an absolute movement of 75 m. per year would be 20 m. per kilometer.
Making this same type of calculation at the bottom of the slope where the strain was negative, with an estimated value of 800 m. for thickness, the column must gain 88 g. annually through compression. If 20 g. per year is also accumulatedat the surface, a total of 108 g. or 120 cm. thickening of the ice would occur annually in the direction of motion. The amount compares favorably with the 600 to 700 m. thickening in this direction in the 6 km. to Site 65.
The authors are indebted to members of the 1959–60 traverse team, particularly to Al Stuart, glaciologist, for the important additional data pertaining to this study. The authors are grateful also for the necessary assistance of all other members of the 1958–59 traverse group: Trevor Hatherton, Stephen den Hartog, Lyle McGinnis and Frank Layman.


