


Introduction
During and since the I.G.Y., considerable information has been obtained concerning the mechanical properties of perennial dense polar snow. It was hoped that the present project would be able to extend these studies into the low-density range (<0·350 g/cm3) using, when possible, tests identical to those used on polar snow. Because a wide lateral variation in snow depths and presumably physical properties was expected, attention was focused on tests using apparatus that was reasonably portable or could readily be made so. It was then planned to establish as many interrelations as possible between the parameters measured by these tests. This would facilitate the rapid characterization of a given snow-pack for any specific purpose by a minimum number of hopefully simple tests.
During the months of April and May 1964 and 1965, field studies were undertaken 19 km north of Cooke City, Montana, in the cirque basin occupied by Goose Lake. The area of the cirque is roughly 2·5 km2 and a considerable portion of its floor exhibits a gently rolling relief ideal for snow studies. The general elevation of the cirque floor is 3000 m, placing the research site just above the tree line. A detailed description of the Goose Lake area is given by Reference Alford and WeeksAlford and Weeks (1965).
Because Goose Lake basin has rarely been visited during the winter, little was known about its snow conditions. Based on the observations reported in this paper, 2.4 to 3 m is probably a reasonable estimate of the maximum depth of snow on the ground during an average winter. Snow accumulation usually starts in late October or early November and the pack does not become isothermal until early May. The weather systems supplying snow to the area come from the west and there is a pronounced orographie effect on the accumulation between Cooke City (2330 m) and Goose Lake (Fig. 1). Although Goose Lake proved to be an excellent location for snow studies, it was abandoned at the end of the 1965 field season because of the logistic difficulties in keeping it supplied during the winter.

Fig. 1. Snow-pack water equivalent plotted against elevation. Goose Lake observations made on 30 April 1965, Bridger Bowl observations made on 15 March 1966
The research program was continued during the winter of 1965–66 at Bridger Bowl, Montana, a small ski area Iocated approximately 32 km north-east of’ Bozeman, Montana, which has been instrumented for research by the Montana State University at Bozeman.
The Bridger Range is a long steep ridge which runs north–south. The ridge crest is generally 2400 m in elevation and rises approximately 760 m above the surrounding country. The weather systems which supply snow to this area come from the west and north-west. Because of the abrupt rise of the range, snow accumulation is a pronounced function of elevation (Fig. 1). Although there are no long records of snow accumulation for the Bridger Bowl area, one can probably expect from 1·5 to 2 m of snow on the ground at the ski area in February and March. The snow is normally dry until April when it becomes isothermal at 0°C.
Previous Work
The study of the properties of snow is a young discipline and the methodology has largely been adapted from other fields. Systematic measurements of the gross properties of a snow cover were first made by Reference SeligmanSeligman (1936) who was primarily interested in avalanche occurrence. Since that time the study of snow in situ via the “pit” method (i.e. the description of stratigraphy and the determination of density and temperature profiles) has been developed into a routine and is perhaps best described by Reference BensonBenson (1962). Pit studies have been used to study the broad regional variation of snow characteristics in Canada and the United States (Reference KleinKlein, 1949; Reference GoldGold, 1958; Reference Williams and GoldWilliams and Gold, 1958; Reference BilelloBilello, 1957, Reference Bilello and Ōura1967), in Russia (Reference RikhterRikhter, 1945; Reference FormozovFormozov, 1946; Reference DmitriyevaDmitriyeva, 1950), in Japan (Reference Ishihara and FukuiIshihari and Fukui, 1955), and in Switzerland (Reference BaderBader and others, 1939; see also the annual winter reportsFootnote *). In the Rocky Mountain area of the United States detailed continuing programs of routine pit measurements including grain-size and ram-hardness profiles have been carried out at Alta, Utah (Atwater and othersFootnote †) and at Berthoud Pass, Colorado (Reference JudsonJudson, 1965).
Measurements of the strength properties of mountain snow have been much more sporadic, particularly those coupled with detailed pit observations. After the initial studies by the Swiss who first successfully adapted soil mechanics tests to low density snow (Reference BaderBader and others, 1939; Reference BucherBucher, 1948; de Reference QuervainQuervain, 1950) and the later studies by the Japanese using more refined techniques (Reference YosidaYosida and others, 1955–58), strength studies have been made mainly on the higher density polar snows. The reasons for this emphasis are obvious: (a) most laboratory and field tests are much simpler to perform on the higher density snows (>0·4 g/cm3) and (b) snows with densities less than 0·35 g/cm3 are rare in the polar regions (Reference MellorMellor, 1964) where most recent field studies have been concentrated as a result of the I.G.Y. emphasis on polar glaciology. Typical references to recent studies of the mechanical properties of high-density snows are Reference DiamondDiamond (1956), Reference Diamond and HansenDiamond and Hansen (1956), Reference ButkovichButkovich (1956), Reference RulaRula (1960), Reference RamseierRamseier (1963) and Reference Mellor and SmithMellor and Smith (1966). Unfortunately many of the test procedures used by these investigators necessitate removing specimens from the snow-pack. Because of the extremely fragile nature of low-density snow and the high air temperatures and large amounts of incoming short-wave radiation encountered in temperate mountain regions, such tests are impractical. In addition many of the successful high-density tests become insensitive to physical property variations in the low-density range. This coupled with the naturally high variability in the characteristics of low-density snow has resulted in its mechanical properties being quite poorly understood.
Nature of the Snow-Packs
A characteristic of seasonal snow in mountainous areas is its extreme variability both during a given winter and between different winters. The three winters reported in this paper are no exception, showing pronounced differences in average density, thickness and depth-hoar development. To aid in the discussion of the strength data some representative pit data are included here (Fig. 2).

Fig. 2. Pit observations
Goose Lake, 1964
The winter of 1963–64, based on snow-course information from Silver Gate, Montana, appeared to be a near average snow year. Snow depths in the Goose Lake basin on 16 April varied between 2·3 and 3·5 m with an average value of roughly 2·6 m. During the months of April and May when the pit observations were performed, three major stratigraphie units were distinguishable, both visibly and in the density and ram profiles. A layer of depth hoar roughly 0.7 m thick occurred at the bottom of the snow-pack. This thick layer of hoar was presumably produced by large temperature gradients in the snow during the cold early part of the winter when the pack was still quite thin. Although this depth hoar showed no visible layering, the ram and density profiles showed the presence of layers with slightly different physical properties. The depth-hoar layer gradually changed upward into a thick (1.0 m) layer of uniform fine-grained snow showing a complete lack of either melt features or depth-hoar development. This snow undoubtedly fell during the winter months when the air temperature was appreciably below 0°C. Because the transition between the winter layer and depth hoar was gradational and difficult to fix visually, the boundary was usually located from the ram and shear-strength data. The top of this uniform layer was marked by a pronounced crust which formed during the few warm days preceding a storm on 11 to 14 April. Above this crust was new snow which fell while the field site was occupied. This snow was characterized by wide variations in physical properties and contained several sun crusts. The most pronounced stratigraphie marker in this new snow was a colored layer apparently produced by large amounts of dust in the storm accumulation of 24 April.
These stratigraphic units were sufficiently pronounced to be identifiable for several days after the snow-pack became isothermal on 7 May. Fortunately the great majority of the strength measurements reported in this paper were determined prior to 7 May so that strati-graphic interpretation was not a major problem. After the snow-pack became isothermal, the gradual recrystallization and the ice lens formation produced mainly by percolating melt water gradually caused the earlier stratigraphy to become indeterminate.
Goose Lake, 1965
The winter of 1964–65 was a heavy snow year in Goose Lake and the northern Rockies in general. The average snow accumulation at Goose Lake was considerably more than that of the previous year (Fig. 2). The snow started to accumulate early and a heavy snow-pack developed before extremely cold air temperatures were observed. For instance, it rained in December in Cooke City. There was, of course, no evidence of a rain crust in the pits at Goose Lake. This does, however, indicate that large amounts of snow were rapidly accumulating at Goose Lake at temperatures only slightly below freezing, effectively preventing the development of any significant depth hoar near the bottom of the pack. Instead a thick (0.8 m) layer of dense, medium grained (1.0 to 2.0 mm) snow containing no pronounced stratigraphic markers was formed. This snow graded upward into 2.5 m of fine-grained dense homogeneous snow. Above this there was, in general, 1 m of relatively soft snow showing a few thin sun. crusts.
Goose Lake, 1966
Goose Lake was visited on 28 March 1966 for the purpose of making comparative measurements. As was the case over much of the Rocky Mountain area, the first snowfalls of this winter were light and accompanied by cold temperatures which resulted in strong temperature gradients and the formation of a considerable layer of depth hoar. At Christmas time there was almost no snow at Cooke City (Dean Carter, personal communication) which is a highly unusual occurrence. The pit profile in Figure 2 is approximately two-thirds as deep and much less uniform than that of the previous year.
Bridger Bowl, 1966
The winter of 1966 was marked by low accumulation rates in the early season with the consequent formation of depth hoar. Heavy accumulation in February accompanied by relatively high temperatures caused the formation of numerous crusts. The pack went isothermal between late March and early April (depending on elevation). The extreme lateral variability of snow depth as a function of elevation over a small horizontal distance has been mentioned earlier (Fig. 1). Even at a single elevation, for example, the 2 000 m level, the snow depth varied from 1.5 to 2.5 m in a distance of 100 m due to wind effects.
Results
Almost all of the measurements of physical properties were performed either on the wall of a pit or in the snow a few meters from a pit. This procedure was adopted in an attempt to provide as much supplementary data as possible for the interpretation of the strength results. Snow temperatures ranged from 0° to −10°C with a mean of approximately −4°C. In the treatment of the data temperature effects have not been considered. Presumably most of the scatter remaining in the following curves is due to this fact. Reference RochRoch (1966) has shown that temperature deviations of 5°C might be expected to produce strength changes of the order of 50 per cent of the measured value for snow of a given density.
Ram hardness
The Rammsonde is a cone penetrometer which measures the “resistance to penetration” of a snow layer. A detailed description of the instrument is given by Haefeli (Reference BaderBader and others, 1939). The ram profile is quite easy to measure even under adverse weather conditions and the technique has been used for years as a rapid means of characterizing a given snow-pack and locating depth-hoar layers in avalanche studies. Even though it has proved impossible to provide an exact physical interpretation of the meaning of the ram number (U. Nakaya, unpublished results), useful correlations have been obtained between the ram number and unconfined compressive strength (Reference AbeleAbele, 1963) and density (Reference BullBull, 1956) for polar snows.
Figure 3 shows individual ram values obtained during 1964 and 1965 prior to the snowpack becoming isothermal, plotted against snow density measured at the same level in a nearby pit. Depth hoar is excluded from this figure. If for comparative purposes a relation similar to that used by Reference BullBull (1956)

Fig. 3. Ram number plotted against dry-snow density (Goose Lake 1961–65)
is used to fit these data (403 points), one obtains by least squares

Fig. 4a. Ram number plotted against dry-depth-hoar density
Figure 4b shows ram values obtained after the snow-pack had become isothermal and in some cases water-saturated. Although there is a pronounced increase in the scatter on this plot, it is evident that, in general, lower ram values occur for a given density compared with dry snow. There are probably at least two reasons for this. One is the result of conversion of a percentage of the ice to water. As long as this water is not lost in sampling, there would be no change in density. However, the reduction in the total volume of the solid would definitely reduce the ram number. The other reason is that the melting occurs in the region of the bonds between grains, reducing the overall cohesion of the snow. The increase in the scatter in the values from the later isothermal pits is undoubtedly the result of the formation of numerous irregularly spaced ice lenses and glands which may be present at a given level in a pit and absent a fraction of a meter away where the ram profile was determined.

Fig. 4b. Ram number plotted against wet-snow density
Centrifugal tensile strength
The centrifugal tensile test is first mentioned in the literature by Haefeli (Reference BaderBader and others, 1939) and is more fully described by de Reference QuervainQuervain (1950). The chief advantage of this test, in addition to its rapidity, is its ability to test very low-density snow. In our apparatus the sample was pushed from a standard 500 cm3 snow tube into a similar cylinder which is rotated about an axis normal to the axis of the cylinder. The sample is held in place by a two-pronged clip which reduces the cross-sectional areas of the center of the sample. The speed of rotation of the cylinder is then increased until the snow sample fails and the revolutions per minute at the time of failure are read from a calibrated ammeter. The failure strength of the sample is determined by finding the force exerted on the cross-sectional area of the failure surface and integrating over the half-length of the cylinder. For the dimensions of the cylinder used, this reduces to
where σ t is the failure strength (kg/cm2), M is the mass of the sample (g) and N is the number of revolutions per minute at failure. A nomograph for determining values of at is given in Reference BaderBader and others (1951).
Figure 5 shows a plot of σ t versus porosity for dry fine-grained snow from both the 1964 and 1965 seasons. Because of the obvious “tail” in Figure 5 it was decided to fit the relation

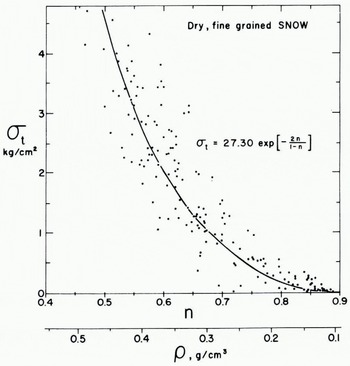
Fig. 5. Tensile strength plotted against porosity of dry, fine-grained snow (Goose Lake. 1964–65)
where σ i is the strength of fine-grained bubble-free ice with a random orientation and n is the porosity. This relation is a theoretical one suggested by Reference Ballard and FeldtBallard and Feldt (1966). Because σ i is unknown, it was obtained by least squares by regressing σ t on

Figure 6 shows a similar plot containing σ t values for depth hoar. If Figures 5 and 6 are compared, it can be seen that the depth hoar has a lower σ t value for a given porosity. This is quite reasonable inasmuch as the formation of depth hoar is invariably associated with a decrease in cohesion.

Fig. 6. Tensile strength plotted against porosity of depth hoar (Goose Lake. 1965)
It is interesting to compare the Montana σ t values with the results of similar tests from the literature. The Montana snow appears consistently stronger by a factor of 2 to 3 over the results of Reference BucherBucher (1948) and de Reference QuervainQuervain (1950). It is presently not possible to explain this discrepancy. It is encouraging to note that the present tests show far less scatter and a much simpler relation to density than previous tests by the centrifugal method (see Reference BaderBader, 1962, p. 36).
Shear strength
Shear box. Although the shear box has been mentioned in the literature for a number of years (Reference Quervainde Quervain, 1950), it is only recently that any appreciable number of measurements have become available (Reference RochRoch, 1966). The shear-box measurements are normally made parallel to the stratification by cutting a “step” in the wall of a pit. This prevents failure occurring over an area wider than the area of the shear box. The measurement of the force applied to the box at the time of failure was made with a Chatillon scale. Unfortunately the use of the shear box is limited to low densities and even at the lowest densities the failure surface was rarely planar.
Figure 7 shows the relationship between shear strength as determined using the shear box and porosity. It can be seen that the data extend only to porosities of about 0.6 (ρ < 0.35) The narrow range of the data makes curve-fitting suspect. However, at the higher porosities a “tailing off” appears to be indicated in a fashion similar to that observed in the centrifugal tensile tests. The porosity of 0.61 proved to be about the limiting value for the use of the shear box.

Fig. 7. Shear-box shear strength plotted against porosity (Goose Lake, 1965)
The values for shear strength determined in this manner and reported by de Reference QuervainQuervain (1950) are quite similar. His high value is 0.160 kg/cm2 at a porosity of 0.65. Unfortunately the data of Reference RochRoch (1966) are not directly comparable as he was concerned with the temperature dependence rather than the density dependence of the shear strength.
“In situ” shear vanes. Shear vanes have commonly been used in determining the shear strength of soil in situ. The general technique is well described by Reference Cadling and OdenstadCadling and Odenstad (1950). Recent preliminary studies by Reference Haefeli and BrandenbergerHaefeli and Brandenberger (unpublished) performed in conjunction with an E.G.I.G. field party have indicated that a simple shear vane may prove a useful tool in characterizing the vertical variation of shear strength in the snow layers near the surface of the Greenland ice sheet. Their Figure 12 shows an excellent correlation between ram hardness and shear strength. In addition, Reference Diamond and HansenDiamond and Hansen (1956) and Reference RulaRula (1960) showed that reasonable correlations could be obtained between vane shear strengths and several other snow parameters. The prospect of successfully utilizing the shear vane is particularly attractive as the apparatus is both simple and portable.

Fig. 12. Shear-vane strength plotted against shear-box strength
Several different types of shear vanes were used on this project. During the 1964 field season, the general dimensions of the vane were based on the design of Reference Haefeli and BrandenbergerHaefeli and Branden-berger (unpublished). Both 3 cm × 3 cm (large) and 1 cm × 3 cm (small) vanes were used (Fig. 8a, b). The height of the vane was deliberately kept small to permit the sampling of thin, homogeneous snow layers. The vanes were inserted to known depths in the snow-pack using extension rods and kept at those depths during a given test by the use of a sliding ring equipped with a set screw which could be located at any point of the rod. This ring then rested on a flat aluminum plate which was set on the surface of the snow and through which the rod passed. The plate was used as the reference level during the tests. For convenience these vanes will be referred to as either the large or small E.G.I.G. shear vanes in this paper.

Fig. 8. Schematic diagram of shear vanes
During the 1965 and 1966 field seasons a larger shear vane (3 cm×10 cm), similar to those used in soils, was used (Fig. 8c). The vane was on the end of a short rod and was inserted horizontally into the walls of the snow pits. The use of pits allows one to avoid such disturbing influences as ice lenses and allows accurate depth determinations. This vane will be designated as the large shear vane.
The reduction of shear-vane data is treated theoretically by Cadling and Odenstad and can be reduced to the following equation:
where M max is the torsional moment at failure read from the maximum deflection of the torque wrench, σ s is the failure shear strength, r 0 and r i are the outer and inner radii of the shear vane (see Fig. 8) and h is the height of the vane. In making these computations the effect of side friction is assumed to be negligible. The rotation rate of the vane, although not accurately controlled, is estimated to be roughly 90 deg/s (0.25 Hz). There are undoubtedly considerable problems relating to the precise shape and constancy of the failure plane. Unfortunately no information was obtained on this problem because in these tests failure occurs some distance away from the free face.
E.G.LG. shear vanes. The E.G.I.G. shear vane is located on the end of a rod with a diameter of 2.5 cm. The ends of the vanes are sharpened to minimize the disturbance of the snow as the vane is inserted. To determine whether the presence of the rod had a serious effect on the results, several tests were made at identical locations in which the vane was both (1) inserted directly into the snow and (2) inserted into a pre-drilled hole 2.5 cm in diameter. There did not appear to be any significant difference between the results obtained by these different methods for either the large or small vanes. In the light of this, most subsequent tests were conducted without a pre-drilled hole. We feel that these results are inconclusive in indicating whether or not pre-drilling makes an appreciable difference as it is our impression that in the low-density snow encountered at Goose Lake in 1964, the shear vane would not remain in the pre-drilled hole.
Next the results from comparable snow types using both the larger and smaller E.G.I.G. shear vanes were compared. On the average the larger shear vane gave higher strengths than did the smaller shear vane. This is thought to be a reflection of the fact that the larger vane has a higher probability of encountering stronger layers as it samples a larger area at any given depth indicated on the extension rod. It is, therefore, very desirable to keep shear vane sizes constant when making comparative studies on the strength of snow or any other inhomogeneous material.
In order to obtain some feel for the effects of the lateral variation of snow properties and differences due to different operators several experiments were performed. Between 15 and 18 May 1964, eleven ablation stakes that had been inserted at different locations in the Goose Lake cirque were visited and vertical profiles of shear strength were made. Because the snow depth varied from location to location (2.4–3 m) it proved difficult to compare the results from specified levels directly. Therefore, to show the broad features of the vertical strength profile we used a dimensionless thickness Z N obtained by dividing the depth of a given sample Z by the total thickness of the pack H at that location. This assumes that the thickness of a given snow layer is proportional to the thickness of the snow-pack. We then calculated the mean and the variance of the eleven samples, one from each profile, that were located nearest to the normalized depth of interest. These results are presented in Figure 9 which shows the low average strength of the newer snow at the top of the pack, a stronger layer in the middle portion and the weak depth-hoar layer at the base. The large variances encountered in the middle of the pack are presumably the result of the presence of inhornogeneities such as thin bedded ice lenses. The magnitudes of the variances appear to be directly related to the magnitudes of the average strength values (i.e. on the average snow layers with a higher strength also show a greater scatter). This can be readily seen in Figure 10, which shows the mean shear strength plotted against the associated standard deviation at that depth. The relationship is linear, giving a constant coefficient of variation

Fig. 9. Variance and mean of shear strengths plotted against normalized depths

Fig. 10. Mean shear strength plotted against standard deviation of shear strength values
In order to assess the differences in the strength values due to differences in locations and operators, a 30 m × 30 m grid was laid out. Locations on this grid were then established using a random number table and two operators determined two replicate shear profiles at each location. The sample size is admittedly small; however, it was thought best to complete these measurements in a short period of time to eliminate, as much as possible, variation due to time changes in the snow. Shear-strength values were taken at 20 cm intervals starting at a depth of 10 cm and terminating at 190 cm. These profiles do not include measurements made in depth hoar.
The results from the sampling grid were analyzed for a given level using a three-level random nested analysis of variance (AOV) model.
where i = 1 … I, j = 1 … J, and k = 1 … K. This model states that any shear-strength observation σ s = Y ijk is equal to an overall mean μ plus the deviation of the ith location mean from overall mean, plus the deviation of the jth operator mean from the location mean, plus the deviation of kth replicate from the operator mean (Reference Krumbein and GraybillKrumbein and Graybill, [1966]). In our specific case I = 6, J = 2 and K = 2. Because the standard deviation was shown to be directly proportional to the mean we used a logarithmic transformation on the data to stabilize the variance before the AOV calculations were made (Reference BrownleeBrownlee, 1960, p. 114). The results of these calculations are presented in Table I. Here
Table 1. Hypotheses Tests and Variance Estimates from the Three-Level Nested E.G.I.G. Shear-Vane Experiment (Variance Estimates are Presented on an Untransformed Scale)

Large shear vanes. The experiments conducted with the E.G.I.G. shear vanes suggested that the scatter of data was primarily a function of inhomogeneities in the snow-pack. In order to counteract these effects it was decided (I) to use an even larger shear vane which would, to some extent, average the strength values over a larger volume of snow and (2) to insert the vane horizontally into the pit wall making it possible to locate the sample precisely and to make visual comparisons with the stratigraphic description . This larger vane was used throughout the field seasons of 1965 and 1966.
The shear strengths of the snow at Goose Lake in 1965 are plotted against porosity in Figure I I . The data show remarkably little scatter when the values for depth hoar are considered separately. This good relationship is thought to be in part due to improved measurement with the large shear vane and in part a testimony to the relative homogeneity of the snow-pack that year. The range of porosities and strengths makes it possible to fit the data with the expression used earlier for the tensile-strength data. In this case ai for shear is found to be equal to 4.15 kg/cm' when a least-squares analysis is conducted . The correlation coefficient is 0.892.

Fig. 11. Large shear-vane strength plotted against porosity
Figure 12 shows a plot of shear strengths obtained using the shear vane versus shear strengths obtained using the shear box. As the analysis of shear-box data is straightforward, this close agreement suggests that some confidence can be placed in the shear vane results.
It has a lready been established that a fun ctional relationsh ip exists between ram hardness and porosity (density) . It would therefore be expected tha t a good coHelation could be found between ram hardness and shear strength and that this would be linear. Figure 13 shows th is correlation for which r = + 0.868. It should be noted that the Rammsonde measurement is not made at the same point in space as the shear-vane measurement and consequently lateral variations in the snow-pack affect the correlation.
Other results
Figure 14 presents a comparison of shear-vane measurements and centrifugal tensile strengths from identical snows. In general there appears to be an order of magnitude difference, which is somewhat surprising despite the fact that a similar trend had been noted by Roch ( 1966) . A possi ble explanation may lie in the test procedures. The loading rate in the shear-vane test exceeded 2 kg/cm's, whereas the tensile tests loaded the sample at a rate less than 0.5 kg/cm's. This la tter rate may be too slow to produce truly elastic failure.

Fig. 12. Shear-vane strength plotted agaillst shear-box strength
Figure 15 shows the change in the value of log (CN) plotted against porosity where CN is the hardness of the snow (g/cm') d etermined with a Canadian hardness gauge. The changes are quite systematic and within the range of the data may be approximated by the straight line log (eN) = 6.9S- S.88n with a correlation coefficient of - 0.903. This compares quite closely with results from laboratory cone hardness tests conducted by Ager (I 96S) who found regression coeffici ents between 5.5 and 6.S for various mixtures of dry snow types (exclusive of depth hoar).
Conclusions
We feel that the results presented in this paper are quite encouraging in that they demonstrate that the mechanical properties of low-density snow can be investigated in the field using simple portable tests. The results show simple systematic relations with appreciably less scatter than would be anticipated from surveying the literature; much of the remaining scatter is undoubtedly due to variations in snow temperature. Several excellent correlations are established between the results of different types of tests which should facilitate the rapid characterization of a given snow-pack. It should be stressed that the systematic relations shown in this paper invariably become obscured when different “types” of snow are indiscriminately grouped together. This points to the need for a more thorough study of the structural properties of low-density snow and for an independent means of determining the degree of bonding in a snow-pack. Only when such a technique is available will it be possible to separate the different degrees of constructive metamorphism adequately and to incorporate the important process of depth-hoar formation into an overall strength theory. The need for continued field studies using carefully controlled conditions is obvious.

Fig. 13. Shear-vane strength plolted against ram hardness

Fig. 14. Centrifugal tensile strength plotted against large shear-vane strength

Fig. 15. Logarithm ofCalladian hardness plotted against porosity of dry snow
Acknowledgements
The authors would like to acknowledge the efforts of Donald Alford who organized the Goose Lake projects. D. Eberl, G. Thompson, D. Carter, S. Toth and D. Bowles all assisted in the data collection.


