


1. Introduction
The US broiler industry is highly integrated with individual companies controlling multiple segments of the supply chain. Shocks to the broiler industry through changes in domestic or international policy can ripple through both the integrated and independent segments of the supply chain. The trade war that started in April 2018 led to China imposing tariffs on US corn and soybeans (Marchant and Wang, Reference Marchant and Wang2018), which impacts the broiler supply chain through changes in feed costs. Also, the United States, Canada, and Mexico negotiated the US–Mexico–Canada Agreement (USMCA) that, if ratified by the three countries, will expand the quota for US broiler exports to Canada. This paper analyzes the impact of corn and soybean price shocks due to Chinese tariffs on these two broiler feed ingredients and the USMCA policy changes in the broiler industry on the US broiler supply chain.
The broiler industryFootnote 1 is an essential segment of US agriculture both in terms of production and consumption. US broiler production has grown since the 1960s due to rapid gains in productivity and reductions in production costs, which both stem from advances in science and industry structure through vertical integration (Reimund, Martin, and Moore, Reference Reimund, Martin and Moore1981). Specifically, new broiler breeds through improvements in genetics, better nutrition, enhanced disease control, and more efficient management of confined poultry have resulted in broiler production to become faster, cheaper, and safer (Perry, Banker, and Green, Reference Perry, Banker and Green1999). Vertical integration along the broiler supply chain has become commonplace, where individual companies produce and supply inputs to downstream production processes. Individual companies, called integrators, control genetic stocks (breeder farms), feed, hatcheries, slaughter and processing plants, and transportation (Goodwin, Reference Goodwin2005). Through both vertical integration and mergers, the number of firms operating in the broiler industry fell from 250 in 1950 to about 20 integrators in 2012. These 20 companies account for approximately 96% of broiler production, and the top three account for 50% of total broiler supply (Goodwin, Reference Goodwin2005; MacDonald, Reference MacDonald2014). Advancements in genetics, vertical integration, and concentration in the broiler industry led to more efficient production and lower average cost, which resulted in broiler production increasing from 6,437.1 million lb. in 1966 to 41,662 million lb. in 2017 (see Figure 1). Furthermore, broiler production surpassed that of pork in 1985 and beef in 1994 because of the substantially longer life cycle of beef cattle and swine. As a result, advances in the genetics stock of beef and pork take longer than that of broilers, and vertical integration in the beef and pork industry is less prevalent than in the broiler industry (Ward, Reference Ward1997).

Figure 1. Trends in the US meat production from 1966 to 2017.
Figure 2 shows that US per capita broiler consumption has expanded from 32 lb. in 1966 to 105.74 lb. in 2017. Broiler consumption surpassed that of pork (which has remained relatively stable at an average of 65.19 lb. per capita) in 1988 and beef (which declined from a peak of 127.19 lb. per capita in 1976 to 81.26 lb. per capita in 2017) in 2002, becoming the number one source of meat. The popularity of chicken by US consumers occurred because of low prices due to rapid productivity growth and the expansion of supply; chicken meat is considered healthier than beef and pork; and processors provide an array of products such as whole chickens, chicken parts, and a plethora of value-added products (Davis et al., Reference Davis, Harvey, Zahniser, Gale and Liefert2013). Within broiler meat, US consumers prefer white meat (chicken breast and wings) to dark meat (thighs and legs) by a 2-to-1 margin primarily for health reasons, as white meat includes more protein and less fat than dark meat (Arumugam, Reference Arumugam2011). Consumers benefit from the rapid advances in productivity because broiler production has outpaced beef and pork production and broiler demand, resulting in relatively low broiler prices.
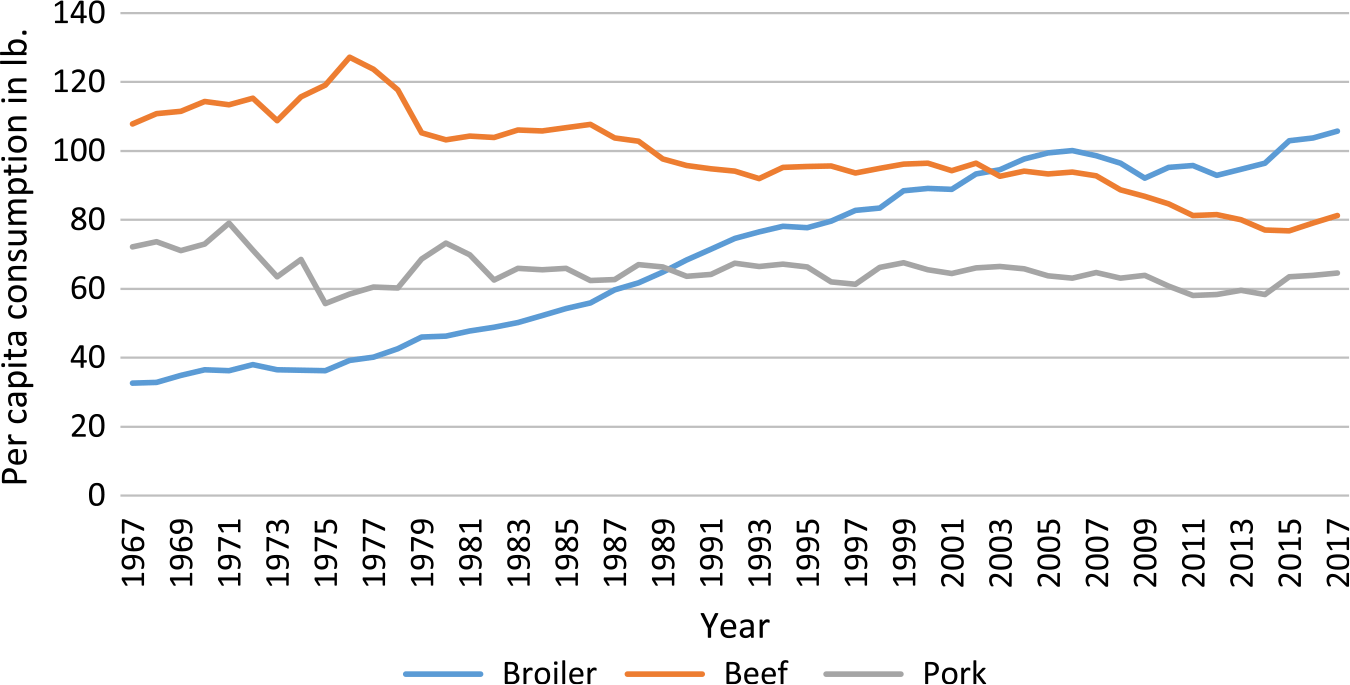
Figure 2. Trends in US per capita meat consumption from 1966 to 2017.
Exports dominate US broiler trade. With a 10-year average of 6.7 billion lb., US broiler exports are 55.8 times larger than US broiler imports. Since 2000, Russia and Mexico have been the top destinations, accounting for 17.9% and 13.5%, respectively, of all US broiler exports. However, in recent years, US exports to Mexico dominated at around 20% while exports to Russia evaporated. As exports to Russia dried up, apart from Mexico, no single market emerged as dominate, and exports to Canada, Hong Kong, Cuba, Angola, China (Taiwan), and Guatemala all range between 3.5% and 6%. Leg quartersFootnote 2 dominate exported broiler meat products, accounting for 59.4% of all exports in terms of value and 66.6% in terms of quantity. On the import side, before 2008, over 95% of US imports came from Canada. However, after 2008, Chile rapidly gained US market share, going from 1.75% of US imports in 2008 to 58% by 2018. At the same time, Canada's market share shrank from 98.2% in 2008 to 40.9% in 2018.
With feed costs ranging between 65% and 75% of the total cost for US broiler producers (Weaver, Reference Weaver2014), the availability of cheap feed is crucial to overall profitability and production. Corn and soybean meal account for 44% and 26%, respectively, of broiler feed, making them the primary feed inputs. These two key ingredients make up around 70% of broiler feed prices (IFEEDER, 2017); any shock to the corn and soybean industry impacts the broiler supply chain through feed cost. Under the Trump administration, the United States and China are engaged in a trade war, which has directly affected the bulk of agricultural products in the United States. In response to US tariffs on many Chinese imports, China imposed retaliatory tariffs on US soybean and corn imports, among other goods.Footnote 3 Since this conflict, the value of US corn exports to China decreased by 64.8% from $142 million in 2017 to $50 million in 2018, and US soybean exports to China declined by 74.5% from $12.22 billion in 2017 to $3.12 billion in 2018 (USDA, 2018d), which led to an increase in quantities in the US domestic market. According to Swanson, Coppess, and Schnitkey (Reference Swanson, Coppess and Schnitkey2018), US domestic soybean meal prices dropped approximately 24.2% from $10.34 to $7.84, and corn prices declined 18.3% from $3.78 to $3.09 between March and July 2018.Footnote 4 Given the importance of feed in broiler production, this study analyzes the impact of the decline in corn and soybean meal prices on the broiler supply chain.
In late 2018, the United States, Mexico, and Canada signed the USMCA, which, as of December 2019, has not been ratified by the three countries (USTR, 2018). USMCA policy changes for US agriculture include enhanced access to Canadian dairy and poultry markets. For the broiler industry, market access is expanded through changes to the Canadian tariff-rate quota (TRQ). Once ratified, USMCA will increase the quota for US products to enter Canada tariff-free from 47,000 to 57,000 MT; once the quota is met, a tariff of 249% is applied to US exports to Canada. This study analyzes the impacts of the change in the Canadian TRQ throughout the entire broiler supply chain.
Several large-scale models consider poultry but do not allow for broiler-specific analyses because poultry is aggregated with other meat sectors (e.g., the GTAP CGE model [Corong et al., Reference Corong, Selva, Batta, Keeney and van der Mensbrugghe2017]). The Food and Agricultural Policy Research Institute (FAPRI) maintains an econometric multi-commodity model, which includes poultry (FAPRI, 2004, 2018). As part of the poultry supply sector, the FAPRI model specifies the number of pullets placed, broiler production, feed costs, and retail sectors. However, the complete supply chain and structure of integrators are not fully captured, as hatcheries and breeders are modeled as one stage of production, and value-added broiler products (which account for approximately 49% of the market share [NCC, 2018]) are not explicitly modeled. The partial equilibrium Aglink-Cosimo model (OECD, 2014) disaggregates poultry production and disappearance but mainly focuses on world agriculture markets. Therefore, many of the vertical supply relations are not modeled, and poultry is not the primary focus of these models. Given data availability, this study builds a poultry supply chain to model. In doing so, the model disaggregates hatcheries and breeders as two separate segments and includes valued-added broiler products.
A large portion of the literature analyzing the broiler industry focuses on the impact of a specific event on one particular segment of the industry. For example, Thomsen and McKenzie (Reference Thomsen and McKenzie2001) investigated the effects of food recalls and the ensuing financial support from the government on meat and poultry firms that are publicly traded. Dahlgran and Fairchild (Reference Dahlgran and Fairchild2002) examined the severity of financial losses because of a decrease in demand for chicken meat due to adverse food safety news. Ollinger, MacDonald, and Madison (Reference Ollinger, MacDonald and Madison2005) considered the impact of technological change on the US poultry industry. Ollinger (Reference Ollinger2011) investigated the increase in plant size and economies of scale in the poultry, cattle, and pork industries as the government implemented the Hazard Analysis and Critical Control Points (HACCP) system. Holt and McKenzie (Reference Holt and McKenzie2003) analyzed the impact of supply shocks on US broiler producers’ price expectations by incorporating the additional information provided by future prices into a standard price regression. Goodwin, McKenzie, and Djunaidi (Reference Goodwin, McKenzie and Djunaidi2003) examined price relationships among chicken parts in the wholesale broiler market using a vector autoregressive regression time series modeling approach. Awokuse and Bernard (Reference Awokuse and Bernard2007) studied the structure of the US broiler market by considering if the law of one price holds across urban areas in the Northeast, South, Midwest, and West. Suh and Moss (Reference Suh and Moss2016) analyzed substitution between distiller's dried grain with solubles and corn-based feed as production and prices change using a dynamic linear logic model. Our analysis differs from these agent-specific studies by considering the impact of changes in trade policies on the whole broiler supply chain.
International trade is an important component of poultry markets. Implementing time series analysis, Awokuse and Yuan (Reference Awokuse and Yuan2006) and Davis et al. (Reference Davis, Muhammad, Karemera and Harvey2014) analyzed the impact of exchange rate volatility on US poultry and broiler exports and the international market as a whole. International trade agreements played an important role in poultry trade. For example, Moschini and Meilke (Reference Moschini and Meilke1991) studied tariffication under General Agreement on Tariffs and Trade (GATT) on the US–Canadian poultry market. Murphy et al. (Reference Murphy, Ames, Epperson and French1993) implemented an Armington trade model to forecast the impact of heightened trade protections and the implications of the Uruguay Round of the GATT. Peterson and Orden (Reference Peterson and Orden2005) examined the removal of tariffs, TRQs, and sanitary regulations on international poultry markets using a competitive partial equilibrium spatial model with heterogeneous (high-value white meat and low-value dark meat) goods. Sanitary standards impact on food trade, particularly in poultry markets. Salin, Hahn, and Somwaru (Reference Salin, Hahn and Somwaru2005) used a mathematical programming model to examine the impact of changes in sanitary requirements on broiler trade in the Americas. Wieck, Schlüter, and Britz (Reference Wieck, Schlüter and Britz2012) implemented gravity model estimation to perform ex post analysis of avian influenza-related quarantine and utilized simulation methods to quantify the welfare effects of trade bans resulting from avian influenza. Zhou, Li, and Lei (Reference Zhou, Li and Lei2019) analyzed the impact of nontariff measures and avian influenza outbreaks on Chinese poultry exports. Our analysis differs from these papers by examining the impact of international policies on the US poultry supply chain, which includes both US poultry exports and domestic sales at the top end.
The specific objectives of this study are to: (1) develop a model of the US broiler supply chain that captures the vertical and horizontal linkages, (2) collect data for all segments of the US broiler supply chain, (3) calibrate the model to accurately represent the data, and (4) run two counterfactual analyses to study the impact of corn and soybean meal price shocks resulting from the US–China trade war and the USMCA broiler policy changes on the broiler industry. This study is the first to provide a comprehensive, quantitative analysis of the impacts of two important policy issues (US–China trade war and USMCA) on quantities, transfer prices, and market prices for each segment (corn and soybean meal, feed mills, breeders, hatcheries, grow-out farms, broiler processing, value-added production, domestic consumption, and trade) of the broiler supply chain.
2. Model
The supply chain model consists of corn and soybean meal, feed mills, breeders, hatcheries, grow-out farms, broiler processing, value-added production, and markets. The broiler industry is highly integrated (with the integrator controlling feed mills, breeders, hatcheries, broiler processing, and value-added), and a profit-maximizing agent controls each stage along the supply chain, except for corn and soybean meal which are modeled with reduced-form supply functions. The supply chain arises from upstream agents supplying or selling inputs to downstream agents. In addition to vertical linkages, two horizontal linkages exist: (1) breeders and grow-out farms both use feed as an input and (2) whole chickens, chicken parts, and chickens for further processing all demand live chickens from grow-out farms. All output and input prices along the supply chain are determined endogenously through market-clearing conditions. Here, we discuss the main assumptions of the model; see online supplementary Appendix A for the full mathematical model.
Figure 3 depicts the eight segments along the broiler-industry supply chain, where the dashed boxes indicate independent farmers/producers, circles indicate stages of production owned by an integrator, the hexagon represents markets for final broiler products, and descriptions next to an arrow are the output of the previous stage. First, the most upstream segment is independent raw material producers who sell corn and soybean meal to feed mills. Second, the integrator-owned feed mills supply feed to breeder farms and grow-out farms. Third, independent breeder farms produce fertilized eggs for hatcheries.Footnote 5 Fourth, with the fertilized eggs, integrator-owned hatcheries produce day-old chicken (DOC). Fifth, independent grow-out farms sign contracts with integrators for DOC and feed to raise broiler chickens.Footnote 6 Sixth, integrator-owned processing plants utilize broiler chickens and slaughter them to produce whole chickens, chicken parts for consumption, and prepare live chickens for the value-added segment. Seventh, integrator-owned value-added plants also utilize slaughtered chicken from processing plants and other inputs (e.g., oil, flour, eggs, spices) to produce processed (value-added) chicken products.Footnote 7 Eighth, market prices are determined for whole chickens, chicken parts, and processed (value-added) chicken via the market-clearing conditions, where total production equals total domestic consumption and exports. Also, prices are endogenously determined through equilibrium conditions for each segment in the supply chain: corn and soybean prices are determined by the equilibrium conditions where total demand for corn and soybean meal by feed mills equals the supply of corn and soybean meal to the broiler industry. Within the integrator, transfer prices between segments are determined by setting supply equal to the demand for feed, fertilized eggs, and DOCs.
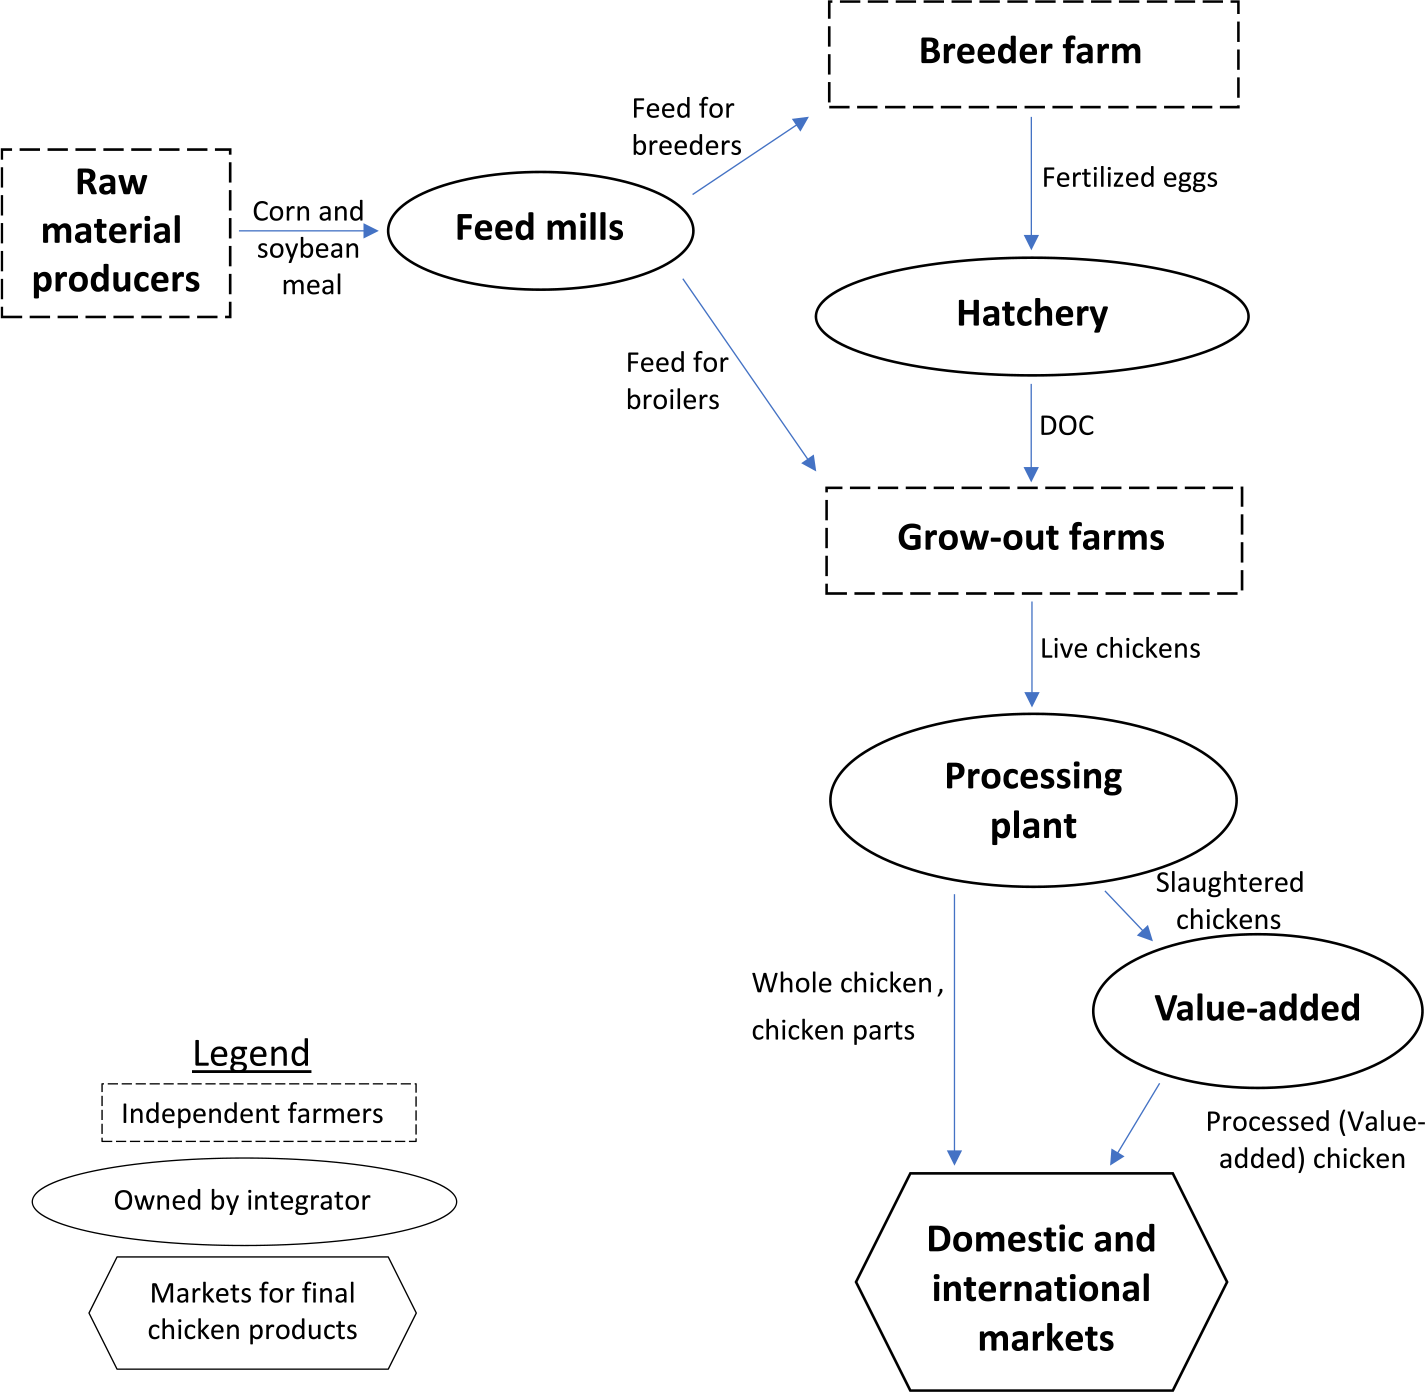
Figure 3. Broiler industry supply chain.
3. Data and calibration
This paper utilized annual data from 2012 to 2017 from secondary government reports and databases. For each variable discussed below, our baseline data are the average over these 3 years, unless otherwise noted. Data are collected for quantities and prices of all outputs and inputs in the model and quantities exported.
For corn and soybeans, the total supply and imports to the feed industry are obtained from the Feed Grains Database (USDA, 2018c). One lb. of soybean yields 0.792 lb. of soybean meal (USSEC, 2018). The percentage of corn and soybean meal utilized in the broiler industry came from the Animal Food Consumption report (IFEEDER, 2017), but these percentages are published for 2016 only. Corn and soybean meal prices are taken from Quick Stats (USDA, 2018h). Based on the National Agricultural Statistics Service (USDA, 2018b), the corn and soybean meal prices are converted into the broiler feed price:
 $$\rho ^F = \left(0.58 \times {{p^C\over 56}}\right) + \left(0.42 \times {p^{SM} \over 60}\right).$$
Based on Animal Food Consumption Report (IFEEDER, 2017), in 2016, breeders and grow-out farms accounted for about 4% and 96% of feed use, respectively.
For the breeder farm, the number of fertilized hatching eggs is obtained from Livestock and Meat Domestic Data (USDA, 2018e). For the hatcheries, the number of DOC is collected from Quick Stats (USDA, 2018h), which accounts for fertilized eggs that did not hatch. The prices of fertilized eggs and DOCs are obtained from Clauer (Reference Clauer2012).
For grow-out farms, the quantity of broiler chickens in lb. and price is obtained from Quick Stats (USDA, 2018h), which accounts for mortality rates. Broilers are sold to processing plants where they are slaughtered for three different markets: whole chickens, chicken parts (which consists of three subsegments: chicken breast, wings, and dark meat), and value-added processing. The quantity of broilers is transformed into the dress weight, which is 71% of the live weight (Schweihofer, Reference Schweihofer2011). Then, the total dress weight quantity is divided into whole chickens, chicken parts, and broilers processed for the valued-added processing based on percentages (11%, 40%, and 49%, respectively) reported by the National Chicken Council (NCC, 2018).Footnote 8 For chicken parts, 41% of the dress weight is chicken breast, 48% is dark meat, and 11% is wings (Chicken Parts, 2018). The prices of a whole chicken, chicken breast, and dark meat are obtained from U.S. Bureau of Labor Statistics (2018). Due to a lack of data for the national chicken wing price, we utilized the wing price of the southern states which are collected from the Agricultural Marketing Service (USDA, 2018g, p. 235). Because data for the price of chickens processed for the value-added segment are not available, we assume this price is equal to that of chicken parts.
According to the Economic Research Service (USDA, 2018a), exports of whole chickens and chicken breasts are negligible and are excluded from the analysis. Therefore, domestic consumption equals the production of whole chickens and chicken breasts. Data on Mexican, Canadian, and Rest of the World (ROW) imports of wings and dark meat are collected from the Foreign Agricultural Service (USDA, 2018f). US domestic consumption of chicken wings and dark meat is calculated by subtracting exports from total production.
With no data on total value-added production of the broiler supply chain, we assume that the quantity of broilers processed for value-added and value-added total output are equal to each other. Trade data for value-added products are taken from UNComtrade (2018). US domestic consumption of value-added products is the difference between total production and exports. We assume the price of value-added products is 30% higher than the price index for chicken parts. We perform sensitivity analyses on this assumption.
With respect to tariff and transportation cost variables, Canada applies a TRQ on imports of poultry products (World Trade Organization, 2019). The TRQ is zero on imports under 47,000 MT and 249% on imports above this quota for the United States. Therefore, we applied a weighted average tariff rate for US–Canada broiler trade of 161%. For Mexico, under NAFTA, imports of US dark meat are duty-free (Hernandez and Hernandez, Reference Hernandez and Hernandez2015). The tariff on US exports of broiler products to ROW is subject to a trade quantity-weighted average tariff rate of 25% (World Trade Organization, 2018). The North American transportation costs are $0.095 and $0.077 per lb. for exports to Mexico and Canada, respectively. These transportation costs are calculated using the following data. A semitruck can carry roughly 55,000 lb. of broiler meat (Truckers Report, 2018). The net transportation costs from Springdale, Arkansas (a major chicken producing region in the United States) to Mexico City, Mexico and Montreal, Canada are $5,221.00 and $4,255.00 per truck, respectively (Transportation Cost, 2019). Also, Canada applies a $200 fee for customs paperwork per truck, and 10% of trucks are reinspected at the US–Canadian border at the cost of $400 (Transportation Cost, 2019). Therefore, an additional $240 is added to Canada's transportation cost rate. The transcontinental transportation cost is $0.114 per lb. for ROW. This transportation cost is calculated using the following data. A cargo container on an ocean cargo ship can carry 50,000 lb. of broiler meat. The net transportation cost is $7,015, $7,110, $5,450, and $5,200 for Hong Kong, South Korea, the Netherlands, and Brazil, respectively (Transportation Cost, 2019). Based on the cost of these four ports, the trade value-weighted average (averaged over 2012 and 2017) is calculated (USDA, 2018d).
With the data defined above, we calibrate the parameters in the production functions and reduced supply and demand functions. Because of relatively strict formula requirements for producing feed from corn and soymeal, and grow-out farms are unable to substitute feed for DOCs, we assume a lower elasticity of substitution of 0.2 between inputs. Given the duality between production function and cost functions, we follow Rutherford (Reference Rutherford2002) to calibrate the share parameters, and the returns to scale parameters are calculated as the total cost of production divided by the total value of production. The details of the remaining parameters are provided in online supplementary Appendix B.
4. Simulation results
The supply chain model for the US broiler industry is simulated to analyze the impact of policy shocks on the broiler supply chain. Specifically, based on profit maximization, supply and input demand functions are derived in terms of endogenous prices (see online supplementary Appendix A for details). The derived functions are substituted into the market-clearing conditions, and the equilibrium conditions are solved numerically for the endogenous market prices (corn  ${p^C}$, soybean meal ${p^{SM}}$, breeder ${p^B}$, grow-out ${p^G}$, whole chicken ${p^W}$, breast meat ${p^{Br}}$, wings ${p^{Wi}}$, dark meat ${p^D}$, and value-added ${p^{VA}}$) and transfer prices (feed ${\rho ^F}$, DOCs ${\rho ^H}$, and processed chicken for value-added ${\rho ^{PV}}$). With equilibrium prices solved, quantities are calculated using the supply and input demand functions.
The US–China trade war and USMCA trade agreement both impact the broiler industry. In early 2018, China imposed retaliatory tariffs on corn and soybeans, among other agricultural and nonagricultural products. These tariffs indirectly impact the broiler supply chain by influencing the supply and market price of corn and soybean meal. As previously discussed, corn and soybean meal are major inputs in this industry because they account for about 44% and 26% of feed inputs, respectively, and feed constitutes about 70% of the total cost of broiler production. With the Chinese tariffs on corn and soybeans lowering the Chinese demand for US corn and soybeans, the supply of these products in the US domestic market expands, which lowers the price of these commodities. As a result, this study analyzes the impact of a decline in domestic corn and soybean meal prices by 18% and 24%, respectively (Swanson, Coppess, and Schnitkey, Reference Swanson, Coppess and Schnitkey2018), resulting from the Chinese tariffs. If USMCA is ratified by the United States, Mexico, and Canada, market access for US producers to the Canadian broiler market will expand, as the quota for US products to enter Canada tariff-free is set to rise to 57,000 MT from the current level of 47,000 MT. As a result, the weighted average tariff will fall from 161% to 142%. This study quantifies the impact of a decline in this quota. Consequently, three scenarios are considered: (1) the baseline maintains current values for all policy variables and replicates the benchmark data; (2) the first alternate scenario considers the impact of a price shock on corn and soybean meal; (3) the second alternate scenario analyzes the impact of expanding the quota Canada imposes on US exports.
The results of the two alternate scenarios are compared to the baseline scenario to quantify the impacts of an input price shock and expanded market access in Canada. Table 1 reports the baseline values for quantities and impacts of the two alternate scenarios in percentage change relative to the baseline. Table 2 presents the baseline values for prices and impacts of the two alternate scenarios in percentage change relative to the baseline. Table 3 reports the baseline values for domestic consumption and exports and the impacts of the two alternate scenarios in percentage change relative to the baseline.
Table 1. Impacts on supply chain quantities

Table 2. Impacts on prices

Table 3. Impacts on domestic consumption and exports

4.1. Corn and soybean meal price shock
This scenario measures the effect of an  $18\% $ and $24\% $ decline in domestic corn and soybean meal prices resulting from the Chinese tariffs. The lower price of corn and soybeans reduces the cost of production for feed, which shifts the feed supply curve to the right. The simulation analysis predicts that the supply of feed expands by $12.21\% $ and the price of feed to fall by $11.51\% $. As seen in Figure 2, feed is an important input in two downstream segments—breeder farms and grow-out farms—which creates a horizontal linkage in the feed segment. Because hatcheries are downstream from breeder farms but upstream from grow-out farms in the supply chain, the change in feed price impacts breeder farms directly as the cost of feed falls and indirectly as lower feed costs expand grow-out farms demand for DOCs, which raises hatcheries’ demand for fertilized eggs produced by breeder farms.
Specifically, for breeder farmers, low feed cost reduces the production cost for breeder farms, which shifts the supply of fertilized eggs to the right, expanding production and putting downward pressure on the equilibrium price of fertilized eggs. Concurrently, the demand for fertilized eggs by hatcheries also expands as the production of DOCs increases to meet grow-out farms higher demand for DOCs as live bird (broiler chicken) production rises. This higher demand further expands the production of fertilized eggs but puts upward pressure on the equilibrium price of fertilized eggs. The simulation shows that the expansion in demand for fertilized eggs offsets the rise in the supply of fertilized eggs as the equilibrium quantity of fertilized eggs expands by  $6.69\% $ and the price of fertilized eggs rises by $7.09\% $.
For hatcheries, the costs of inputs rise as the price of fertilized eggs expands, contracting supply and putting upward pressure on the price of DOCs. However, as previously discussed, the demand for DOCs expands as the production of grow-out farms expands, putting upward pressure on both equilibrium quantity and price. The results show that the demand effect outweighs the supply effects, and the equilibrium quantity of DOCs expands by  $7.34\% $ and price rises by $7.13\% $.
Grow-out farms experience two counteracting input impacts: the decline in the price of feed and the increase in the price of DOCs. The fall in the feed price is a direct effect of the lower corn and soybean meal prices, which expands production, while the rise in the price of DOCs is an indirect effect of higher demand, which dampens production. This result highlights the importance of the vertically integrated supply chain: The increase in production of grow-out farms would be overestimated if the price of DOCs was assumed constant and the upstream hatchery and breeder segments were excluded from the model. The results show that the direct effect of lower feed cost dominates the indirect effect of the higher cost of DOCs, and the supply curve for grow-out farms shifts right. As a result, the production of broiler chickens expands by  $9.96\% $ and the price declines by $8.37\% $.
The decline in the price of broiler chickens benefits the two downstream segments (processing plants and value-added plants) because the lower price reduces production costs. With input prices falling, the supply curves of these downstream segment shift to the right, causing production to expand for whole chickens by  $6.70\% $, chicken parts (breast meat, wings, and dark meat) by $2.95\% $, and processed chicken for valued-added production by $3.27\% $. As production expands, the prices of these commodities fall modestly. With lower prices, domestic consumption for the non-trade products of whole chickens and chicken breasts increases by $6.70\% $ and $2.95\% $, respectively. Consumption of whole chickens expands more than chicken breasts because the elasticity of demand for whole chickens is larger than that of chicken breasts. For the traded products, domestic consumption of wings and dark meat expands by $3.15\% $ and $11.96\% $, respectively. Again, the consumption of wings is less than the consumption of dark meat because the elasticity of demand for the former is lower than the latter. Exports of wings and dark meat to Canada expand by $3.01\% $ and $11.35\% $, while exports to Mexico increase by $1.11\% $ and $1.19\% $, respectively. With Canadian preferences similar to that of the United States, the elasticities of demand for Canadian imports are higher than for Mexico, implying the quantity imported will be larger for Canada than Mexico for the same reduction in price. The results for the ROW are similar to those of Mexico.
With a lower price of processed chicken, the cost of value-added chicken processing also falls, leading to an increase in production. The lower costs cause equilibrium sales to rise by  $2.48\% $ and price to fall by $1.63\% $. Domestic consumption expands by $2.50\% $, and exports to Canada rise by $2.43\% $, while exports to Mexico rise by only $0.56\% $.
4.2. USMCA policy
Next, we quantify the impact of the quota on US products to enter Canada tariff-free expanding to 57,000 MT from the current level of 47,000 MT. Generally speaking, the impact of the USMCA policy on the US broiler industry is modest, except for US exports to Canada. For example, the price of US wings, dark meat, and value-added products in Canada will fall, which causes US exports of dark meat and wings to Canada rise by  $15.76\% $ and $7.31\% $, respectively. Exports of dark meat rise more than wings because the elasticity of demand in Canada for dark meat is larger than for wings. Because wing meat is produced in fixed proportion with dark meat (see equations (30) and (31) in online supplementary Appendix A6.2), if the demand for dark meat expands more than the demand for wing meat, both wing and breast meat must be produced regardless of market conditions. With demand for dark meat outpacing supply, the price of dark meat rises by $1.13\% $, causing domestic consumption to fall by $2.51\% $ and exports to Mexico and ROW to fall by $0.26\% $ and $0.26\% $. However, with supply outpacing demand for wing and breast meat, the prices of wing and breast meat fall only slightly. The increase in the price of dark meat leads to a minor rise in domestic consumption of breast meat and wings and a negligible rise in wing exports to Mexico and ROW. US exports of value-added products to Canada rise by $11.98\% $, which causes a small diversion of exports from Mexico and ROW and a minor decline in domestic consumption.
Production in dark meat and wings (and chicken breasts due to fixed proportion) all rise by just under  $0.10\% $. Production of whole chickens falls as broiler chickens are diverted to dark meat and wing production, causing the production of whole chickens to fall by $0.11\% $. Interestingly, the quantity of chicken processed for the value-added processing and value-added production both fall slightly, despite the export of value-added products to Canada rising slightly. This implies resources are being drawn from both whole chickens and chickens processed for the value-added processing to chicken parts, and exports to Canada do not boost production but divert domestic sales and exports to Mexico and ROW. The changes in production are small because the enhanced access to Canada's market is modest.
The upstream segments (grow-out farms, hatcheries, breeder farms, feed mills, and corn and soybean meal) all benefit because of the expanded demand for live chickens (all percent changes are below 0.5% for these upstream segments). The price of live chickens and quantity of production expand, which raises demand for all upstream goods, increasing both quantity produced and price of DOC, fertilized eggs, broiler feed, and corn and soybean meal.
4.3. Sensitivity analysis
To gain further insight into the behavior and results of the broiler supply chain model, we conduct sensitivity analyses for assumptions of the elasticity of substitution between inputs for feed mill and grow-out farms segments and Canadian, Mexican, and ROW elasticity of demand by considering a  $20\% $ increase and decrease in these parameters. For the sensitivity analysis, we focus on the reduction in the price of corn and soybean meal following the US–China trade war and report the result for domestic consumption and exports in Tables 4 and 5. Because the elasticity of substitution impacts supply and demand functions along the supply chain, changes in these parameters affect the results. Also, since the literature does not provide estimates for Canadian, Mexican, and ROW demand price elasticities, we conduct sensitivity analyses for these parameters, which has direct effects on the quantity of trade flow between the United States and these countries.
Table 4. Sensitivity analysis results

a The results indicate percent changes from the baseline.
Table 5. Sensitivity analysis results

a The results indicate percent changes from the baseline.
A lower elasticity of substitution leads to a slight fall in domestic consumption and exports of all chicken products relative to the main results reported in Table 2, but the drop is modest. Domestic consumption and exports decline slightly as the elasticity of substitution falls because, with the decline in the price of corn and soybean meal, the breeder farms and grow-out farms have less flexibility to enhance feed output by substituting away from other inputs in the feed segment. The smaller impact on feed dampens the results throughout the supply chain. The converse is true for a higher elasticity of substitution.
With lower and higher elasticity of demand for Canadian, Mexican, and ROW, the sensitivity results show modest impacts on most variables. However, with a lower Canadian elasticity of demand, exports to Canada fall slightly. In general, fewer exports to Canada imply that more broiler products are available for exports to Mexico and ROW and domestic consumption. Relative to the main analysis, total production of whole chickens and value-added products increases marginally, whereas total production of chicken parts declines slightly (not reported in Table 4). Therefore, domestic consumption of whole chickens and value-added production rises slightly, relative to the main results in Table 3. For chicken parts, domestic consumption of dark meat rises, but domestic consumption of chicken breast meat falls. Even with lower production, consumption of dark meat rises because exports to Canada fall. However, because the United States has no exports to Canada to offset the decline in production, domestic consumption of breast meat falls. For chicken wings, the decline in production is offset by the fall in exports to Canada and domestic consumption is unaffected. The results for the sensitivity analysis for Mexico and ROW are similar to those of Canada.
In summary, the sensitivity analysis reveals that changes in the elasticity of substitution and ROW elasticity of demand do impact the results, but the impacts are modest. Furthermore, the conclusions from the main results in the preceding sections are maintained.
5. Discussion and conclusions
This paper builds a comprehensive supply chain model of the US broiler industry that accounts for corn and soybean meal, feed mills, breeders, hatcheries, grow-out farms, broiler processing, value-added processing, and international trade. This broiler supply chain model is calibrated based on parameters from the literature and US broiler data. Recent developments in US international trade policy—the US–China trade war and the USMCA trade agreement—can impact the broiler supply chain. China's retaliatory tariffs on corn and soybeans led to an oversupply of corn and soybeans in the US market leading to a decline in feed costs. Also, if the USMCA trade agreement is signed by the three North American countries, the US broiler industry will have enhanced access to Canada's market. Therefore, this study considers two counterfactual scenarios: the first scenario simulates the effects of a shock to the corn and soybean meal prices due to corn and soybeans tariffs imposed by China on the US broiler supply chain. The second scenario analyzes the impacts of the change in the Canadian TRQ as proposed under the USMCA throughout the entire broiler supply chain.
The results from the first scenario suggest that the lower US price of feed resulting from the Chinese tariffs on corn and soybeans largely benefits the broiler supply chain because cost of production declines which expands production at every level. As a result, prices for every segment (except fertilized eggs and DOC) fall. Specifically, as the price of corn and soybeans in the US market falls, feed supply increases which depresses the feed price and directly lowers the production costs of breeders and grow-out farms. The lower feed costs cause production of breeders and grow-out farmers to rise, which increases demand for DOC and thus fertilized eggs by grow-out farmers. Because feed directly enters both breeder farm and grow-out farms, it is ex ante unclear whether the supply effect through breeders or demand effect through grow-out farms will dominate and the price of DOC will rise or fall. The results reveal that the increase in demand outweighs the increase in supply, causing the price of fertilized eggs and DOC to rise.
The increase in broiler chickens lowers the price of broiler chickens, which lowers the cost for all downstream segments. As a result, production expands and prices decline. With lower prices, both domestic and international consumers of whole chickens, chicken parts (wings, chicken breast, and dark meat), and value-added chicken products benefit as consumption expands. Thus, while the Chinese tariff on corn and soybeans undoubtedly makes corn and soybean producers worse off, the chicken industry benefits from lower costs.
While US consumption of dark meat rises the most in percentage term, it increases the least in differences because initial consumption of dark meat is low. Furthermore, consumption of breast meat expands the most in differences, followed by value-added products. These results occur because US consumers largely favor white meat and processed chicken products over dark meat. Consequently, US exports of dark meat rise the most both in percentage terms and differences.
The results from the second scenario indicate that the enhanced access into the Canadian market resulting from a USMCA deal has modest impacts on aggregate production and prices for the US broiler supply chain. This is because the quota only falls by 17.5% for the TRQ and the tariff rates remain unchanged. The largest impacts of USMCA will occur in US exports of dark meat and value-added products to Canada, which rise at the expense of exports to Mexico and ROW. Because chicken wings are produced in fixed proportion to dark meat and the expansion of exports of wing meat to Canada is relatively low compared to dark meat, the increase in total wing meat production is substantial enough for both exports and domestic consumption to rise. Also, because chicken breast meat production is in fixed proportion to dark meat and breast meat is not exported, domestic consumption of breast meat falls. Finally, to expand production of exported commodities, broilers are diverted from whole chicken sales to the exported commodities, and domestic consumption of whole chickens falls.
The sensitivity analysis provides insight into how the simulation behaves under different assumptions for the elasticity of substitution between inputs in the feed mill and grow-out farm segments and elasticity of demand for Canada, Mexico, and ROW. In general, a lower elasticity of substitution reduces the ability of feed mill and grow-out farm to switch between inputs, which leads to smaller overall impacts. A lower elasticity of demand for a given country results in fewer exports (relative to the case with a higher elasticity of demand) to that country as domestic consumption and exports to other countries rise.
From a policy perspective, the US–China trade war benefits the broiler industry because of lower feed prices. However, we caution against overinterpreting this result because (1) this analysis provides a narrow view of the overall trade war and (2) the broiler industry is a small segment of the overall corn and soybean market. Enhanced market access through USMCA benefits the US broiler industry because both production and prices rise, implying enhanced profitability through the supply chain. However, the overall impact of USMCA is moderate because the expansion of the quota is modest relative to the overall size of the industry.
Supplementary material
To view supplementary material for this article, please visit https://doi.org/10.1017/aae.2020.5
Acknowledgements
We gratefully acknowledge the editorial coordination by the editor Michael Reed and three anonymous reviewers.


 Open access