


Introduction
Environmental problems such as global warming and air pollution put enormous pressure on our ecosystems and pose serious threats to human society. Environmental degradation may be conceptualised as a collective action problem, where the individual benefits are in conflict with the collective benefits (Kollock Reference Kollock1998). Individual actors reap the benefits of their consumption or production choices, while the costs, in terms of environmental degradation, are shared. Hence, actors are likely to continue polluting, thus increasing the demand for third-party (state) intervention, typically materialised through public policy, to steer actors towards more sustainable choices that will benefit the collective (Mansbridge Reference Mansbridge2014; Jagers et al. Reference Jagers, Harring, Löfgren, Sjöstedt, Alpizar, Brülde, Langlet, Nilsson, Almroth, Dupont and Steffen2020). However, the implementation of policies aimed at reaching environmental goals typically present difficulties for decisionmakers and implementers, as these policies need to be publicly accepted in order to be effective in achieving their environmental goals. If public opposition to accept the measures is too pervasive, politicians are likely to hesitate to implement them (Glynn et al. Reference Glynn, Herbst, O’Keefe, Shapiro and Lindeman1999).
Previous research on environmental policy has identified a number of factors that predict policy support, such as cost perception, level of coerciveness, effectiveness, fairness, political trust, and ideology (Drews and Van Den Bergh Reference Drews and Van Den Bergh2016). However, reviews have also concluded that researchers tend to study different categories or composite scales of environmental policies, varying both in the level of coercion and administrative design (for overview, see e.g. Drews and Van Den Bergh Reference Drews and Van Den Bergh2016; Ejelöv and Nilsson Reference Ejelöv and Nilsson2020). In addition, they often investigate preferences for distinct policy tools, such as specific taxes or carbon off-setting (e.g. Kallbekken et al. Reference Kallbekken, Kroll and Cherry2010, Reference Kallbekken, Kroll and Cherry2011; Parag et al. Reference Parag, Capstick and Poortinga2011; Cherry et al. Reference Cherry, Kallbekken and Kroll2012; Harring and Jagers Reference Harring and Jagers2013; Nilsson et al. Reference Nilsson, Hansla, Heiling, Jakobsson Bergstad and Martinsson2016a, Reference Nilsson, Schuitema, Jakobsson Bergstad, Martinsson and Thorson2016b; Jagers et al. Reference Jagers, Matti and Nilsson2017). We argue that there are both benefits and problems with all the current ways of measuring support for environmental policies, based on which specific policies are included in research.
Firstly, measuring support for a specific policy, such as attitudes towards a carbon tax in a given country, has the advantage of not needing to rely on possibly invalid categorisations of policies. However, measuring support for one specific policy may not result in generalisable knowledge for researchers or policymakers, as it does not convey whether factors determining support for said carbon tax also predict support for potentially similar policies, such as an energy tax.
Alternatively, researchers use composite scales to gauge policy support, by for example combining regulatory measures, taxes, and subsidies (e.g. Zahran et al. Reference Zahran, Brody, Grover and Vedlitz2006; Dietz et al. Reference Dietz, Dan and Shwom2007; Shwom et al. Reference Shwom, Bidwell, Dan and Dietz2010). This way of researching policy support has the advantage of potentially capturing factors that predict support for policies in general, such as research indicating that endorsing a right-wing political ideology tends to negatively predict support for environmental policies in general (Drews and Van Den Bergh Reference Drews and Van Den Bergh2016; Ejelöv and Nilsson Reference Ejelöv and Nilsson2020). However, using composite scales of policy support neglects the fact that certain determinants may only predict support for one category of policies but not another, thus limiting the research’s ability to detect such differences.
Thirdly, and perhaps most importantly, researchers also study determinants of policy support using different theoretical categorisations of policies. These theoretical categorisations are often based on how the public may perceive policies. For example, a distinction between regulatory and market-based instruments can be made based on empirical evidence that people to an extent devalue policies with more visible costs (e.g. Stadelmann-Steffen and Dermont Reference Stadelmann-Steffen and Dermont2018), while a distinction between push and pull policies can be made based on evidence that people devalue policies that restrict individual freedom (e.g. Eriksson et al. Reference Eriksson, Garvill and Nordlund2006). Importantly, each of these theoretical categorisations is designed to only capture one-factor determining policy support. As such, one study may determine that regulatory instruments are more acceptable than market-based instruments because the latter involves more visible costs to consumers, while another study may determine that prohibitions (example of regulation) are less acceptable than subsidies (example of market-based instrument) because people respond negatively to policies that restrict rather than promote behavior. What are policy makers to make of these disparate results? Are regulations in general more acceptable than market-based instruments or is it contingent on whether a regulation is perceived as inhibiting or not? We argue that the extent to which policy makers can trust that e.g. regulations are evaluated as more acceptable than market-based instruments depend on whether researchers have measured support for regulation in an exhaustive way. That is, if researchers have included enough policies that capture all the ways that regulations may differ (depending e.g. on environmental domain, level of constrain, and cost visibility).
Thus, we identify two issues with the current ways of measuring both support for environmental policies and determinants of support: ((1) measuring support using specific policies, composite scales, and theoretical categorisations of policies all entail the possibility that researchers do not represent policies well enough to capture all the ways that policies may differ. This limits researchers’ ability to generalise results to other policy instruments or areas. (2) Utilisation of theoretical categorisations may not provide a unified picture of acceptability levels for different policy instruments, as such categorisations are often based on only one determinant of acceptability.
We argue that one way of overcoming these issues is to assess the public’s attitudes towards an exhaustive list of environmental policies, in order to determine how policies cluster together based on their acceptability ratings. Acceptability or support for policies is most often the outcome variable of interest for feasibility deliberations, and categorisations based on overall evaluations of acceptability ought to capture multiple factors determining acceptability. Therefore, we argue that future research may utilise the results of this study to examine the relative importance of separate determinants of policy support. Lastly, this research also allows us to validate whether theoretical categorisations currently used correspond to the laypeople perspective of policies. We primarily aim to contribute to the literature on attitudes toward climate and environmental policies, however our study could potentially also be relevant for other similar policy fields such as health (e.g. the consumption of fat and sugar or the use of antibiotics) where the state aim to steer actors towards more sustainable behavior.
Thus, the ultimate objective of this article is to develop an empirically founded taxonomy of environmental policy instruments based on the policy attitudes among laypeople. In doing this, our research has been guided by the following research questions:
-
1. What categories of environmental policy do citizens discern?
-
2. Do these correspond to those applied by researchers?
-
3. Are certain categories of polices more acceptable than others?
In the remaining part of the article, we first review previous theoretical and expert-based categorisations of environmental policies. We thereafter account for the methodology, followed by a result section, a discussion, suggestions for future research, a section elaborating on implications for policymakers, and a final section with concluding remarks.
Categorisations of policy
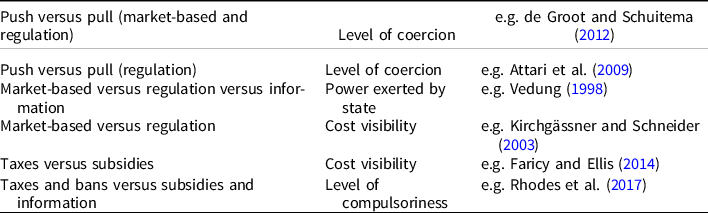
Environmental policies have most often been categorised and studied based on their level of coerciveness, their administrative design, or a combination of the two. To begin with, in much of behavioral and social science research, a distinction is commonly made between policies that are either rewarding or punishing. Policies that reward pro-environmental behavior are often termed pull measures, while policies that punish environmentally harmful behavior or have the purpose of internalising environmental externalities, are referred to as push measures (e.g. Steg et al. Reference Steg, Dreijerink and Abrahamse2005; Eriksson et al. Reference Eriksson, Garvill and Nordlund2006; Eriksson et al. Reference Eriksson, Garvill and Nordlund2008; Kallbekken and Aasen Reference Kallbekken and Aasen2010; Schuitema et al. Reference Schuitema, Steg and van Kruining2011; de Groot and Schuitema Reference de Groot and Schuitema2012; Harring et al. Reference Harring, Matti and Jagers2017; Hermann et al. Reference Hermann, Sauthoff and Musshoff2017; Harring Reference Harring2018). Push measures are typically rated as less acceptable than pull measures, presumably because they are perceived as restricting individual freedom to a greater extent than pull measures are argued and assumed to do (e.g. Eriksson et al. Reference Eriksson, Garvill and Nordlund2006; Schuitema et al. Reference Schuitema, Steg and van Kruining2011; Cherry et al. Reference Cherry, Kallbekken and Kroll2012). However, people may also place greater weight on different dimensions when evaluating these measures, assessing push measures more in terms of fairness, and pull measures more based on effectiveness perceptions (Eriksson et al. Reference Eriksson, Garvill and Nordlund2008). Others further argue that the lower acceptability of push measures is due to perceptions of higher financial and behavioral costs (Drews and van der Bergh Reference Drews and Van Den Bergh2016). While much of the research is focused on the difference between these two categories, researchers have also highlighted that there may be differences within each of the respective categories, such as behavioral cost (de Groot and Schuitema Reference de Groot and Schuitema2012) and relatedly, whether the targeted behavior is performed repeatedly, or as a one-shot behavior (Steg et al. Reference Steg, Dreijerink and Abrahamse2005). However, these latter two theoretical distinctions have not been supported by a subsequent principal component analysis on policy attitude ratings, possibly due to small sample size and nonexhaustive policy items (Steg et al. Reference Steg, Dreijerink and Abrahamse2005).
The notion that policies may vary both with respect to the level of coercion they exert and their rewarding or punishing mechanism, is neither new, nor unique to psychological research (e.g. Bernard Reference Bernard1939; Anderson Reference Anderson1977). Simultaneously, researchers from other fields have made different, although to some extent overlapping, categorisations of policies. For example, environmental policies can, according to Vedung (Reference Vedung, Bemelmans-Vidce, Rist and Vedung1998), be seen as an expression of the state’s ability to exercise its’ power over individuals and other societal actors – power that can be expressed either through persuasion, encouragement or punishment. Often with inspiration from Vedung (Reference Vedung, Bemelmans-Vidce, Rist and Vedung1998), political scientists have used these different expressions of power when classifying environmental instruments and typically make a distinction between three types of policies that are based on their assumed level of constrain; i.e. regulation, economic incentives- and information. Information (or, persuasion) refers to policies that facilitate and inform free choice and are here assumed to be the least constraining type of policy. Regulations (or, punishments) are categorised as the strictest intervention and is highly choice constraining, while economic incentives (or, rewards) are viewed as moderately choice constraining. In this categorisation, regulation could be argued to overlap with push measures while many economic incentives (though not those aimed at internalising externalities, such as environmental taxes) and information tend to overlap with pull measures (Harring and Jagers Reference Harring2018). Relatedly, others also categorise policies based on their level of compulsoriness, that is, the degree to which a policy enforces a specific action (Rhodes et al. Reference Rhodes, Axsen and Jaccard2017). Examples of policies that are high in compulsoriness are both taxes and regulations that enforce a particular standard, while examples of policies low in compulsoriness are voluntary subsidies and educational programs. Compulsory policies have been shown to be less supported than more voluntarily-based policies (Rhodes et al. Reference Rhodes, Axsen and Jaccard2017), corresponding to the research showing that pull measures tend to receive a higher support than push measures among the public (Dietz et al. Reference Dietz, Dan and Shwom2007).
Yet other scholars make a distinction between regulations that are either rewarding or punishing (Attari et al. Reference Attari, Schoen, Davidson, DeKay, de Bruin, Dawes and Small2009). On the one hand, soft regulation can be regarded as a rewarding regulation, in that it makes some options more attractive than others, thus encouraging behavioral change without substantially restricting choice. On the other hand, hard regulations entail financial or legal costs for noncompliance.
Other researchers instead make a distinction between policies based solely on their underlying administrative design, with regulation on the one hand, and market-based instruments (including both push measures, e.g. taxes, and pull measures, e.g. subsidies) on the other hand (Jordan et al. Reference Jordan, Wurzel and Zito2003). Some indirect support for this latter division of policies also comes from a study showing that people who view taxes (market-based push measure) as effective measures, also view subsidies (market-based pull measure) as effective, while they do not view, for example, fines (regulation-based push measure) as particularly effective (Harring Reference Harring2014). These results point to the possibility that some citizens rather make their categorisations based on the administrative design of the policy, at least in terms of whether or not a policy is perceived to be effective in achieving its’ environmental goal.
Researchers have also made further subcategorisations of policies. For market-based instruments, some scholars distinguish between direct and indirect measures, such as direct payments or tax breaks (Zelinsky Reference Zelinsky2005; Haselswerdt and Bartels Reference Haselswerdt and Bartels2015). Here, the assumed difference is that the link between the policy intervention and its’ effect is more obscured for indirect than for direct policy measures (Arnold Reference Arnold1990; Hacker Reference Hacker2002; Mettler Reference Mettler2011). This is often referred to as the salience of a policy. Policies with more concentrated costs or benefits are more easily noticed and affect behavior to a larger extent than policies with less concentrated costs and benefits (Lowi Reference Lowi1964; Wilson Reference Wilson and McKie1975; Olson Reference Olson1982; Chetty et al. Reference Chetty, Looney and Kroft2009), and are presumably for this reason less acceptable (Harrison Reference Harrison2012; Rhodes et al. Reference Rhodes, Axsen and Jaccard2017). To an extent, researchers differ in which policies they argue have more visible costs. Some show that regulatory policies are more acceptable than market-based instruments (Kirchgässner and Schneider Reference Kirchgässner and Schneider2003; Stadelmann-Steffen Reference Stadelmann-Steffen2011), and consequently argue that the difference is due to regulatory measures entailing more obscure costs than market-based instruments (Stadelmann-Steffen and Dermont Reference Stadelmann-Steffen and Dermont2018). Others yet argue that taxes entail more salient costs than subsidies (Jagers and Hammar Reference Jagers and Hammar2009; Mettler Reference Mettler2011; Faricy and Ellis Reference Faricy and Ellis2014). However, when the individual cost of policies is presented equivalently, regulations are less preferred than both taxes and subsidies (Cherry et al. Reference Cherry, Kallbekken and Kroll2012). Thus, divergent results may be due to how the costs of policies are presented to the public.
Other researchers have studied policy instruments categorised as taxes, regulation, information, and rewards, and found that the different categories show varied scale reliability, since Cronbach’s α tends to range from everything below .5 up to .75 (Harring et al. Reference Harring, Matti and Jagers2017). Clearly, some instruments may group better than others in terms of acceptability. Finally, it is not uncommon among economists to make a distinction between policies either using markets (e.g. subsidy reduction, taxes, charges, deposit–refund systems) or creating markets (e.g. property rights, tradable permits, international offset systems) (Sterner and Coria Reference Sterner and Coria2013).
In summation, public policies have most often been categorised and studied based on their level of coerciveness, their administrative design, or a combination of the two (see Table 1). Today there is not one established way of categorising environmental policies, and the existing categorisations typically overlap. In addition, all these categorisations are based on researchers’ and analysists’ perspective on how policy is grouped, and may not necessarily capture all the dimensions that the general public evaluates policies on. This means that when such categorisations are employed in the study of environmental policy acceptability, there is no way of knowing to which other policies results (of one policy) may generalise to. Furthermore, if a policy category used is not exhaustive enough to be representative of that category, researchers may draw invalid conclusions about the observed effects. It might be that all of these expert-based or theory-based categorisations are valid, but this is an empirical matter yet to be investigated. Furthermore, when studying the acceptability of policies, it is vital that policies that are grouped together actually share underlying attitudes, as this may allow us to generate more transferable knowledge and gain an understanding of what policy design features generate high or low support for the policy.
Table 1. Overview of commonly used categories of environmental policy and associated mechanism
Research strategy
Based on this theoretical and empirical background, we have a threefold aim with the study. First, we intend to investigate how policies can be categorised according to how they are perceived by laypeople, in order to provide researchers and policymakers with an empirical taxonomy of policies that is based on public support. We make no predictions as to what or how many underlying dimensions of environmental policies there are, but instead approach this research question using an exploratory factor analysis. We may however interpret results based on the theoretical distinctions made earlier. As summarised, policies have been categorised based on the assumption that people’s preference for policy is based on either: how rewarding/punishing the policy is, the level of power the state is exerting, and how visible the cost of the policy is. If people evaluate policies based only on the level of coerciveness, we may expect people’s policy ratings to form two clusters, reflecting push and pull policies. If people evaluate policies based on the amount of power the state is exerting, we may expect people’s policy ratings to form three clusters, reflecting regulatory measures, market-based measures, and informational measures. If instead people base their preferences on cost visibility, we should perhaps expect people’s policy ratings to form two clusters, reflecting regulations and market-based incentives.
The second aim is to start developing scales for measuring the categories of environmental policies that laypeople perceive based on their attitudes towards them. Finally, as previous research has studied either specific policies, composite indexes of policy, or different theoretical categorisations of various policies, it is difficult to ascertain whether certain individual-level variables, such as gender and political ideology, are only associated with support for specific policies, or whether such variables would similarly be able to predict support for policies based on some (ideally empirically founded) categorisation, such as environmental domain or administrative design. Political ideology tends to have a large impact on policy attitudes, with liberal and left-wing individuals showing higher support for environmental policies than conservatives and right-wing individuals (Drews and Van Den Bergh Reference Drews and Van Den Bergh2016; Ejelöv and Nilsson Reference Ejelöv and Nilsson2020). In Sweden specifically, left-right wing orientation has been shown to mostly affect support for taxes and regulation, but show weaker effects for subsidies and informational policies (Harring et al. Reference Harring, Matti and Jagers2017). The effect of demographic variables, on the other hand, tends to be rather small (Hornsey et al. Reference Hornsey, Harris, Bain and Fielding2016; Beiser-McGrath and Huber Reference Beiser-McGrath and Huber2018). While there is some evidence that women, younger people, and those residing in urban versus rural areas are more supportive of environmental policies (Elliot et al. Reference Elliott, Seldon and Regens1997), later research suggest that age and urban versus rural residence do not have any clear effects on policy support, but that gender effects seem to be larger for more coercive policies (Rhodes et al. Reference Rhodes, Axsen and Jaccard2017). Others studies indicate that the influence of demographic variables such as gender, age, and urban versus rural place of residence disappears once environmental values or political ideology is introduced (Salka Reference Salka2001; Bornstein and Lanz Reference Bornstein and Lanz2008; Nilsson et al. Reference Nilsson, Schuitema, Jakobsson Bergstad, Martinsson and Thorson2016b; Larsson et al. Reference Larsson, Matti and Nässén2020). This suggests that many demographic effects may be accounted for by ideology differences. The third aim of this study is, therefore, to investigate if the policy dimensions identified in this study are also related to ideological orientation and demographic factors such as age, gender, and rural versus urban residency.
Method
Sampling procedure
In order to provide an exhaustive taxonomy of policies, we sample active environmental policies in Sweden. Although no general conclusions can be drawn from only studying one case (out of more than 200 in the world), a focus on Sweden comes with some significant benefits. First of all, Sweden is a country with a long history of active environmental politics, going all the way back to the mid-1960s (Lundqvist Reference Lundqvist2004; Heidenblad Reference Heidenblad2021). Consequently, there is by now an exhaustive number of environmental policies in operation (cf. Duit Reference Duit2016; Lim and Duit Reference Lim and Duit2018). Thus, we can expect that most respondents are not completely unaccustomed to the policies (and types of policies) assessed in this study. Second, the quality of Sweden’s political and administrative institutions is typically ranked high, or even exceptionally high (e.g. ranked third on the Corruption Perception Index from Transparency International 2020: https://www.transparency.org/en/cpi/2020/index/). We believe this reduces the risk that policy evaluations will be biased by the degree to which respondents think the state is able to implement and administer the policies as intended. This is a component that may otherwise affect how the participants are responding to the survey questions.
We began our sampling by collecting policies from two reports from the Swedish Environmental Protection Agency; Styrmedel för att nå miljökvalitetsmålen – en kartläggning [Policies to achieve the national environmental quality objectives – a survey] (2012) and Styrmedel för hållbar konsumtion [Policies for sustainable consumption] (2015). We additionally searched the websites of The Swedish Transport Agency, The Swedish Environmental Protection Agency, The Swedish Energy Agency, The Swedish National Board of Housing, Building and Planning, and The Swedish Tax Agency, for additional policies and policies that were implemented after 2015. The additional search was performed between 1 October 2018 and 1 November 2018. From these two searches, we ended up with a list of 143 environmental policies. As we are primarily interested in environmental policies that target individual behavior, we decided to exclude policies that (1) did not target/affect private consumers, (2) aimed to reduce noise, (3) aimed to improve radiation control, (4) aimed to protect natural resources, such as biological diversity, and (5) were no longer active. After removing duplicates and policies that met our exclusion criteria, our final sample consisted of 44 policies (see Supplementary material for list of policies). The policy descriptions presented to participants were gathered from the responsible governmental agency (e.g. descriptions of policies concerned with transportation were collected from the Swedish Transportation Agency’s website). We excluded information about the aim of the policy and any financial information (e.g. current tax rates or size of a specific subsidy). Financial information was omitted to ensure that any potential differences between policies, e.g. between regulations and market-based instruments, were not due to methodologically created misperceptions of costs and benefits. Thus, we aimed to only include information about the specific policy instrument used and what the instrument was targeting (e.g. tax (instrument) on energy (target)). Descriptions that included references to a specific person (e.g. “you as a consumer”) were changed into a more generalised reference (e.g. “consumers”).
Participants
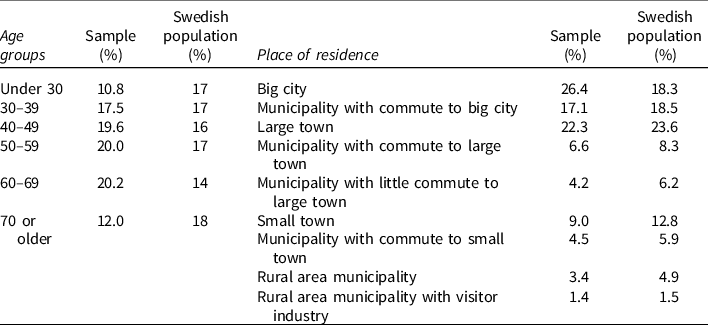
Survey data was collected using the Citizen Panel at the Laboratory of Opinion Research (LORe) at the University of Gothenburg. The Citizen Panel consists of a self-recruited sample with over 60.000 active Swedish participants (see lore.gu.se for more information). Participation in the Citizen Panel is always voluntary, and respondents are free to leave the panel at any time. The participants do not receive payment for their participation. The study followed established Swedish ethical guidelines for survey data and was thus also conducted in line with the declaration of Helsinki. We aimed to collect data from 3000 participants and based our sample size on the exploratory nature of the study. Since we did not know how many factor loadings would emerge or how strong the correlations between items would be, we erred on the side of caution and collected data from a larger sample. The survey was distributed to 5200 Citizen Panel participants between February 22 and March 27 in 2019. Three reminders were sent out. Approximately 2911 participants (51.5% men, Swedish population = 50.3% men) completed the survey. While fairly representative for the Swedish population, our sample slightly underrepresents participants younger than 17 and older than 70 years, as well as slightly overrepresents people living in big cities (see Table 2).
Table 2. Frequency of sample age and residence groups compared to Swedish population 2018
Procedure
At the beginning of the survey, participants were informed that they were participating in a survey about attitudes towards environmental policies in Sweden. Each participant then indicated their attitude towards 22 randomly selected policies, that is, 50% of the items, to reduce fatigue effects and dropouts. Participants were asked to indicate how acceptable they found each specific policy on a 7-point Likert scale ranging from 1 – Not at all acceptable to 7 – Completely acceptable. After the policy questions, participants were asked to indicate their ideological position on a 11-point political ideology scale ranging from 0 – Far left to 10 – Far right, with 5 indicating identification neither to the left or right. Demographic questions on age, gender, and place of residence had been assessed previously when participants signed up for the LORE Citizen Panel. The imputation and data analysis plan were preregistered before data collection, and is available on the Open Science Framework (https://osf.io/yzqmb/?view_only=2813bc39fd454320808399ac1bd81377).
Simulation of expectation-maximisation imputation
As our data consisted of 50% values missing by design, and factor analysis cannot be performed with such a high degree of missing data, we had planned to impute those values with an expectation–maximisation method. This imputation method has been shown to outperform alternative imputation methods for this amount of missing data (Chen et al. Reference Chen, Wangb and Chen2011). As a robustness check to evaluate how the single expectation–maximisation imputation performed with our specific data set, especially given that it was slightly skewed, we performed a simulation. The purpose of the simulation was to confirm that factor analysis performed with a high degree of imputed data using the EM approach would yield similar results as factor analysis with 0% missing data, given the same parameters. In 1000 iterations, we created a random dataset consisting of three latent factors, with the same average skewness (=−.6), number of participants, and number of variables. We randomly removed 55% of the values to create missing values at the approximate level of missing values in our data set. We performed a parallel analysis and saved the number of extracted factors for each imputed dataset. We also performed an exploratory factor analysis for each imputation and compared it to the complete data set, saving the mean difference between the factor loadings from the imputed dataset and the original dataset. The simulation showed that the imputation method resulted in a correct number of extracted factors (n = 3) in 100% of the iterations. The mean error of the factor loadings for the three factors ranged from .03 to .05. The EM imputation was therefore judged to perform well given the parameters of our data. The r code for the simulation is available on the Open Science Framework (https://osf.io/86cy7/?view_only=b1559f331be742f9a817e59dcd2da5ee)
Results
Exploratory factor analysis
An exploratory factor analysis using maximum likelihood estimation was conducted on the 44 policy items. For ease of interpretation, we rotated factors using oblique rotation (promax), allowing factors to correlate. Parallel analysis (Horn Reference Horn1965) indicated a three-factor solution, with the factors explaining 67% of the combined variance in the attitude ratings. Table 3 shows the factor loadings after rotation. The policies loading on the first factor, with the strongest loadings seen for “CO2 tax on fuel” and “Congestion charge on road traffic” suggest that this factor represents policies that entail taxation of environmentally harmful behavior and governmental/municipal regulation, corresponding to both market-based and regulatory push policies. The policies loading on the second factor with the strongest loading seen for “Subsidy for electrical charging stations, in the form of ROT (repairs, conversions, extensions) deduction” and “Five year tax exemption on green cars” indicates that this factor represents governmental subsidies and deductions. This factor largely corresponds to financial pull policies. Items loading on the third factor indicate that this factor represents informational policies, with the exception of two items consisting of a tax deduction and a refuse collection fee. The two strongest loadings are seen for “Information on the origin of food” and “energy-labeling on products”. Six items had loadings under .4 and one item loaded on both the second and third factor. Items with loadings under .4 were removed before calculating factor scores. The three factors, although distinct, had a high inter-correlation ranging from .81 to .83. In addition, mean average for all three factor scales was above the midpoint on the measurement scale (4), indicating that people were on average more positive than negative towards environmental policies.
Table 3. Rotated factor loadings (Promax) and raw scores (M, SD)
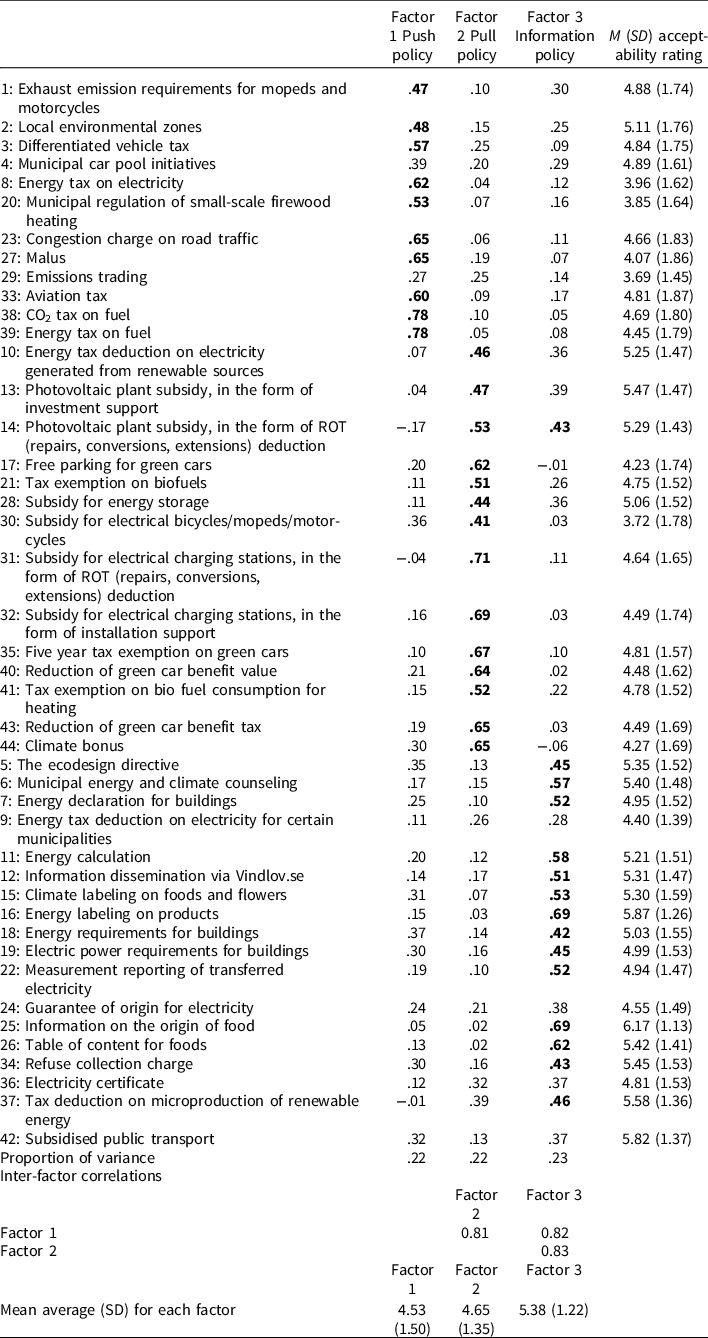
RMSEA = .027 CI [.025, .028], TLI = .99.
Note: Factor loadings over .40 are in bold.
To provide researchers with more efficient scales, we began by firstly removing items that had a loading under .4 and also crossloadings over .3. With these criteria, we ended up with a shortened 25-item scale (see Supplementary material), with 9 items for push policies, and 8 items for pull and information policies, respectively. This solution provided as good-a-fit as the original factor structure. However, we also wanted to provide an even shorter 12-item scale for researchers to effectively measure all three categories (see Table 4). We wanted to see if each category could effectively be measured with four items each. When reducing items, we aimed to maintain the four items with the highest loadings, but only maintain policies that were semantically different from each other. In the case of taxes, we only maintained the tax with the highest factor loading, when there were multiple subsidies, we only maintained the subsidy with the highest factor loading, etc.
Table 4. Rotated factor loadings (promax) and raw scores (M, SD) for 12-item scale
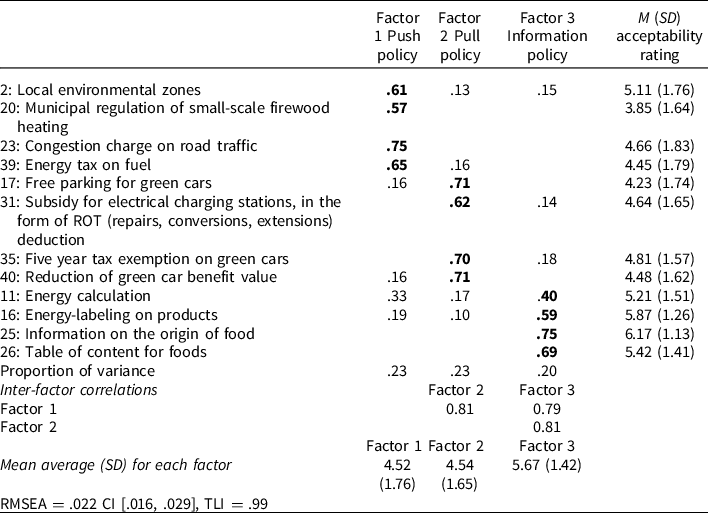
Note: Factor loadings after removal of loadings under .4, crossloadings over .3 and semantically similar items.
The parallel analyses for the two shortened scales both resulted in three extracted factors, with similar loadings, explained and proportional variance, and inter-factor correlation. However, the means and standard deviations are somewhat different between the three scales. The standard deviations increase as the number of items are reduced, and the mean difference between the push and pull categories becomes smaller with a reduced amount of items.
Multiple regressions
We ran three multiple regressions to estimate the effect of gender (coded: 0 = female, 1 = male), age, political ideology, and rural/urban residence on the factor scores for each latent factor (see Table 5). We used the regression-based TenBerge factors scores, as it preserves correlations between factors and thus is suitable for oblique factors (Ten Berge et al. Reference Ten Berge, Krijnen, Wansbeek and Shapiro1999). Age, political ideology, and rural/urban residence (higher value indicating more sparsely populated areas) were mean-centered for the analyses. Increased age, being male, having more right-wing political attitudes, and residing in less densely populated areas negatively predicted attitudes towards all three categories of environmental policies. The effect of political ideology consistently explained most of the combined variance in attitude ratings (30–44%), followed by age (9–11%) and place of residence (8–12%). The effect of gender appeared to explain the least amount of combined variance (5–8%). The socio-sdemographic variables and political ideology were most predictive of push policies, followed by informational policies and pull policies. As can be seen in Figure 1, while left-wing voters are more positive to environmental policies in general compared to middle and right-wing voters, push policies are descriptively left-wing voters most preferred type of policy while it is the least preferred policy type of right-wing voters, while pull policies are left-wing voters least preferred policy and right-wing voters most preferred type of policy. People scoring on the middle of the ideology scale do not appear to prefer one specific type of policy over another.
Table 5. Summary of three multiple regressions on factor scores for each factor
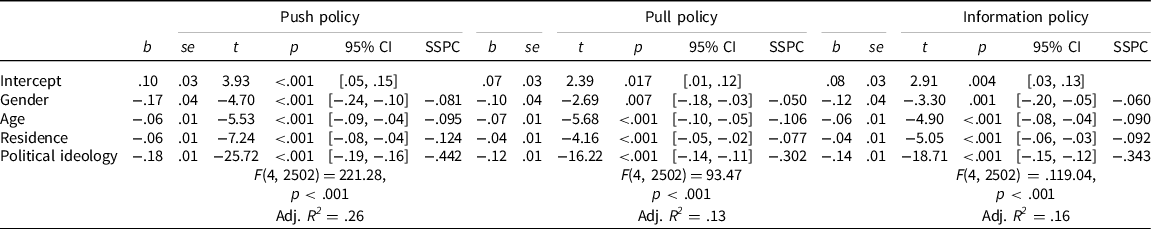
Note: SSPC stands for squared semipartial correlation.
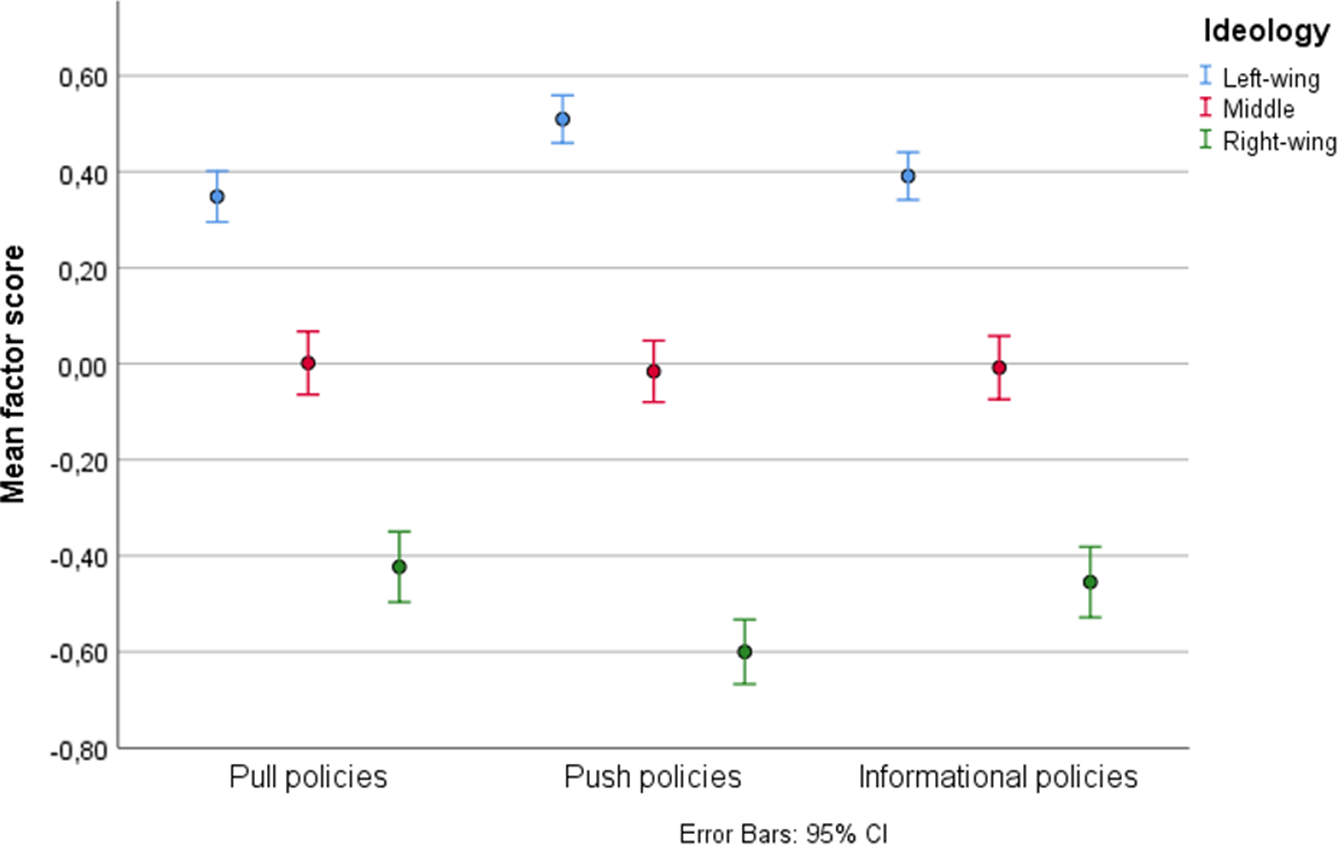
Figure 1 Note: Left-wing = 0–3, Middle = 4–6, Right-wing = 7–10, on political ideology scale. Error bars indicate 95% confidence intervals.
The multiple regressions on factor scores for the 25-item and the 12-item scales showed almost identical results as the full factor model (see Supplementary material), providing additional evidence that the shortened scales may be used instead of the full list of items.
Discussion
Based on a wide range of environmental policies in Sweden, our sample indicate that the policies currently in use in Sweden can best be explained by a three-factor solution, with push policies consisting of regulations and market-based disincentives forming one factor, pull policies mainly consisting of market-based incentives forming a second factor, and information policies forming a third factor. Although the three factors were highly inter-correlated, each factor has 31–34% unique variance, indicating that they are in fact rather distinct categories. We additionally developed two preliminary shortened scales to provide researchers with more efficient scales for measuring these policy categories. While these scales need to be further validated with a confirmatory factor analysis, the similar results for the three-factor analyses and the multiple regressions suggest that the three scales do indeed measure the same constructs. The 25-item scale may be better suited for research on only one of these categories, where there is sufficient space to measure a specific category with eight or nine items. The 12-item scale may instead be preferred when researching all three categories in one study, and where limited space warrants fewer items.
At least in Sweden, it appears that a generalised distinction between pull and push measures (e.g. Steg et al. Reference Steg, Dreijerink and Abrahamse2005; Eriksson et al. Reference Eriksson, Garvill and Nordlund2006; Eriksson et al. Reference Eriksson, Garvill and Nordlund2008; Schuitema et al. Reference Schuitema, Steg and van Kruining2011; de Groot and Schuitema Reference de Groot and Schuitema2012; Harring et al. Reference Harring, Matti and Jagers2017; Harring Reference Harring2018) may not be adequate, as people seem to differentiate between low constraint policies offering financial rewards and those offering information or providing standards. Although Vedung (Reference Vedung, Bemelmans-Vidce, Rist and Vedung1998) made a distinction between regulatory policies and economic incentives, our data suggest that Swedish citizens view economic disincentives as part of the same factor as regulatory policies. Rather, this factor structure appears to be a mix between the policy distinction made by Vedung (Reference Vedung, Bemelmans-Vidce, Rist and Vedung1998) and the psychological distinction between push and pull policies. Some research suggests that incentive-based instruments are less acceptable than regulatory measures, presumably because the former entails more visible costs (Kirchgässner and Schneider Reference Kirchgässner and Schneider2003; Stadelmann-Steffen Reference Stadelmann-Steffen2011). Our results partly go against this view in showing that regulatory and incentive-based measures are perceived similarly and receive similar levels of acceptability when considered within the same category. This is in line with some previous research suggesting that a distinction between market-based and regulatory measures is not as helpful as a distinction between pull and push measures when it comes to studying feasibility (Wicki et al. Reference Wicki, Fesenfeld and Bernauer2019). However, it should be noted that informational policies, consisting mostly of regulations, were the most preferred type of policy. This suggests that when it comes to, presumably, more coercive policies people do not make a distinction between regulations and market-based instruments. They do however make a distinction between market-based instruments and regulations that are relatively less coercive.
When looking at the overall acceptability of pull and push policies, they appear to be similarly acceptable. While the majority of research suggests that push measures are less acceptable than pull measures, there is some previous research showing that pull measures in general are only very slightly more preferred than push measures, while information policies garner a bit higher support (Huber and Wicki Reference Huber and Wicki2021). The small difference between push and pull measures may to an extent be due to the omission of price information. We omitted this information to ensure that differences between e.g. regulatory and market-based instruments were not methodologically created by highlighting costs for market-based instruments while omitting the actual cost of regulation to citizens. The results may indicate that previous research has exaggerated differences in acceptability by not systematically highlighting both costs and benefits of policies. However, the lack of difference between pull and push measures appears to be qualified by political ideology. Echoing some previous research (Hammar and Jagers Reference Hammar and Jagers2006; Kallbekken and Sælen Reference Kallbekken and Sælen2011; Harring and Jagers Reference Harring and Jagers2013), right-wing ideology turned out to be a negative predictor for all environmental policy categories, and especially important when predicting acceptability of push policies. Contrary to what may be expected, push measures do not appear to be the most negatively viewed policy type by the majority of respondents; people with a left-wing ideology actually seem to prefer such coercive measures over more voluntary policy instruments, and people with no clear left-to-right wing ideological preference do not clearly oppose them. Still, the opposite pattern (preference for pull measure or opting out push measure) is evident for people with a more right-wing ideology. This is in line with research showing that people with a right-wing ideology prefers pull measures over push measures, more so than left-wing voters (Harring et al. Reference Harring, Matti and Jagers2017). Both the private cost and governmental intervention may be less evident for pull and informational policies, compared to push measures, which may be the reason why people with a right-wing orientation generally are more supportive of them (Mettler Reference Mettler2011; Faricy and Ellis Reference Faricy and Ellis2014). Previous research has indicated that environmental values positively predict various policies, such as taxes, prohibitions, and informational policies, but not subsidies (Nilsson and Biel Reference Nilsson and Biel2008). Similarly, some have found that biospheric values predict support for taxes and regulations, but not voluntary policies (Rhodes et al. Reference Rhodes, Axsen and Jaccard2017). These findings may lend some insight as to why left-wing people are less supportive of pull measures than of push measures and why we see the reversed relationship for right-wing people. If support for pull policies is not a clear expression of proenvironmentalism, we may not expect left-wing people to be especially supportive, as left-wing people tend to have greater environmental concern than right-wing people (Harring and Jagers Reference Harring and Jagers2013). In contrast to some previous research (e.g. Rauwald and Moore Reference Rauwald and Moore2002; Rhodes et al. Reference Rhodes, Axsen and Jaccard2017; Larsson et al. Reference Larsson, Matti and Nässén2020), our results further show rather consistent effects of demographic variables. While they explain only a small portion of the variance, women, younger individuals, and people residing in more urban versus rural areas tend to be more supportive of all three categories of policies. This highlights the advantage of measuring policy support using either exhaustive scales or reduced scales based on exhaustive items.
As the policies included are implemented at different levels, and hence may affect certain individuals more than others, personal experience with specific policies could potentially affect acceptability ratings for some policies. For example, both personal experience with a specific policy as well as experience of environmental problems, such as climate change consequences, has been shown to increase support for policies (Lujala et al. Reference Lujala, Lein and Rød2015; Lerman and McCabe Reference Lerman and McCabe2017). On the other hand, personal experience may undermine policy support when individuals bear the costs of the policy (Lerman and McCabe Reference Lerman and McCabe2017).
However, given the size and general representativeness of our sample, it is reasonable to assume that we represent individuals who have experience with different policies. Secondly, the fact that we only included policies that specifically target individual consumers should minimise the risk that individuals are evaluating policies that they are completely unfamiliar with. Personal experience with the policy should therefore not systematically affect the results of the factor analysis, but may to an extent introduce noise. However, it is important to acknowledge that we do this in one country at a particular point in time. Hence, this study may not capture the dynamics of policy feedback and the fact that there is a constant revision of policies, which to some extent is guided by the public reception of policies (e.g. Mettler and Soss Reference Mettler and Soss2004; Busemeyer and Goerres Reference Busemeyer and Goerres2020).
An important next step for this line of research is to investigate the potentially separate drivers of acceptance towards these policy categories, taking into account that acceptance may be driven by different factors for different individuals. Although we adopt the terms push, pull, and informational policies, this should not be taken to mean that we assume that push policies are evaluated as some kind of punishment among the general public, or that pull policies are perceived as rewarding. Rather, we acknowledge that the characteristics of and driving mechanisms behind these policy categories have not been sufficiently researched. We continue the use of these category names because they are well established in the field already, but recognise that they could or should be relabeled as their motivational antecedents become clear. Although some research indicates that push policies may be perceived as restricting ones’ individual freedom to a greater extent than pull policies (Eriksson et al. Reference Eriksson, Garvill and Nordlund2006), more systematic research is needed here to discern whether perceptions like these are what actually define the categories and also whether they are similarly characterised by different groups of people, as such knowledge could help inform policy design. We believe that this categorisation of polices is well suited for continued research on determinants of acceptability. As the factor structure is based on citizen acceptability of environmental policy, the factor structure should reflect a summary of multiple evaluations of each category. As such, future research may use this categorisation to compare the relative importance of different determinants of acceptability.
Future research
While this study goes a long way in establishing an empirical taxonomy of environmental policies, there is still a great need to validate this factor structure in a range of contexts. Although it is beyond the scope of this study, this factor structure ought to be replicated with a confirmatory factor analysis with a fairly representative Swedish sample. Secondly, the extent to which this factor structure replicates in other countries ought to depend on the extent to which policies representing these categories exist in each country. If a country has a large share of policies not relating to either of these latent factors, such as emission trading, they may represent a separate construct altogether. Even though we see environmental policy diffusion and convergence, comparative research has found distinct environmental policy regimes in different countries (Duit Reference Duit2016). Conducting similar studies in different countries is important for several reasons. First of all, it should indeed be emphasised that this study was conducted in Sweden, a country that may be considered unique in certain environmental–political regards (that may potentially bias our results), including its’ long and ambitious history of environmental politics and a high number of operating policies in the field. A natural development from this research is thus to conduct similar projects in countries with less mature and comprehensive environmental political programs. Several country rankings conclude that the quality of Sweden’s political and administrative institutions is very high, signaling the need to conduct similar studies in countries where this quality is significantly lower. This is especially important since previous research has shown that factors such as the presence of corruption, lower level of transparency in the public sector, and weak adherence with the rule of law tend to affect the public opinion on environmental policy measures (Harring Reference Harring2014; Davidovic and Harring Reference Davidovic and Harring2020). Another path for future research would be to study whether this categorisation is applicable to other policy fields, such as, for example, health, or the regulation of other actors, such as industries or corporations. Another important issue concerns research on hypothetical policies. Hypothetical policies are often used to measure different categories such as pull/push policies (e.g. de Groot and Schuitema Reference de Groot and Schuitema2012). However, as the current categorisation between pull, push, and information policies is built on already implemented policies, there remains some uncertainty as to the extent that hypothetical policies are perceived to fit into either of our discovered categories. When hypothetical policies are used in research, the 12-item scale could additionally be measured to gauge, by for example correlation, which of these categories (if any) the hypothetical policy corresponds to.
Our results may further have implications for research on policy packaging. Recent research suggests that the specific policy instruments included in packages may not be as important for support as specific policy design features, and that policy packages containing both push and pull measures as well as a combination of regulatory and market-based measures can be acceptable (Wicki et al. Reference Wicki, Fesenfeld and Bernauer2019). Our results, on the other hand, suggest that people do not mainly evaluate specific design features, such as who the specific beneficiary of a tax deduction is, or which specific domain (e.g. energy, transport) a policy instrument is targeting. However, the descriptive means for individual policies within each factor category vary, suggesting that specific design features affect absolute acceptability ratings, but that these are not the main features that determine how such policies are viewed. Instead, our results suggest that combining a push and pull measure may be advantageous from a political implementation perspective. That is, packages combining push and pull measures may garner support both from the political left and right, echoing some previous research on policy packaging in Sweden (Eriksson et al. Reference Eriksson, Garvill and Nordlund2008). However, our survey was not designed to test the perceptions of policy packaging, and combined evaluations of push and pull measures thus need to be directly tested in future research.
The study may also have implications for policy framing. While efforts to frame policies by shifting the focus from environmental gains to other types of gains have proven unsuccessful (Bernauer and McGrath Reference Bernauer and McGrath2016), research on general pro-environmental attitudes and behaviors shows that framing undesired behavior as a loss is more effective than framing desired behavior as a gain (Homar and Cvelbar Reference Homar and Cvelbar2021), suggesting that push policies specifically may benefit from framing the undesired behavior as an action with associated losses. This is especially so given research linking loss aversion to a preference for status quo (Alesina and Passarelli Reference Alesina and Passarelli2019), and status quo preference as a fundamental aspect of political conservatism or right-wing ideology (Connover and Feldman Reference Connover and Feldman1981; Jost Reference Jost2003). Investigating the extent to which right-wing opposition to push policies is due to loss aversion, and if this could be ameliorated by framing undesirable behavior targeted by the push policy in terms of loss, could potentially be a fruitful endeavor. However, we argue that in order to have theoretically grounded ideas about which policies can be combined to increase feasibility, or which frames ought to increase acceptability, research first needs empirical evidence as to why certain categories of policies are or are not acceptable. For example, if the acceptability of policies is mainly based on the policy’s level of coerciveness, then combining instruments with high and low coerciveness may counteract the negative effect of one isolated instrument. This in turn requires that researchers can analyse determinants of acceptability in a valid manner, i.e. representing categories of policies in an exhaustive way that allows researchers to capture and compare multiple determinants of acceptability.
When conducting research on environmental policy attitudes, we urge researchers to employ an empirical taxonomy of policy, in order to sufficiently represent existing policies and consequently gain insight as to which categories of policies effects may be generalised to. In addition, it would be valuable to investigate which factors are driving laypeople’s evaluations of the different policy categorisations and if the findings in this study can be generalised to other countries.
Implications for policy-makers
This study shows that citizens in Sweden appear to perceive and evaluate environmental policies based on three distinct categories; push policies, pull policies, and information policies. The study also corroborates previous research regarding the importance of ideology in explaining acceptability. Right-wing ideology was a negative predictor for all environmental policy categories, and especially important when predicting the acceptability of push policies. When crafting persuasive messages in order to implement new policies, policymakers need to take into account that people seem to systematically make a distinction between the three policy types. With regards to comparisons of acceptability levels across the three types, we find surprisingly small differences between overall acceptability for pull and push, while information policies were most popular among the respondents. However, ideology was found to be especially important when predicting the acceptability of push policies, possibly suggesting an interaction effect between policy type and ideology. In fact, people with a right-wing ideology seem to opt out environmental push policy, people with neither left nor right-wing ideology seem to have no clear policy preference, and people with a left-wing ideology seem indeed to opt in environmental push policy. Therefore, it would be particularly important to take into account right-wing ideology when it comes to framing push messages. Widespread resistance to environmental push policies is not inevitable as it seems.
Conclusion
Contrary to former more theoretical applications in the behavioral and social sciences, this research, based on a fairly representative sample of Swedes, shows that citizens perceive and evaluate environmental policies based on three distinct categories; push policies, pull policies, and information policies. Importantly, push policies consists of both regulations and financial disincentives, while pull measures consist mostly of financial incentives, and informational policies mostly of regulations. Thus, current categorisations based only on administrative design or only on the rewarding or punishing mechanism behind policies do not adequately capture how laypeople perceive environmental policies. Although it should be acknowledged that the study is made in one country at a particular point in time, the essential implication for policy makers when crafting persuasive messages in order to implement new policies is to take into account that people seem to systematically make a distinction between the three policy categories. For research on environmental policy attitudes, employing an empirical taxonomy of policies in order to sufficiently represent existing policies could generate important insights as to which categories of policies effects may be generalised to.
Supplementary material
For supplementary material accompanying this paper visit https://doi.org/10.1017/S0143814X21000271
Data availability statement
Replication materials for study are not publicly available due to GDPR restrictions but are available from the corresponding author on reasonable request.
Funding
This research was funded by the Swedish Research Council, under Grant: 2016–03058, and supported by the Centre for Collective Action Research (CeCAR) at the University of Gothenburg.
Competing interest
The authors declare none.


 Open access