


Introduction
Cyanobacteria are common microorganisms found in the snow and ice of glaciers (Reference Wood, Rueckert, Cowan and CaryPorazinska and others, 2004; Reference Takeuchi and LiTakeuchi and Li, 2008; Reference Uetake, Naganuma, Hebsgaard, Kanda and KohshimaUetake and others, 2010). In glacier ecosystems, cyanobacteria play a role as primary producers that support heterotrophic organisms. They usually form dark-colored spherical aggregates (cryoconite granules) with protozoa, metazoans, heterotrophic bacteria that are specifically adapted to snow and ice environments, and mineral particles from the glacier surface (Reference TakeuchiTakeuchi, 2001; Reference Takeuchi, Kohshima, Goto-Azuma and KoernerTakeuchi and others, 2001a,Reference Takeuchi, Kohshima and Sekob; Reference Polz and CavanaughChristner and others, 2003). These microbes and their products reportedly reduce the surface albedo and accelerate the melting of snow and ice (Reference Takeuchi, Kohshima and SekoKohshima and others, 1993; Reference Thomas and DuvalThomas and Duval, 1995; Reference Segawa, Miyamoto, Ushida, Agata, Okada and KohshimaHoham and Duval, 2001; Reference Takeuchi, Kohshima, Goto-Azuma and KoernerTakeuchi and others, 2001a, Reference Takeuchi, Dial, Kohshima, Segawa and Uetake2006). The effect of the biogenic impurities on melting of snow and ice is particularly significant on Asian glaciers (Reference Takeuchi, Matsuda, Sakai and FujitaTakeuchi and others, 2005). Recently cyanobacteria from the past have been retrieved from ice cores taken from glaciers at lower latitudes and these have been used as environmental markers for studies of past environment (Reference UetakeUetake and others, 2006; Reference Takeuchi, Fujita, Nakazawa, Nakawo and RanaTakeuchi and others, 2009).
Although the biodiversity and ecology of snow algae and bacteria have received some attention (Reference TakeuchiTakeuchi, 2001; Reference Segawa, Miyamoto, Ushida, Agata, Okada and KohshimaSegawa and others, 2005, Reference Segawa, Takeuchi, Ushida, Kanda and Kohshima2010), little information is available regarding the ecology of cyanobacteria from glaciers and their molecular analysis. Previous studies have indicated the presence of cyanobacterial communities in Arctic and Antarctic lakes by morphological and molecular methods (e.g. Reference Taton, Grubisic, Brambilla, de Wit and WilmotteTaton and others, 2003; Reference Takeuchi and KohshimaJungblut and others, 2005; Reference Porazinska, Fountain, Nylen, Tranter, Virginia and WallComte and others, 2007), with reported distribution of cosmopolitan and endemic taxa and cyanobacterial ecotypes in the cold terrestrial biosphere of the polar regions. Reference QiuElster and others (2007) reported the morphology of cyanobacteria in alpine snow samples, but did not carry out molecular or taxonomic analysis. Reference Xiang, Shang, Chen, Jing and YaoXiang and others (2009) studied bacterial communities via the 16S rRNA gene, but did not discuss cyanobacterial community and taxonomic analysis on the glaciers.
Automated rRNA intergenic spacer analysis (ARISA) has been developed (Reference Ruiz Sebastián and O’RyanFisher and Triplett, 1999) and used to analyze the length heterogeneity of the intergenic transcribed spacer (ITS) region between the 16S and 23S ribosomal genes (Reference TakeuchiJones and others, 2007). However, these methods only analyzed fragments of the ITS region; therefore, they were not applicable for comparing sequences or for discussing the distribution of ecotypes and a higher level of resolution analysis. In order to understand the cyanobacteria in glacier ecosystems and their distribution, it is important to analyze them using the 16S rRNA gene and ITS regions.
In this study, we investigated the cyanobacteria present on Qiyi glacier, China, and analyzed community structure and diversity on the glacier using 16S rRNA sequences and an ITS library. We also linked the microscopic screening with polymerase chain reactions on single filaments from glacial samples.
Materials and Methods
Glacier samples
Samples were collected from Qiyi glacier (398140 N, 978450 E), Qilian Shan, China, in September 2002. The Qilian Shan are located along the northeast margin of the Tibetan Plateau and extend from east to west for a distance of ∼500km along the border between Gansu and Qinhai Provinces (Fig. 1). The glacier flows south to north from a mountain peak of 5159 m a.s.l. down to its terminus at 4305 ma.s.l. (Fig. 1). Most of the surface of the glacier is bare ice or snow devoid of rock or stone debris. The glacier is ∼3 km in length and ∼3.04 km2 in area. The snowline during our study period (early September) was ∼4900 m a.s.l.
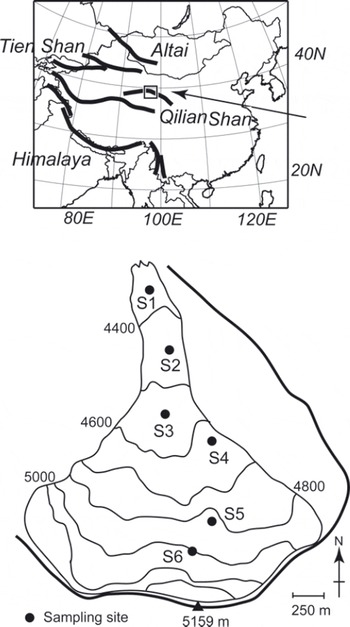
Fig. 1. Location and map of Qiyi glacier, Qilian Shan, China.
To quantify the algal biovolume on the glacial surface, ice/snow from the surface layer (approximately 5 cm × 5 cm in area and 1–3 cm in depth, ∼50–100mL in water volume) was collected with a stainless-steel scoop at five sites in the bare ice area (S1-S5) and one site in the snow area (S6). Five samples were collected from randomly selected surfaces at each study site. The collected area on the surface was measured to calculate the amount of algal biovolume per unit area. The collected samples were melted and then immediately preserved as a 3% formalin solution in clean 100 mL polyethylene bottles. These formalin samples were used for counting cell concentration. Although the fine structure of the algae might be lost by formalin, they could still be counted under a microscope. For DNA analysis, we collected other samples of surface snow and ice at the sites using a sterilized stainless-steel scoop. The samples were stored in 5 mL sterile plastic conical tubes (Assist, Tokyo, Japan) and kept frozen during transportation to the Tokyo Institute of Technology, Japan.
Microscopy
The cyanobacterial biovolume (biomass) of each site was quantified by microscopy. The biovolume was represented by the cell volume per unit area. Cell counts and estimations of cell volume were conducted using a fluorescence microscope (E600; Nikon, Tokyo, Japan). The samples were subjected to sonication for 5min to loosen sedimentary particles. A 50–1000 μL volume of the sample water was filtered through a hydrophilized 0.4μm membrane filter (JHWP01300; Millipore, Billerica, MA, USA) and the number of fluorescent cells on the filter was counted (one to three lines on the filter). Filamentous cyanobacteria were counted every 50 μm as a unit. The count was conducted three to six times for each sample. At least 400 cells were counted for every morphospecies. From the mean results and filtered sample water, the cell concentration (cells mL−1) of the sample was obtained. Mean cell volume was estimated by measuring the size of 50–100 cells from each species. Total cyanobacterial biovolume was estimated by adding up the values obtained from multiplying cell concentrations by mean cell volume. These calculations were done for each species at each site. To obtain the spatial biovolume at each site, the total biovolume was represented as the cell volume per unit area of glacier surface (mm3 m−2). Community structure was represented by the mean proportion of each species in five samples with respect to the total cyanobacterial volume at each sampling point.
DNA extraction, polymerase chain reaction (PCR) and sequencing
All manipulations were conducted within a class 100 clean bench (model MCV-131BNS; Sanyo, Osaka, Japan). Qiyi glacial samples from S1–S6 were melted and a portion (1–2 mL) of each was centrifuged at 22000g for 15 min to obtain pellets; five samples from S1–S5 were mixed for each sampling site. The pellets were then transferred into separate 2.0 mL Matrix-E tubes (Qbiogene, Carlsbad, CA, USA) and subjected to DNA extraction using a FastDNA spin kit for soil (Qbiogene) and a FastPrep FP120 instrument (Qbiogene). The number of PCR cycles was kept to a minimum to reduce PCR-dependent biases in amplification that could destroy the original composition of the bacterial DNA in the samples, and to reduce errors caused by the formation of chimeras resulting from nucleotide misincorporation (Reference Wilson and BlitchingtonWilson and Blitchington, 1996; Reference Wilson and BlitchingtonPolz and Cavanaugh, 1998; Reference Yoshimura, Kohshima and OhtaniQiu and others, 2001). A portion (4 μL) of each DNA sample was subjected to PCR amplification for the 16S rRNA to 23S rRNA internal transcribed spacer (rRNA-ITS) regions using a high-fidelity PrimeStar polymerase (Takara, Otsu, Japan) according to the manufacturer’s instructions. Primers 371 F (Reference UetakeNubel and others, 1997) and 23SULR (Reference TatonNeilan and others, 1997; Reference Segawa, Takeuchi, Ushida, Kanda and KohshimaIteman and others, 2000) were used to amplify regions from the 16S rRNA-ITS region under the following conditions: 3 min initial denaturation at 94°C; 98°C for 10s, 57°C for 15 s and 72°C for 4 min (12 cycles for S1–S5 and 20 cycles for S6); final extension at 72°C for 7min. PCR products were then purified using a MinElute PCR Purification Kit (Qiagen, Hilden, Germany) and cloned into pCR4Blunt-TOPO with a Zero Blunt TOPO PCR Cloning Kit for Sequencing (Invitrogen, Carlsbad, CA, USA). Escherichia coli DH5a (Takara) was transformed with the cloning vector. The insertion of the correct sequence was verified by colony PCR amplification using the universal primers M13F and M13R, targeting both sides of the cloning vector under the following conditions: 3 min initial denaturation at 94°C; 30 cycles of 94°C for 30 s, 55°C for 30 s and 72°C for 4 min; final extension at 72°C for 7min. For this analysis we sequenced about 40 clones at each site (205 clones in total). Sequencing of the inserted DNA fragments was achieved using Big Dye Terminator v3.1 and an ABI automatic sequence analyzer (model 3100; Applied Biosystems, Foster City, CA, USA) with the universal primers M13F, M13R and 907F (Reference Takeuchi, Matsuda, Sakai and FujitaLane and others, 1985).
Single-filament analysis
Glacier samples (S2 and S5) were kept on ice and sonicated once for 60 s (Bioruptor; Cosmo Bio, Tokyo, Japan) to detach bacteria and dissolve DNA attached to cyanobacteria. For cyanobacteria that were classified into three different morphotypes by microscopic analysis, a single-cell sequencing method was used (Reference Ruiz Sebastián and O’RyanRuiz Sebastian and O’Ryan, 2001; Reference Taton, Grubisic, Brambilla, de Wit and WilmotteMuramoto and others, 2008). Ten filaments from each morphotype were analyzed by single-filament PCR. Single cyanobacterial filaments were isolated using a CKX41 microscope (Olympus, Tokyo, Japan) and micromanipulator systems (Narishige, Tokyo, Japan), transferred into 0.2 mL PCR tubes (Eppendorf, Germany) and washed twice with sterilized distilled water. Tubes containing cyanobacterial filaments were subjected to two consecutive freeze-thaw cycles to lyse the filaments, then subjected to PCR amplification of the 16S rRNA-ITS region using a Multiplex PCR Assay (Takara) according to the manufacturer’s instructions. Primers 371F and 23SULR were used to amplify regions from the 16S rRNA-ITS region under the following conditions: 1 min initial denaturation at 94°C; 45 cycles of 94°C for 30 s, 52°C for 90s and 72°C for 3 min 30 s; final extension at 72°C for 10 min. We obtained sequences from three filaments on Oscillatoriaceae cyanobacterium L in glacial samples and these sequences were identical.
Sequencing and phylogenetic analysis
Chimeric sequences were identified using a chimera check with the Bellerophon (version 3) function on the Greengenes web server (Reference PruesseDeSantis and others, 2006). Homology-based searches of 16S rRNA gene sequences in the DDBJ, EMBL and GenBank databases were performed using the BLAST program available from the NCBI website. The 16S rRNA gene sequences were imported into the Silva ARB database (version 102; http://www.arb-silva.de/) (Reference Xiang, Shang, Chen, Jing and YaoPruesse and others, 2007) within the ARB software package (Reference Tamura, Dudley, Nei and KumarLudwig and others, 2004) and the alignment was corrected manually. The obtained libraries were then analyzed using the Mothur program (http://www.mothur.org/wiki/Main_ Page) by comparing operational taxonomic units (OTUs) on the basis of 99% similarity between 16S rRNA gene sequences and both 97% and 99% similarity between ITS gene sequences as determined using the furthest neighbor algorithm in Mothur. The sequence similarity of different small subunit (SSU) rRNA gene copies in the same genome is rarely <99% (Reference Nubel, Garcia-Pichel and MuyzerAcinas and others, 2004). A representative sequence was chosen from each OTU by a majority decision. Mothur data were used to calculate a Simpson’s diversity index (D) and a Chao 1 richness estimate (Reference PeiChao, 1984). To estimate the environmental source of these cyanobacteria from the records in the database, the obtained 16S rRNA gene sequences were compared with those in the databases, and those displaying >97% similarity were identified as corresponding species. We selected the highest match sequences (including descriptions of uncultured bacteria) and the highest cultured match sequences, these alignments were exported from ARB, and the neighbor-joining method tree was used to construct a tree with MEGA software (version 4) (Reference Tamura, Dudley, Nei and KumarTamura and others, 2007). Bacterial communities from the different sampling sites were compared using UniFrac (Reference Takeuchi, Dial, Kohshima, Segawa and UetakeLozupone and Knight, 2005; Reference Takeuchi, Fujita, Nakazawa, Nakawo and RanaLozupone and others, 2006). A UniFrac significance test was performed for all samples.
Nucleotide sequence accession numbers
We initially clustered the 16S-ITS OTUs at the 99% nucleotide identity level based only on the OTU 16S rRNA gene sequence content. We then sub-clustered within the OTUs at 97% sequence identity based only on the ITS content (accession Nos. AB569623-AB569632). In the Qiyi-cya-OTU 1, we found three sub-clusters (Qiyi-cya-OTU 1A, 1B and 1C), but we found none in the other OTUs. A representative sequence was chosen from each OTU by a majority decision.
Results
Morphological classification and biovolume of glacial cyanobacteria
Various cyanobacteria were observed in all samples collected from the glacier. Microscopy revealed that at least one coccoid and two filamentous cyanobacteria were on this glacier. These were identified as Chroococcales cyanobacterium (Chro.), Oscillatoriaceae cyanobacterium L (Osci. L) and Oscillatoriaceae cyanobacterium S (Osci. S) (Fig. 2). Chro. was 3.6±0.61 μm in diameter, Osci. L had a cell diameter of 3.9 ± 1.0 μm (mean ±SD) with a sheath and Osci. S was 1.9 ±0.18 p.m in cell diameter without a sheath. Snow algae (chlorophytes), which were common on the ice surface of other Asian glaciers (Reference Yoshimura, Kohshima and OhtaniYoshimura and others, 1997), were not observed on this glacier.

Fig. 2. Photomicrographs of cyanobacteria observed on Qiyi glacier: (a) Oscillatoriaceae cyanobacterium L (Osci. L); (b) Oscillatoriaceae cyanobacterium S (Osci. S); (c) Chroococcales cyanobacterium (Chro.). Photomicrographs shown in (a) and (b) were taken with a phase-contrast microscope, and that shown in (c) was observed using a fluorescent microscope (red: algal pigment autofluorescence). Scale bars are 10 μm for all pictures.
The total cell biovolume of the cyanobacteria ranged from 2 to 2350 mm3 m−2 (Fig. 3). The total biovolumes at sites S2, S3, S4 and S5 were not significantly different, but the biovolumes at sites S1 and S6 were smaller than at the other sites. The community structure showed that Osci. S and Chro. were distributed among all of the study sites and Osci. L was distributed in all sites except S6. Osci. S was the most dominant and accounted for 57–89% of the total biovolume in sites S2-S6. Chro. was most dominant in the lowest site, S1 (46%), and Osci. L was the next most dominant (14–39%) at sites S2-S5.

Fig. 3. (a) Total cyanobacterial biomass of snow algae on Qiyi glacier. (b) Percentage of each cyanobacterial species in the total cyanobacterial cell volume.
Cyanobacterial phylotypes of 16S rRNA gene analysis
Low-cycle PCR amplification of the 16S rRNA-ITS gene followed by cloning and DNA sequencing revealed that the samples from the six sites contained a total of eight OTUs (Qiyi-cya-OTU 0–7) with a sequence similarity of 99% based on the 16S rRNA gene (205 clones in total). The 16S rRNA gene clone libraries were composed of organisms belonging to the Oscillatoriales (six OTUs, 9 1% of the clone library), Chroococcales (one OTU, 8.3%) and unclassified (one OTU, 0.5%). A number of detected OTUs based on the 16S rRNA gene were different among the study sites. From identification based on the 16S rRNA gene, four OTUs were detected at sites S1 and S2, six OTUs at sites S3 and S4, three OTUs at site S5, and four OTUs at site S6. Of the eight OTUs identified in the samples, two were detected in only one clone (singlet) that included organisms belonging to Oscillatoriales and unclassified, respectively.
Six of the eight OTUs identified based on the 16S rRNA gene were found within the order Oscillatoriales (Fig. 4; Table 1). Four of these were similar to cultured representatives. Qiyi-cya-OTU 0 was up to 99% similar to Phormidium cf. amoenum I-Sab (EU196643), Phormidium cf. amoenum BW-0 (EU196635) and Microcoleus vaginatus SRS1-KK2 (EF654078), Qiyi-cya-OTU 6 was 99% similar to Phormidium pristleyi ANT.GENTNER2.4 (AY493580), Qiyi-cya-OTU 2 was 98% similar to Geitlerinema carotinosum AICB 37 (AY423710) and Qiyi-cya-OTU 7 was 98% similar to Limnothrix redekei CCAP 1443/1 (AJ580007). The novel phylotype, Qiyi-cya-OTU 1 , had the highest similarity of 94% to Leptolyngbya frigida ANT.LH53B.2 (AY493576). Qiyi-cya-OTU 4 had the highest similarity of 93% to Phormidium pristleyi ANT.LH61.2 (AY493582). The remaining two OTUs (Qiyi-cya-OTUs 3 and 5) were found within the orders Chroococcales and unclassified, respectively. Qiyi-cya-OTU 3 had highest similarity (97%) to the cultured sequence of the Chroococcales Chamaesiphon subglobosus PCC 7430 (AY170472), while Qiyi-cya-OTU 5 was 94% similar to the Chroococcidiopsis sp. CC1 (DQ914863). This OTU may have originated from a novel species due to its lower similarity.

Fig. 4. Phylogenetic analysis of SSU rRNA sequences amplified from DNA in the glacial samples. Bootstrap values generated from 1000 replicates using the neighbor-joining method are shown at the nodes. Bootstrap values >60% are shown above.
Table 1. The list of cyanobacterial species detected in Qiyi glacier samples

The proportion of clones in the clone library was obtained as an index of the dominance of a phylotype. The cyanobacterial community structure on the glacier contained a different distribution of 16S rRNA phylotypes, with a distinction between the snow and bare-ice surfaces on the glacier. The phylogenetic compositions of the communities from six sampling sites differed significantly from one another, except between S1 and S3, and S1 and S5 (UniFrac significance of pairwise comparisons, P < 0.001). Qiyi-cya-OTU 0 was abundant on the middle to lower area, Qiyi-cya-OTU 1 on the middle portion, and Qiyi-cya-OTU 3 on the upper section of the glacier (Fig. 5). Qiyi-cya-OTU 0 was also abundant at S5 on the middle to upper part of the glacier.

Fig. 5. Percentage abundance of OTUs in the cyanobacterial communities at S1–S6 on Qiyi glacier.
Cyanobacterial phylotypes of ITS gene analysis
PCR amplification of the 16S rRNA-ITS gene followed by cloning and DNA sequencing revealed that the samples from the six sites contained a total of 12 and 38 OTUs (Qiyi-cya-OTU 0–7) with a sequence similarity of 97% and 99% based on the ITS gene (205 clones in total), respectively. In eight OTUs with a sequence similarity of 99% based on the 16S rRNA gene, we found three sub-clusters (Qiyi-cya-OTU 1A, 1B and 1C) in the Qiyi-cya-OTU 1 , but we found no sub-clusters in the other seven OTUs at 97% sequence identity based only on their ITS content. There are more OTUs with the ITS than with the 16S rRNA gene in the Qiyi-cya-OTU 1 , suggesting that the ITS region had a higher level of diversity than the 16S rRNA gene in this OTU.
The ITS region sequences of Qiyi-cya-OTUs 4 and 5 were found to be closely related to sequences in the DNA database (>95.0% similarity). Qiyi-cya-OTU 4 was 98–99% similar to uncultured Antarctic cyanobacterium clone N184-6 (EU032393), and Qiyi-cya-OTU 5 was 95% similar to uncultured Antarctic cyanobacterium clone N184-4 (EU032391).
Single-filament PCR analysis
The 16S rRNA-ITS gene sequences from single filaments of Osci. L which had a cell diameter of 3.9±1.0| μm (mean±SD) with a sheath were amplified from samples at sites S2 and S5. However, Osci. S and Chro. 16S rRNA-ITS sequences were not amplified by single-filament PCR. The 16S rRNA-ITS sequences from Osci. L were 100% similar to Qiyi-cya-OTU 0 and therefore consistent with cloning analysis from the extracted DNA of glacier samples (Fig. 4).
Cyanobacterial diversity estimators in 16S rRNA gene clone library
The non-parametric abundance estimator, Chao 1, was used to predict total richness at each site (Table 2). The coverage of the clone libraries was 75–100% of the number of OTUs estimated by the Chao 1 analysis based on the 16S rRNA gene. The result indicates that the samplings for the clone libraries were sufficient to cover most of the cyanobacterial diversity at each site. The number of OTUs based on the 16S rRNA gene detected in the samples was highest at S3 and S4 (six OTUs), and the reciprocal of Simpson’s index was also highest at S3 on the middle part of the glacier.
Table 2. Richness, diversity estimates and clone library coverage for 16S rRNA gene clone library
Discussion
Cyanobacterial community based on microscopy and molecular analysis
The clone libraries were composed of organisms belonging to the Oscillatoriales (six OTUs), Chroococcales (one OTU) and unclassified (one OTU), suggesting that the cyanobacteria in these groups, especially the Oscillatoriales, were dominant members of the cyanobacterial community on the glacier. The five OTUs Qiyi-cya-OTU 0–4 were detected in more than ten clones of the clone library, suggesting that they are probably the major biota on the glacier surface. In particular, Qiyi-cya-OTU 0 constituted 56% of the total clone library and Qiyi-cya-OTU 1 constituted 2 1% of the total clone library, suggesting that these two OTUs are the major members of the glacier biota. The three OTUs Qiyi-cya-OTU 5–7 were detected in only a few clones (1–3) of the clone library, but they are probably not the major biota on the glacier.
Although three morphological types of cyanobacteria (Osci. L, Osci. S and Chro.) were identified by microscopy, molecular data demonstrated eight OTUs in the samples from this glacier. The inconsistency is probably due to difficulties in morphological identification and scarcity in the samples and/or a large genotypic diversity.
Qiyi-cya-OTU 0 of the 16S rRNA gene was 100% similar to the sequence of Osci. L by single-filament PCR, indicating that Qiyi-cya-OTU 0 corresponds to the morphological taxa of the Osci. L. The morphological estimation based on the matched 16S rRNA gene sequences with OTUs also showed that Qiyi-cya-OTU 0 was closest to Osci. L (Reference TatonTaton and others, 2006; http://www.cyanodb.cz).
The other filamentous cyanobacteria OTUs (Oscillatoriales) were probably recognized as Osci. S by microscopy. It would appear that it is difficult to separate these as different taxa based on microscopic analysis.
Qiyi-cya-OTU 3 was 97% similar to the coccoid Chamaesiphon subglobosus PCC 7430 (AY170472), which included organisms belonging to the Chroococcales. Chro. sequences were not amplified by single-filament PCR; however, this OTU was the only cocci type in the clone library, suggesting that Qiyi-cya-OTU 3 could correspond to the morphological taxa of Chro.
Cloning analysis showed that Qiyi-cya-OTU 0 (Osci. L) was most abundant in the clone library, whereas morphological analysis showed that the cell biovolume of Osci. S was the highest of the three taxa observed, indicating that the proportion of cell biovolume is not consistent with abundance in the clone library. Genome sequences of cynaobacteria contained 1–4 copies of 16S rRNA genes (average 2.31) (Reference Uetake, Naganuma, Hebsgaard, Kanda and KohshimaPei and others, 2010). Osci. L may have a high copy number of the SSU rRNA gene, possibly affecting its abundance in the clone library and also possibly causing some bias in the molecular techniques employed. We linked the microscopic screening with single-filament PCR on Osci. L in glacial samples, but two of the three morphological taxa were not amplified successfully by single-filament PCR. The glacier samples were sonicated to dislodge bacteria and dissolve DNA attached to the cyanobacterial cell wall, then subjected to single-filament PCR; however, sonication may have had an impact on DNA fragmentation. Otherwise the reasons for the lack of success in amplification from single-filament PCR are thought to be lysis of cyanobacterial cells and the small quantity of starting material for the PCR reaction.
Spatial variation in cyanobacterial community on the glacier
The spatial variation in the cyanobacterial community on the glacier may reflect physical or chemical conditions affecting the growth of each cyanobacterial OTU. Altitudinal changes in the snow algal community have been reported on glaciers in the Himalaya, Alaska and Patagonia (Reference Yoshimura, Kohshima and OhtaniYoshimura and others, 1997; Reference Takeuchi and KohshimaTakeuchi and Kohshima, 2004). Bacterial communities also changed with altitude on Alaskan glaciers (Reference Segawa, Miyamoto, Ushida, Agata, Okada and KohshimaSegawa and others, 2010). Reference Yoshimura, Kohshima and OhtaniYoshimura and others (1997) suggested that snow algae can be categorized into four types (ice environment specialist, snow environment specialist, generalist and opportunist) based on the distribution of snow algae on glaciers.
Although the cyanobacterial community based on morphological types displayed no significant difference between the study sites on the glacier, the phylogenetic composition based on the 16S rRNA gene of the communities differed significantly using pairwise comparisons. Qiyi-cya-OTU 0 was abundant on the middle to lower area, Qiyi-cya-OTUs 1 and 2 on the middle area, and Qiyi-cya-OTU 3 on the upper part of the glacier. The cyanobacterial community on the glacier did not show clear altitudinal variations such as seen in the previous Himalayan study (Reference Yoshimura, Kohshima and OhtaniYoshimura and others, 1997), suggesting that variation in the surface conditions for cyanobacterial growth was not significant on this glacier.
Isolation source environments on the glacier
The sources or favorable habitats for each cyanobacteria OTU could be determined based on the records in the database. All OTU sequences were found to be closely related to sequences of already detected microorganisms in the DNA database, with 353 sequences >97% similar to those in the database. Table 3 outlines the source environments of the cyanobacterial sequences of each OTU on the glacier in the database records. The OTUs detected in this study belonged to a broad range of cyanobacteria from different habitats such as soils, fresh water, ice and wetlands. We classified the possible source environments as soil (39.9%), fresh water (38.2%), snow and ice (1.7%), wetland (5.4%) and other (6.8%). Approximately 8% of the sequences contained no information about the source environment. Qiyi-cya-OTU 2 was found to be closely related to cyanobacteria recorded only from freshwater environments. The sequences of the remaining seven OTUs were recorded from various environments. The sequences recorded from fresh water were included in the record of all eight OTUs, and the sequences recorded from soil, snow and ice, and wetland environments were included in the records of six, four and three OTUs, respectively. Qiyi-cya-OTU 0, which was the most abundant in the clone library, was found mainly in soil environments. Qiyi-cya-OTUs 1, 3 and 4, which were detected in more than ten clones in the clone library, were also recorded from soils and freshwater environments. These results suggest that the cyanobacterial communities on the glacier are unlikely to be specialized members of the snow and ice biota.
Table 3. List of the total cyanobacterial sequences in the 16S rDNA database matched to those on Qiyi glacier. The table shows hit numbers. Percentages of individual numbers per total hit numbers are shown in parentheses

The major OTUs identified in this study (Qiyi-cya-OTUs 0, 1, 3, 4, 5 and 6) were highly similar to the sequences (97–99%) reported from soil samples of an area near a glacier in the Peruvian Andes (Reference Thomas and DuvalNemergut and others, 2007). They reported that β-proteobacteria and cyanobacteria were abundant in the soil samples and the majority of sequences were related to Chroococcales and Oscillatoriales in soil samples that were at the glacial forefront. This main source of cyanobacteria on the glacier is consistent with the study on an Arctic glacier by Reference Takeuchi, Kohshima, Goto-Azuma and KoernerKaštovská and others (2005). They analyzed the microbial community in glacial cryoconites, non-vegetated soils and plant-cover soils in Svalbard. They suggested that most of the cyanobacteria observed in cryoconites on the glacier were also found from soil samples.
Geographical records show that all of the OTUs were recorded from various regions of the world. The isolation sources of the sequences matched with the OTUs include Antarctica (11.3%), the Arctic (5.1%), Asia (0.8%), North America (20.7%), South America (21.5%), Europe (25.8%) and other regions (2.0%) (Table 3). Approximately 13% of the sequences had no information regarding the isolation source. All eight OTUs included the sequences of cyanobacteria recorded from Antarctica. The percentage of cyanobacteria recorded from Asia was only 0.8% in the clone library (Qiyi-cya-OTU 0). The result suggests that there is no Asian endemic cyanobacterium on this glacier and that all of the cyanobacterial phylotypes found on the glacier are common in the cold regions of the world. According to Reference Takeuchi and LiJungblut and others (2010), >68% of cyanobacterial ribotypes that were detected from lake, stream and ice-shelf communities of the Canadian High Arctic matched with those of perennially cold terrestrial ecosystems. Therefore, low-temperature cyanobacteria are unlikely to be endemic to certain environments, but could disperse throughout the cold terrestrial biosphere.
The number of cyanobacterial OTUs on the glacier was generally smaller than the number reported from other environments. The 16S rRNA gene sequences revealed a total of eight cyanobacterial OTUs on the glacier. Reference Thomas and DuvalNemergut and others (2007) reported two cyanobacterial OTUs at a distance of 0 m and eight and 14 cyanobacterial OTUs at 100 m from the glacial forefront. However, rarefaction analysis revealed that clone numbers were under-sampled and therefore these OTUs are thought to be underestimated, values. Reference Takeuchi and LiJungblut and others (2010) detected five and 7–14 OTUs from ice-shelf and lake samples, with the ice sample having the lowest OTU numbers among them. These previous studies classified the OTUs as groups of sequences 97.0–97.5% similar to 16S rRNA gene sequences. In our study we classified eight OTUs in total with 99.0% similarity and seven OTUs in total with 97.0% similarity, respectively. This suggests that cyanobacterial diversity on the glacier was lower than in the lake samples.
From the ITS analysis, Qiyi-cya-OTUs 4 and 5 were closely related to sequences in the DNA database (>95.0% similarity). Qiyi-cya-OTU 4 was 98–99% similar to uncultured Antarctic cyanobacterium clone N184-6 (EU032393), and Qiyi-cya-OTU 4 was 95% similar to uncultured Antarctic cyanobacterium clone N184-4 (EU032391), that detected from Antarctic soils (Reference Wood, Rueckert, Cowan and CaryWood and others, 2008), so this phylotype could be classified as a cosmopolitan type. Owing to the lack of ITS gene data in the database, information on the sequences detected on the glacier is limited at present.
Acknowledgements
We thank Y. Tangdong of the Cold and Arid Regions Environmental and Engineering Research Institute of the Chinese Academy of Sciences in Lanzhou, China, for his logistical support of this expedition. This study was supported by a grant from the Transdisciplinary Research Integration Center (TRIC), the Research Organization of Information and Systems and a Grant-in-Aid for Young Scientists (20710019) from the Ministry of Education, Culture, Sports, Science and Technology, Japan. This study was also a part of the Oasis Project funded by the Research Institute for Humanity and Nature and was supported by a Grant-in-Aid for Young Scientists (A, No. 21681003) from the Japan Society for the Promotion of Science (JSPS).


