


INTRODUCTION
This paper describes the epidemiological, environmental, microbiological, and spatial aspects of a Legionnaires' disease (LD) outbreak that occurred in Christchurch, New Zealand in 2005. Christchurch, located halfway down the east coast of the South Island is New Zealand's second largest city with a population in 2005 of 356 100 [1].
LD, an acute atypical pneumonia [Reference Nguyen2] named after the 1976 outbreak at the American Legion convention in Philadelphia [Reference Stout and Yu3], is caused by the bacterium Legionella which occurs naturally in both soil and water. It is non-communicable [Reference Graham4] and in most cases respiratory infection is attributed to the inhalation of aerosols containing Legionella pneumophila [Reference Nguyen2, Reference Joseph5]. Identified sources for such aerosols include showers, spa pools, water fountains [Reference Diederen6], vegetable misters in supermarkets, dental unit waterlines [Reference Singh and Coogen7] and nebulizers [Reference Mastro8]. Internationally it has been reported that aerosols are typically produced by evaporative systems such as water cooling towers and air conditioning that are considered the commonest infection sources for most types of Legionella spp. [Reference Nguyen2, Reference Stout and Yu3, Reference Joseph5, Reference Regan and Olowokure9]. However in New Zealand L. longbeachae infections contribute significantly to the number of sporadic cases annually and have been associated with a number of outbreaks [Reference Graham4].
LD is characterized by a short incubation period typically in the order of 2–10 days, but usually 5–6 days [Reference Joseph5], although in one outbreak in 1999, 16% of cases occurred up to 19 days later [Reference Den Boer10]. Risk factors for the disease include advanced age (>65 years), male sex, smoking, chronic lung disease and immunosuppression [Reference Stout and Yu3].
LD has an important impact on population health accounting for 2–15% of community-acquired pneumonia hospitalizations per year [Reference Stout and Yu3, Reference Holst11]. The United Kingdom Health Protection Agency estimate a 10–15% case-fatality risk [Reference Joseph5] whereas the United States Centers for Disease Control and Prevention estimates 5–30% [Reference Marston, Lipman and Breiman12], rising to 80% for the most at-risk groups [Reference Diederen6]. The high case fatality and apparent abundance of reservoirs ensures that LD clusters generate considerable public health concern, requiring a rapid public health response to identify the source and deploy intervention measures to control the outbreak and prevent further cases.
In New Zealand all health professionals and laboratories (since 2007) are required to notify the local Medical Officer of Health of any suspected cases of LD. Notification data are collated by the Institute of Environmental Science and Research Ltd (ESR) who operate the national notifiable disease surveillance database (EpiSurv), under contract to the Ministry of Health [Reference Graham4].
The first case of LD in New Zealand was reported in 1979 [Reference Holst11, Reference Mitchell, Chereshsky and Haskell13] and the disease became notifiable in 1980 [Reference Graham4]. The first common-source outbreak, with 10 laboratory-confirmed cases, occurred in Christchurch in 1990 [Reference Mitchell, Chereshsky and Haskell13]. The largest New Zealand outbreak to date also occurred in Christchurch, between 4 April and 16 August 2005, involving 19 laboratory-confirmed cases and three deaths (the outbreak reported in this paper). The infecting organism in all cases was L. pneumophila serogroup 1 (Lpsg1) [Reference Pink14]. Between 2001 and 2004 there were only five laboratory-confirmed Lpsg1 cases in the Christchurch region. Most outbreaks of LD in New Zealand have been due to Lpsg1 [Reference Graham4].
With three confirmed fatalities, this outbreak attracted considerable media interest [15] and resulted in a degree of pressure for the local public health service, Community and Public Health (CPH), to identify the source [Reference Davis16]. During July as the outbreak continued, Public Health Intelligence (at the time the epidemiology group of the Ministry of Health) was contacted to explore potential spatial epidemiological methods to identify if there was any systematic clustering of cases, and any spatial relationship with the 137 cooling towers across the city that were the suspected source of the outbreak. Here we describe results of the outbreak investigation with a particular focus on how spatial epidemiological methods can support epidemiological, environmental and microbiological methods.
METHODS
Epidemiological investigation
The criteria for confirmation of a LD case were defined as a person who had: (1) clinical pneumonia; (2) laboratory results demonstrating evidence of infection with Lpsg1; and (3) illness onset between 4 April and 16 August 2005. The laboratory diagnosis included isolation of Lpsg1 from respiratory secretions, detection of Lpsg1 in urine, or a minimum of a fourfold increase (above 256 in paired sera) in antibody titres against Lpsg1 (Table 2). The demonstration of Legionella antigens in urine by the urinary antigen test (UAT) or of Legionella-specific DNA by polymerase chain reaction (PCR) testing in any clinical specimens is yet to be officially adopted for the New Zealand legionellosis case definition [Reference Graham4]. Consequently, although laboratory tests identified 19 cases, those that were both Legionella PCR-positive and UAT-positive did not meet the criteria as a ‘case’ under the current case definition. For this study the probable case definition was expanded to include ‘those with clinically compatible illness and the demonstration of Legionella spp. antigens including DNA in clinical samples including urine’.
Table 1. Odds ratios of exposure factors for source of Legionnaires' disease outbreak
Table 2. Summary of microbiological findings for all cases legionellosis associated with the outbreak

a Based on the ‘expanded’ case definition.
b Information obtained from Canterbury Health Laboratories (CHL), Community & Public Health and the Institute of Environmental Science and Research Ltd (ESR).
c Culture of respiratory samples for Legionella bacteria undertaken by CHL, confirmation of isolates undertaken by ESR.
d UAT, Urinary antigen test undertaken by CHL.
e Legionella antibody titres by indirect fluorescent antibody test on convalescent serum undertaken by ESR.
f Polymerase chain reaction (PCR) performed on respiratory samples using mip gene and Legionella-specific 16S gene targets. Confirmation of product performed by DNA sequencing and sequence comparison to known Legionella sequences.
g SBT, Sequence-based typing undertaken by ESR on PCR-positive and culture-positive samples; n.s., no sample.
At the beginning of August 2005 a case-control study was undertaken by CPH in two phases to identify risk factors related to personal characteristics, activities and potential exposures to aerosols contaminated with Legionella. The first phase involved the random selection of controls from the municipal electoral roll. Three controls were matched to each case according to age and sex. In the second phase of the study controls were selected from inpatient hospital data (cardiorespsiratory outreach clinic) by age and sex [Reference Pink14].
Information was collected from case-control participants by telephone interview using a standardized questionnaire designed in EpiData version 3.1 (EpiData Association, Denmark). The questionnaire contained variables indexed to three types of information: (1) personal characteristics including medical history, (2) housing and living conditions and (3) recent outdoor activities including exposure sources of Legionella during the 10 days prior to the illness. To determine the possibility of cumulative exposure to outdoor air, subjects were asked about outings from their home in the previous 2 months and time spent at each location during the period.
Data entry and univariate analysis of the case-control study was performed using Epi Info version 3.5.1 (CDC, USA). For risk analysis each potential factor was considered by its odds ratio (OR) and confidence intervals (95% CI) were calculated for the exposure variables using Fisher's exact P values.
Environmental investigation
Household water including hot water (cylinders, showers heads) of all the notified cases homes' was systematically sampled using 1-litre water samples and surface swab samples of biofilm. Other possible sources of Legionella were also examined and sampled including a municipal street sweeper, ornamental water/ponds and Christchurch's urban drinking water supply from five wells drawing water aquifers located in the two western pressure zones. Five cooling towers located in the western part of the city were sampled by CPH.
Hill Laboratories in Christchurch (a commercial provider of testing services for Legionella in cooling tower water samples) sent all Lpsg1 isolates from cooling towers to ESR for confirmatory testing during the outbreak period. Other commercial providers of testing services for Legionella in cooling towers were asked to send any Lpsg1 isolates from other cooling towers located around Christchurch during the outbreak period to ESR for confirmation. Swab and all other water samples were sent to ESR for isolation of Legionella organisms according to standard methods (AS/NZS 3896: 1998 [17]; ISO 11731 [18] for the isolation of Legionella from environmental waters.
Laboratory investigation
Most cases were confirmed with an UAT. Only two cases were confirmed by culture as most patients were too ill to produce a sputum specimen. Urine specimens from people who met the case definition for LD were tested by the Canterbury Hospital Laboratory (CHL) for the presence of antigens of Lpsg1 using commercially available tests (such as Binax NOW Legionella UAT, USA, that is reported to be highly specific and sensitive [Reference Kazandijian, Chiew and Gilbert19]). The indirect immunofluorescence assay (IFA) was used for serum to test the presence of antibodies against Lpsg1. Antibody titres >256 were considered as evidence of Legionella exposure.
Retrospective sequence-based typing (SBT) analysis was performed on the five clinical specimens that tested positive for Lpsg1 from the outbreak samples (only five samples were suitable for SBT). The SBT analysis was to establish if they were genetically indistinguishable and therefore possibly from the same source. Sequence analyses were performed using Sequence Navigator (Applied Biosystems) or Bionumerics version 4 (Applied Maths NV, Belgium) software. For all analyses the data obtained with the forward and reverse sequencing primers were combined and aligned to produce a consensus sequence. Consensus sequences were then identified by comparison with the sequences of pre-existing alleles using the online European Working Group on Legionella Infections SBT database at HPA website (http://www.hpa-bioinfotools.org.uk/legionella/php/sbt_query1.php).
Geospatial investigation
The spatial analysis used the two New Zealand census geographies of meshblocks (mean population 140) and larger census area units (CAU; mean population 1500). These were populated using the 2001 NZ census (total population and those aged >50 years) as the denominator population, and the residential addresses of the case and control data as numerators (the 4-year difference between case and census data is not detrimental to this analysis).
Two cases and 16 controls were removed from the spatial analysis as they resided beyond the Christchurch City (Territorial Authority) study area and six water towers were excluded: four had no address information, and two were removed as they were beyond the study area. From case follow-up there was no common occupational, recreational or other associated link among cases, and therefore the residential address was used as the sole locational attribute.
The analysis was undertaken using the two spatial scales of meshblocks and CAUs to overcome the potential for statistical distortions in analysis commonly referred to as modifiable areal unit errors (MAUP) [Reference Openshaw20]. Such errors arise in ecological studies that use census reporting tracts because the units are analytically arbitrary. That is, census units created for population enumeration can take alternative forms with each grouping influencing the analysis. Cluster analysis aims for spatial stationarity where clustering is invariant to the units of analysis. Here spatial stationarity in the distribution of cases was assessed by using both meshblocks and CAUs as the units of analysis.
To remain impartial and for objectivity the clustering tests assumed no a priori putative source, and examined the complete distribution of cases and controls across Christchurch. This ensured the cluster investigation was not driven by where it was thought the source of the outbreak might be. Two analytical approaches were used to search for clusters of cases: first, a test of spatial intensity was used to look for areas where there were more cases than expected, and second, a test of spatial dependency looked for cases close together. The tests for spatial intensity were performed using SaTScan [Reference Kulldorff21] and the tests for spatial dependency were performed using GeoDa [Reference Anselin22]. The data were mapped in ArcGIS v. 9.1 [23].
The spatial intensity tests examined the distribution of the cases in relation to the control data and then the population aged >50 years. SaTScan uses an adaptive window travelling across the study area, used here as incrementally increasing in size from 6% to 50% of the study population. Within each circle the statistical likelihood of a cluster was assessed from a Monte Carlo-simulated distribution (Bernoulli for controls and Poisson for the population aged >50 years).
The spatial dependency tests examined the distances between the meshblock and CAU centroids that the case data were grouped into using the local Moran's I spatial autocorrelation test statistic [Reference Anselin22, Reference Getis, Ord, Longley and Batty24, Reference Fotheringham, Brunsdon and Charlton25]. Two distances were used to assess clustering; first, the mean distance between case areas found in the smallest SaTScan cluster (2 km), and second, the mean distance between all case areas (6 km).
All results were mapped against meshblock level socioeconomic status (SES) measured using the 2001 census-derived New Zealand Index of Deprivation (NZDep2001) [Reference Salmond and Crampton26] equally distributed across five quintiles.
RESULTS
Epidemiological results
Between April and August 2005, 20 patients fulfilled the case definition; however, one notification was later identified as a false positive reducing the total number to 19 cases. Three cases died, giving a case-fatality risk of 15·8%. One other case required hospitalization. The remaining 15 cases were diagnosed by their general practitioners and fully recovered. There were 16 males and three females (male/female ratio: 5·3). The mean age was 71 years (range 29–91 years). The patients' dates of onset of illness were between 4 April and 16 August 2005 (Fig. 1).

Fig. 1. Epidemic curve for the Legionnaires' disease outbreak, Christchurch, New Zealand, April to August 2005.
No new cases were detected after a directive was given by the Medical Officer of Health on 5 August 2005 for all owners of cooling towers to ‘shock dose’ their systems with biocide, the notification on 16 August being within the incubation period. The shape of the epidemiological curve (Fig. 1) was consistent with an extended time period point-source exposure. The cases were residentially located across most of Christchurch with no obvious clustering (Supplementary Fig. S1).
Environmental results
None of the environmental samples collected from the homes of the notified cases were culture-positive for Legionella. Similarly, the urban drinking-water supply, road sweeper and the fountains/ponds environmental samples were all negative for Legionella. A culture-negative result implies the sample did not contain any Legionella, or if present it was below the level of detection [<1 colony-forming unit (c.f.u.)/10 ml].
Environmental samples from cooling towers located on five sites in western Christchurch were sent to ESR for testing. Four were culture-positive of which two were Lpsg1, both from the same tower. One of these results showed an excessively high reading of 2400 c.f.u./ml for 1 April 2005 and the other, a lower, but still positive result for 29 August 2005. The location of that cooling tower was close to the centre of the cluster identified by the spatial analysis. No Lpsg1 isolates were received by ESR from other commercial cooling tower service providers – many had not been tested before with biocide so it is possible that some positive results may have been withheld due to ‘commercial sensitivity’. The case-control study (613 controls) failed to identify predisposing risk factors for LD relating to living in a house or where subjects had been outside during the 10 days before the illness, although misting machines as a non-specific source were identified. Unsurprisingly current smoking status as a risk factor for increased susceptibility/severity of LD was identified (Table 1).
Laboratory results
Two of the 19 notified cases were culture-positive with Lpsg1 isolated from respiratory samples at CHL. The isolates were sent to ESR for confirmatory testing. Under the current case definition these were the only two cases to fulfil the ‘confirmed case’ classification.
Eighteen of the 19 cases were UAT-positive, indicating a recent Lpsg1 infection. It is unknown if the remaining (second notified) case was UAT-positive, but this case was culture-positive for Lpsg1.
At least one convalescent-phase serum from 14 of the 19 cases was tested for the presence of antibodies to Lpsg1 using the IFA test. None of the sera showed titres >256, the level considered diagnostically evident of Legionella exposure. Twelve of the 14 tested had titre levels of ⩽64 – the level that is considered as not evident of exposure to Legionella.
The SBT allele patterns obtained for all the Lpsg1 isolates tested are shown in the last column of Table 3. Two different allele profiles were seen in the five positive clinical samples associated with the outbreak: 1,4,3,1,1,1 and 2,10,18,10,2,1. This finding suggested either two different Lpsg1 infection sources or the single isolate with the 2,10,18,10,2,1 profile was a sporadic case and not part of the outbreak.
Table 3. Summary of sequence-based typing (SBT) results of Christchurch Legionella pneumophila serogroup 1 (Lpsg1) isolates

CHL, Canterbury Hospital Laboratory; OB, outbreak; PCR, polymerase chain reaction.
Grey shading denotes clinical cases, remainder are environmental cases.
* Location added retrospectively after first report February 2007 (originally ‘Unknown’ location).
Four different allele patterns were seen for the environmental isolates collected during the outbreak period, of which only one matched the profile for 4/5 clinical cases for which typing profiles were obtained. The SBT profiling identified two possible contaminated sources with the same allele pattern as those seen in four of the five cases proving a possible point source for the outbreak [Reference Harte27].
Geospatial results
Seven clusters were found: five spatial intensity clusters and two spatial dependency clusters. When combined the clusters measured 11·6 km east–west by 10·7 km north–south. For mapping the results the spatial intensity clusters were ranked from the smallest to the largest based on moving window size. The smallest cluster was constructed from meshblocks with a window size increasing from 6% of the population (Supplementary Fig. S2, map 1), to the largest cluster created from CAUs and window size set to a maximum of 50% of the population (Supplementary Fig. S2, map 2). The smallest cluster contained 35% of cases (n = 6), while the largest contained 76% of cases (n = 13). None of these clusters were significant at the 5% level.
The statistically significant (P = 0·05) spatial dependency clusters are shown in Supplementary Figure S3. Map 1 shows the 2 km mean distance clustered meshblocks, while map 2 shows the 6 km mean distance clustered meshblocks. No association with SES was found as the distribution of cases is invariant to the NZDep2001 index.
The seven identified clusters from both tests were concentrated in the same area and exhibited a clear anisotropic process (noticeable direction) revealing a funnel shape consistent with a plume effect from a point source located in the core of the clusters (Fig. 2).
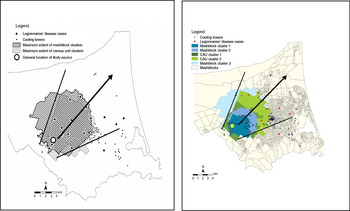
Fig. 2 [colour online]. Hypothesized plume dispersal pattern (black lines) of clusters, with prevailing wind direction (black arrow), Legionnaires' disease cases, water towers, probable source tower (large dot: exact location obscured).
DISCUSSION
This was New Zealand's largest recognized outbreak of LD, with 19 laboratory-confirmed cases over a 4½-month period. Its protracted nature and associated mortality resulted in considerable public concern. Combined epidemiological, environmental, microbiological and spatial investigation implicated a single cooling tower as the likely source.
However, the investigation did not provide irrefutable proof of a single outbreak source possibly due to the small number of environmental samples sent to ESR for testing and the small number of outbreak cases that were either culture- or PCR-positive. While matching the allele profiles of circulating Lpsg1 strains supported a common source for most of the cases in the outbreak, the possibility of an ‘endemic strain’ of Lpsg1 surviving in more than one location could not be refuted without testing further environmental isolates from the Christchurch area. For most patients with an Lpsg1 infection the antigen can be detected in urine within 3–5 days of onset of symptoms and usually can be detected for up to 30–60 days [Reference Domínguez28, Reference Birtles29]. Prolonged urinary antigen excretion for >60 days has been reported but this is rare. Factors related to prolonged excretion have included severity of illness and immunosuppression [Reference Sopena30]. It was fortunate that the CHL uses the UAT in its diagnosis for patients admitted with pneumonic symptoms, otherwise many of the cases may not have been discovered. The case definition for LD has since been reviewed in light of the testing methods now available [31].
An unusual feature of the Christchurch cases was that none of the sera showed titres >256, the level considered diagnostically evident of Legionella exposure.
This is an unusual finding, as it is expected that at least 50–70% of those infected with Lpsg1 would elicit a measurable antibody response in the IFA test within 4–6 weeks of their symptom onset [Reference Edelstein, Meyer and Finegold32, Reference Monforte33]. Since all cases were either culture-positive or UAT-positive, indicating exposure to Lpsg1, it would be expected that most would eventually demonstrate seroconversion with the presence of antibodies to Lpsg1.
The spatial investigation provided context and helped interpret the inconclusive diagnostic results. Spatially describing the distribution of cases through clustering was essential for identifying the likely source area, and in explaining the probable method of pathogen dispersion. Investigations by CPH identified four water cooling towers as the most likely source (based on historical evidence from local authority inspections). While there were a number of other water towers located within the clusters, only one of the four suspected source towers was contained in the clusters. This tower was later identified as containing Lpsg1 colonies of the same isolate type found in the majority of the clinical specimens [Reference Harte27]. The location of this tower in the centre of clusters is consistent with the clear plume exhibited by mapping the clusters and supported the environmental hypothesis that the wind acted as the dispersal vector.
At first it might appear difficult to draw a robust conclusion from the spatial cluster results as some were not statistically significant. However, where the number of cases is small (n = 17 in the study area) definitive proof of the outbreak source does not always occur even when examining the evidence in total. Nevertheless, even in the absence of traditional statistical significance at normal 95% and greater levels, a geographically significant outcome can be assessed. In this instance the results were all mutually supportive in identifying clusters of cases based on airborne exposure from the same source area.
While Geographical Information Systems (GIS) are routinely available and straightforward to use, the appropriate use of spatial analytical techniques requires training and experience. This need was demonstrated here by the value of using two approaches to assess geographical clustering, intensity looking for an excess of cases and dependency looking for proximity of cases. These methods complement one another by assessing the spatial distribution of data, and the significance of any patterns found, from the two main spatial pattern processes [Reference Bailey and Gatrell34].
This outbreak investigation highlights the importance of multidisciplinary collaboration between public health units, laboratory diagnostics and geospatial epidemiologists. Outbreak investigations are jigsaw puzzles, often with no single approach able to be conclusive. Instead the accumulation of evidence from different sources and agencies can identify a ‘smoking gun’.
This investigation adds to the evidence that community clusters of LD dispersed from water towers over flat terrain can be found to extend up to 12 km. The 11·6 km maximum extent of the clusters found in Christchurch is similar to the 12 km modelled dispersion levels from a cooling tower source found by Nguyen et al. [Reference Nguyen2] from a community-wide outbreak of LD in France. Similarly, the clusters in Christchurch are consistent with the 10 km distance from an outbreak in Norway in 2005 [Reference Blystad, Brantsaeter and Lovell35]. The flat terrain of Christchurch is also similar to the topography reported in the French and Norwegian studies, and is therefore likely to be an influencing determinant for the airborne dispersal distance of LD. These dispersal distances are greater than the 3·2 km reported by the WHO [Reference Sartory36], and so may be a more informative estimate for public health officials investigating cooling tower outbreaks of LD.
This outbreak investigation demonstrated the value of geographical significance through mapping and visualizing the clusters [Reference Koch37, Reference Koch and Denike38]. In this outbreak, geographical significance of the clusters was immediately apparent, with all the clusters seeded from the same local area and describing a possible clear plume effect consistent with an environmental hypothesis for the dispersion of the Legionella pathogen. This, in the environmental context, is particularly valuable as standard measures of statistical confidence may sometimes be lacking, particularly with ecological study designs.
Finally, this work has demonstrated the utility of GIS to public health analysis. Easy to use GIS can empower a wider range of health GIS users to undertake public health research. As demonstrated here, the appropriate use of GIS techniques can make a significant contribution to practical epidemiology and public health outbreak investigations. For example, in this outbreak a lack of a centralized register of cooling towers made it difficult once the investigation started to focus on cooling towers as a potential source. This necessitated the rapid development of a new database of cooling towers by CPH using GIS to capture the address location.
Consequently, consideration needs to be given to the development of legislation or regulatory amendments to ensure that all owners and/or operators of cooling towers be required to register the towers with the relevant territorial authority (together with ownership and maintenance details).
A key limitation with the spatial approach used here was that the clusters contained a number of water towers so the source tower could not be positively identified. The close proximity of water towers (median separation distance 244 m, interquartile distance 295 m) meant that an ecological study of this sort could not identify a single source tower from among many closely neighbouring towers. Focused clusters tests that search for clusters around suspected source locations can be undertaken [Reference Monforte33], and can save time and effort if the source is known. However, this approach was not used here to avoid confounding resulting from the many closely neighbouring water towers.
CONCLUSION
This outbreak investigation demonstrated the value of spatial methods to complement epidemiological, environmental, and microbiological approaches used in outbreak investigation. Here the environmental and microbiological results were indicative of legionellosis infection among the cases but inconclusive as to type, or if infection resulted from the same source. This is where cluster analysis and mapping helped to understand the exposure source and pathway.
Spatial methods helped public health officials to quickly understand the distribution of a citwide outbreak in a community threatened by more deaths from an unknown source. Mapping helped communicate the information to the public in a clear and accessible way. Ultimately, this investigation illustrates the need for spatially trained public health analysts and epidemiologists as part of the multi-disciplinary workforce needed to respond to outbreaks and other public health emergencies.
SUPPLEMENTARY MATERIAL
For supplementary material accompanying this paper visit http://dx.doi.org/10.1017/S0950268812000994.
ACKNOWLEDGEMENTS
Aspects of this work are based on data and information provided by the Institute of Environmental Science & Research Limited solely for the benefit of the New Zealand Ministry of Health and Statistics New Zealand. However, the analyses, conclusions, opinions and statements expressed herein are those of the authors, and do not necessarily represent the views or policy of the Institute of Environmental Science & Research Limited, the Ministry of Health, Statistics New Zealand, or the Food and Agriculture Organization of the United Nations. The New Zealand Ministry of Health does not assume any liability for use of or reliance on the contents of this article. Dr White was previously affiliated with Public Health Indigence, Public Health Directorate, Ministry of Health, Wellington, New Zealand.
DECLARATION OF INTEREST
None.


