


Impact Statement
There is increasing global demand for energy, and yet we must drastically cut emissions to combat climate change. This will require significant change. In this work, we extend a web-based digital twin to integrate data that are critical to solving these problems, including a description of the energy infrastructure, energy consumption and climate in the UK. The design of the digital twin is universal—it can and will be extended to cover other types of data. It has the ability to update itself and to support data-driven decision making in complex environments. For example, how much CO2 can we avoid by changing how we heat our homes, and would this increase or decrease fuel poverty and inequality?
1. Introduction
The gas grid in the UK is responsible for the distribution of gas from intake terminals on the coast to domestic and industrial end users. The grid has existed in a near constant state of flux since its construction in the 19th century (National Grid, 2021a). The grid is currently used to distribute natural gas, which is responsible for 52% of carbon dioxide emissions from the Department for Business, Energy, and Industrial Strategy (United Kingdom) (2020, 2021). It is possible that the next evolution of the grid may see it adapted to deliver hydrogen to mitigate carbon emissions whilst ensuring energy security (Dodds and McDowall, Reference Dodds and McDowall2013; Bristowe and Smallbone, Reference Bristowe and Smallbone2021). The role hydrogen may have in a net zero UK has been outlined by the Committee on Climate Change (2018) which deems hydrogen promising in low-regret short-term scenarios such as blending with natural gas, as well as longer term scenarios in providing peak energy alongside heat pumps, taking advantage of the flexibility of the gas grid to smooth out fluctuations between energy supply and demand.
Assessing how best to use the gas grid to support net zero requires models that describe the interactions and dependencies between technologies included in the energy mix. As the energy mix becomes increasingly varied, the scenarios considered by the models will necessarily increase in complexity (Speirs et al., Reference Speirs, Balcombe, Johnson, Martin, Brandon and Hawkes2017). Inevitably, such analyses will build upon diverse heterogeneous data sets and will likely include submodels that consider a range of factors, for example including more detailed geospatial and temporal descriptions of renewables, social and environmental factors. As the complexity increases, it is likely that modeling will transition from single-institution teams to distributed, collaborative teams, so that multiple domain experts are able to contribute to a given analysis (DeCarolis et al., Reference DeCarolis, Jaramillo, Johnson, McCollum, Trutnevyte, Daniels, Akn-Olçum, Bergerson, Cho, Choi, Craig, de Queiroz, Eshraghi, Galik, Gutowski, Haapala, Hodge, Hoque, Jenkins, Jenn, Johansson, Kaufman, Kiviluoma, Lin, MacLean, Masanet, Masnadi, McMillan, Nock, Patankar, Patino-Echeverri, Schivley, Siddiqui, Smith, Venkatesh, Wagner, Yeh and Zhou2020; Yalew et al., Reference Yalew, van Vliet, Gernaat, Ludwig, Miara, Park, Byers, Cian, Piontek, Iyer, Mouratiadou, Glynn, Hejazi, Dessens, Rochedo, Pietzcker, Schaeffer, Fujimori, Dasgupta, Mima, da Silva, Chaturvedi, Vautard and van Vuuren2020). O’Dwyer et al. (Reference O’Dwyer, Pan, Charlesworth, Butler and Shah2020) demonstrate a Sustainable Energy Management System (SEMS) to manage the flow of data between machine learning models, cities and districts. However a general and scalable solution for the construction of cross-domain models remains unrealized.
The suboptimal organization of complex models and data creates problems. With respect to energy, it is important to ensure models and assumptions are clearly understood, and that data are transparent (Pfenninger et al., Reference Pfenninger, Hirth, Schlecht, Schmid, Wiese, Brown, Davis, Gidden, Heinrichs, Heuberger, Hilpert, Krien, Matke, Nebel, Morrison, Müller, Pleßmann, Reeg, Richstein, Shivakumar, Staffell, Tröndle and Wingenbach2018). The types of data particularly relevant to energy scenarios are time-series, geographic, and tabular data (Pfenninger et al., Reference Pfenninger, Hirth, Schlecht, Schmid, Wiese, Brown, Davis, Gidden, Heinrichs, Heuberger, Hilpert, Krien, Matke, Nebel, Morrison, Müller, Pleßmann, Reeg, Richstein, Shivakumar, Staffell, Tröndle and Wingenbach2018). Current energy policy research lacks open data and modeling transparency, impeding the ability not only to reproduce results, but to adapt and combine existing models (Pfenninger et al., Reference Pfenninger, DeCarolis, Hirth, Quoilin and Staffell2017). The popular MARKAL and TIMES United Kingdom energy models (Hall and Buckley, Reference Hall and Buckley2016) are highlighted by DeCarolis et al. (Reference DeCarolis, Hunter and Sreepathi2012) as examples of models that would benefit from increased interpretability in how they handle the large quantities of data required by the models. The authors describe a typical workflow of entering data into a series of spreadsheets, with all changes and edits being performed manually. The problems exemplified by this type of workflow are widespread, where for example Delmelle (Reference Delmelle2019) notes that “fusing a multitude of types of data together in creative ways remains a challenge” in the context of geospatial data. It is clear that future tools will have to incorporate different types of data from a variety of domains.
Knowledge graphs are a promising technology to describe a broad range of domain specific information in an interpretable and modular manner. The information is represented using ontologies expressed as a directed graph, where the nodes of the graph represent concepts and instances, and the edges between nodes represent the respective relations between nodes. By specifying the relationships between data, the information becomes more accessible, making it easier for computational agents to interpret, query, and update the data. The World Avatar project (Eibeck et al., Reference Eibeck, Lim and Kraft2019, Reference Eibeck, Chadzynski, Lim, Aditya, Ong, Devanand, Karmakar, Mosbach, Lau, Karimi, Foo and Kraft2020) is exploring the use of dynamic knowledge graphs to enable interoperability between models and data from different domains. The dynamic knowledge graph is operated on by computational agents that read, manipulate, and update the nodes and edges of the knowledge graph, including adding new data, new concepts and new relations. The computational agents are themselves described in the dynamic knowledge graph. This forms a critical part of the design because it confers the ability to discover agents by reading from the knowledge graph, and the ability to create new agents, for example by combining existing agents to perform composite tasks, by writing to the knowledge graph. Each node in the knowledge graph has a unique identifier, allowing multiple agents and data sets to refer unambiguously to the same entity. Given a suitable ontologies, it is possible to represent anything. Therefore, temporal, dynamic, and geospatial data can be integrated, facilitating the complex representation of systems starting from simple sets of rules. The ability of computational agents to input data, simulate the behavior of systems and provide output has led to the suggestion of dynamic knowledge graph technology providing a suitable architecture for implementing a Universal Digital Twin (Akroyd et al., Reference Akroyd, Mosbach, Bhave and Kraft2021b).
The purpose of this article is to extend the World Avatar by developing ontologies to describe gas transmission systems, gas consumption data and climate observations. The ontologies are used to integrate climate observations for the first time with information relating to the UK gas transmission system, gas consumption and statistical output areas used to report governmental administrative data into large-scale Universal Digital Twin within the World Avatar. Computational agents are used to incorporate live data so that the resulting dynamic knowledge graph remains current in time. The article is structured as follows. Section 2 provides background about the World Avatar and the systems we represent in this article. Section 3 details the methodology used to develop the ontologies, and to instantiate and query the knowledge graph. Section 4 presents a use case that outlines the instantiation of the knowledge graph, and demonstrates the use of agents to create data pipelines and query geospatial data. Finally, Section 5 draws conclusions and discusses future work.
2. Background
2.1. Introduction to knowledge graphs
A knowledge graph expresses data as a directed graph, where the nodes of the graph are data items (either concepts or their instances) and the edges of the graph are links between related concepts or instances. A knowledge graph $ \mathcal{G} $
is composed of a set of triples. Each triple
$ \mathcal{G} $
is composed of a set of triples. Each triple $ t\in \mathcal{G} $
contains a subject
$ t\in \mathcal{G} $
contains a subject $ s\in C $
, predicate
$ s\in C $
, predicate $ p\in P $
and object
$ p\in P $
and object $ o\in C $
where
$ o\in C $
where $ C $
is a set of concepts and
$ C $
is a set of concepts and $ P $
is the set of possible relations between concepts. The subject and object define the nodes of the graph, and the predicates define the connections between these nodes. Similar to how web pages are assigned URLs, subjects predicates and objects are each given internationalized resource identifiers (IRIs). However, IRIs do not need to be informative themselves as they are designed to be machine readable. Rather, for a human to understand triples, subjects predicates and objects are assigned additional “label” predicates in order to provide context to human users. An example set of triples within a knowledge graph is as follows:
$ P $
is the set of possible relations between concepts. The subject and object define the nodes of the graph, and the predicates define the connections between these nodes. Similar to how web pages are assigned URLs, subjects predicates and objects are each given internationalized resource identifiers (IRIs). However, IRIs do not need to be informative themselves as they are designed to be machine readable. Rather, for a human to understand triples, subjects predicates and objects are assigned additional “label” predicates in order to provide context to human users. An example set of triples within a knowledge graph is as follows:
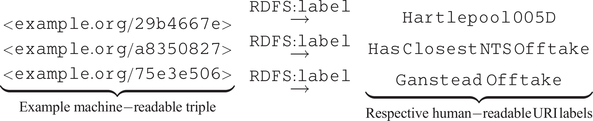 $$ \underset{\mathrm{Example}\ \mathrm{machine}-\mathrm{readable}\ \mathrm{triple}}{\underbrace{\begin{array}{c}<\mathtt{example}.\mathtt{org}/\mathtt{29}\mathtt{b}\mathtt{4667}\mathtt{e}>\\ {}<\mathtt{example}.\mathtt{org}/\mathtt{a}\mathtt{8350827}>\\ {}<\mathtt{example}.\mathtt{org}/\mathtt{75}\mathtt{e}\mathtt{3}\mathtt{e}\mathtt{506}>\end{array}}}\hskip1em {\displaystyle \begin{array}{c}\overset{\mathtt{RDFS}:\mathtt{label}}{\to}\\ {}\overset{\mathtt{RDFS}:\mathtt{label}}{\to}\\ {}\overset{\mathtt{RDFS}:\mathtt{label}}{\to}\end{array}}\hskip1em \underset{\mathrm{Respective}\ \mathrm{human}-\mathrm{readable}\;\mathrm{URI}\;\mathrm{labels}}{\underbrace{\begin{array}{c}\mathtt{Hartlepool}\;\mathtt{005}\mathtt{D}\\ {}\mathtt{Has}\;\mathtt{Closest}\;\mathtt{NTS}\;\mathtt{Offtake}\\ {}\mathtt{Ganstead}\ \mathtt{Offtake}\end{array}}} $$
where RDFS: denotes the Resource Description Framework Schema namespace http:www.w3.org/2000/01/rdf-schema/#. For the remainder of this work we reference human-readable labels of classes and instances unless otherwise stated. The namespaces used in the rest of this article are defined in the nomenclature.
Knowledge graphs can be divided into two sets of triples. The first $ {\mathcal{G}}_A\in \mathcal{G} $
contains assertive relations and the second
$ {\mathcal{G}}_A\in \mathcal{G} $
contains assertive relations and the second $ {\mathcal{G}}_T\in \mathcal{G} $
contains terminological relations. A set of terminological triples
$ {\mathcal{G}}_T\in \mathcal{G} $
contains terminological relations. A set of terminological triples $ {\mathcal{G}}_T $
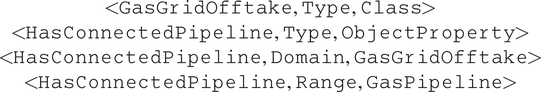
is also known as an ontology. An ontology defines the triples that can appear within a knowledge-graph, originating from the philosophical idea of what is known. Typical triples within an ontology consist of the definition of classes, relations, and the domain and ranges over which relations can take. For example:
$ {\mathcal{G}}_T $
is also known as an ontology. An ontology defines the triples that can appear within a knowledge-graph, originating from the philosophical idea of what is known. Typical triples within an ontology consist of the definition of classes, relations, and the domain and ranges over which relations can take. For example:
 $$ {\displaystyle \begin{array}{c}<\hskip-.35em \mathtt{GasGridOfftake},\mathtt{Type},\mathtt{Class}\hskip-.35em >\\ {}<\hskip-.35em \mathtt{HasConnectedPipeline},\mathtt{Type},\mathtt{ObjectProperty}\hskip-.35em >\\ {}<\hskip-.35em \mathtt{HasConnectedPipeline},\mathtt{Domain},\mathtt{GasGridOfftake}\hskip-.35em >\\ {}<\hskip-.35em \mathtt{HasConnectedPipeline},\mathtt{Range},\mathtt{GasPipeline}\hskip-.35em >\end{array}} $$
defines Gas Grid Offtake as a class within the knowledge graph, stating that this represents a subject or object of a triple, Has Connected Pipeline is defined as an object property stating that it should relate a subject and object within the knowledge graph. Lastly, this object property is assigned a domain and range that specifies what subjects and objects it should relate. It can be seen that by building up a representation of the systems we wish to represent using a collection of basic triples within an ontology, we specify precisely what is known, providing interpretability.
The second aspect of a knowledge graph $ {\mathcal{G}}_A $
concerns the assertional triples. This is where concrete examples of classes such as physical entities are defined and is where data exists within the knowledge graph. For example in the following three triples
$ {\mathcal{G}}_A $
concerns the assertional triples. This is where concrete examples of classes such as physical entities are defined and is where data exists within the knowledge graph. For example in the following three triples
 $$ {\displaystyle \begin{array}{c}<\hskip-.35em \mathtt{Ganstead}\mathtt{Offtake},\mathtt{Class},\mathtt{GasGridOfftake}\hskip-.35em >\\ {}<\hskip-.35em \mathtt{Ganstead}\hbox{-} \mathtt{Asselby},\mathtt{Class},\mathtt{GasPipeline}\hskip-.35em >\\ {}<\hskip-.35em \mathtt{Ganstead}\mathtt{Offtake},\mathtt{HasConnectedPipeline},\mathtt{Ganstead}\hbox{-} \mathtt{Asselby}\hskip-.35em >\end{array}} $$
we specify instances of the Gas GridOfftake and GasPipelinewe specify instances of class which are subsequently “connected” using the semantic relation previously defined. Using a logical reasoner we can check whether the triples defined within $ {\mathcal{G}}_A $
follow the rules defined in
$ {\mathcal{G}}_A $
follow the rules defined in $ {\mathcal{G}}_T $
. If they do not, then the knowledge-graph is deemed inconsistent. The interested reader is referred to Ehrlinger (Reference Ehrlinger2016) and Hogan et al. (Reference Hogan, Blomqvist, Cochez, D’amato, Melo, Gutierrez, Kirrane, Gayo, Navigli, Neumaier, Ngomo, Polleres, Rashid, Rula, Schmelzeisen, Sequeda, Staab and Zimmermann2021) for more detailed information.
$ {\mathcal{G}}_T $
. If they do not, then the knowledge-graph is deemed inconsistent. The interested reader is referred to Ehrlinger (Reference Ehrlinger2016) and Hogan et al. (Reference Hogan, Blomqvist, Cochez, D’amato, Melo, Gutierrez, Kirrane, Gayo, Navigli, Neumaier, Ngomo, Polleres, Rashid, Rula, Schmelzeisen, Sequeda, Staab and Zimmermann2021) for more detailed information.
2.2. The World Avatar project and a Universal Digital Twin
The World Avatar project seeks to investigate how a dynamic knowledge graph can be used to integrate multiscale cross-domain knowledge to create a world model (Eibeck et al., Reference Eibeck, Lim and Kraft2019). The dynamic knowledge graph is operated on by computational agents. The agents are themselves described in the knowledge graph so they can be discovered by reading from the knowledge graph, and can be combined to create new agents with composite functionality by writing to the knowledge graph. The computational agents can perform a wide variety of tasks including updating the knowledge graph with new data, simulating the behavior of systems described in the knowledge graph, and analyzing the results of such simulations. These capabilities form the basis of the notion that the dynamic knowledge graph contains a base world that provides a model of the world that remains current in time, and parallel worlds where alternative scenarios can be hypothesized based on the current base world, and agents used to simulate the behavior of the parallel world to perform what-if scenario analysis to support enhanced decision making (Eibeck et al., Reference Eibeck, Chadzynski, Lim, Aditya, Ong, Devanand, Karmakar, Mosbach, Lau, Karimi, Foo and Kraft2020).
The World Avatar is implemented using technology based on the Semantic Web (W3C, 2015). This choice is intended to ensure that the data in the dynamic knowledge graph is findable, accessible, interoperable and reusable as per the findable, accessible, interoperable, reusable (FAIR) Guiding Principles for scientific data (Wilkinson et al., Reference Wilkinson, Dumontier, Aalbersberg, Appleton, Axton, Baak, Blomberg, Boiten, da Silva Santos, Bourne, Bouwman, Brookes, Clark, Crosas, Dillo, Dumon, Edmunds, Evelo, Finkers, Gonzalez-Beltran, Gray, Groth, Goble, Grethe, Heringa, t Hoen, Hooft, Kuhn, Kok, Kok, Lusher, Martone, Mons, Packer, Persson, Rocca-Serra, Roos, van Schaik, Sansone, Schultes, Sengstag, Slater, Strawn, Swertz, Thompson, van der Lei, van Mulligen, Velterop, Waagmeester, Wittenburg, Wolstencroft, Zhao and Mons2016). The expressive power of ontologies means that the knowledge graph can represent and integrate data for almost anything. The applications of the World Avatar to date have focused on decarbonization (Pan et al. Reference Pan, Sikorski, Kastner, Akroyd, Mosbach, Lau and Kraft2015, Reference Pan, Sikorski, Akroyd, Mosbach, Lau and Kraft2016; Kleinelanghorst et al., Reference Kleinelanghorst, Zhou, Sikorski, Foo, Aditya, Mosbach, Karimi, Lau and Kraft2017; Zhang et al., Reference Zhang, Romagnoli, Zhou and Kraft2017; Devanand et al., Reference Devanand, Karmakar, Krdzavac, Rigo-Mariani, Eddy, Karimi and Kraft2020, Reference Devanand, Karmakar, Farazi, Krdzavac, Lim, Foo, Karimi and Kraft2022), city planning (Chadzynski et al., Reference Chadzynski, Krdzavac, Farazi, Lim, Li, Grisiute, Herthogs, von Richthofen, Cairns and Kraft2021; von Richthofen et al., Reference von Richthofen, Herthogs, Kraft and Cairns2021) and chemistry (Farazi et al., Reference Farazi, Akroyd, Mosbach, Buerger, Nurkowski, Salamanca and Kraft2019; Krdzavac et al., Reference Krdzavac, Mosbach, Nurkowski, Buerger, Akroyd, Martin, Menon and Kraft2019; Mosbach et al., Reference Mosbach, Menon, Farazi, Krdzavac, Zhou, Akroyd and Kraft2020). These examples illustrate the ability of the World Avatar to integrate models and data across different length scales and technical domains, ranging from the subatomic length scales of quantum chemistry calculations (Farazi et al., Reference Farazi, Krdzavac, Akroyd, Mosbach, Menon, Nurkowski and Kraft2020) to the application of the results of these calculations in city-scale atmospheric dispersion calculations (Mosbach et al., Reference Mosbach, Menon, Farazi, Krdzavac, Zhou, Akroyd and Kraft2020). The ability of the Semantic Web to support a distributed architecture and to represent and integrate heterogeneous data and models in a form that is discoverable and queryable via a uniform interface, combined with the ability of computational agents to input data, simulate the behavior of systems and provide output has led to the suggestion of dynamic knowledge graph technology providing a suitable architecture for implementing a Universal Digital Twin (Akroyd et al., Reference Akroyd, Mosbach, Bhave and Kraft2021b). Recent work building on this idea has developed a description of land use (Akroyd et al., Reference Akroyd, Harper, Soutar, Farazi, Bhave, Mosbach and Kraft2021a), investigated the effect of a carbon tax on the power system (Atherton et al., Reference Atherton, Xie, Aditya, Zhou, Karmakar, Akroyd, Mosbach, Lim and Kraft2021), and assessed how the change in energy consumption patterns that would arise from the adoption of heat pumps for domestic heating would affect social inequality in the UK (Savage et al., Reference Savage, Akroyd, Mosbach, Hillman, Sielker and Kraft2022).
2.3. Domain specific knowledge
This article demonstrates the modularity of a knowledge graph-based digital twin by combining existing sources of Linked Data (i.e., data that is already expressed in triples) with new semantic representations of the gas transmission system, and climate throughout the UK. In this section, we outline the sources of information we consider in the construction of a dynamic knowledge graph.
2.3.1. Office for National Statistics linked geography data
The Office for National Statistics (ONS) publishes Geography Linked Data (Office for National Statistics, 2019a). First issued in October 2018 (Office for National Statistics, 2019b), this collection of triples provides a geospatial representation of output areas within the UK. Through the use of a within relation, areas of different size are related to each other. These range from the entire UK down to areas containing on average 1,500 people, known as lower super output areas (LSOA). This relation enables data that is associated to the smallest output areas to be easily aggregated to larger regions. Figure 1 highlights the structure of this aspect of the knowledge graph, omitting relations that we do not make use of such as LandHectarage and OperativeDate. For a complete list of relations within this data set see Office for National Statistics (2019a).
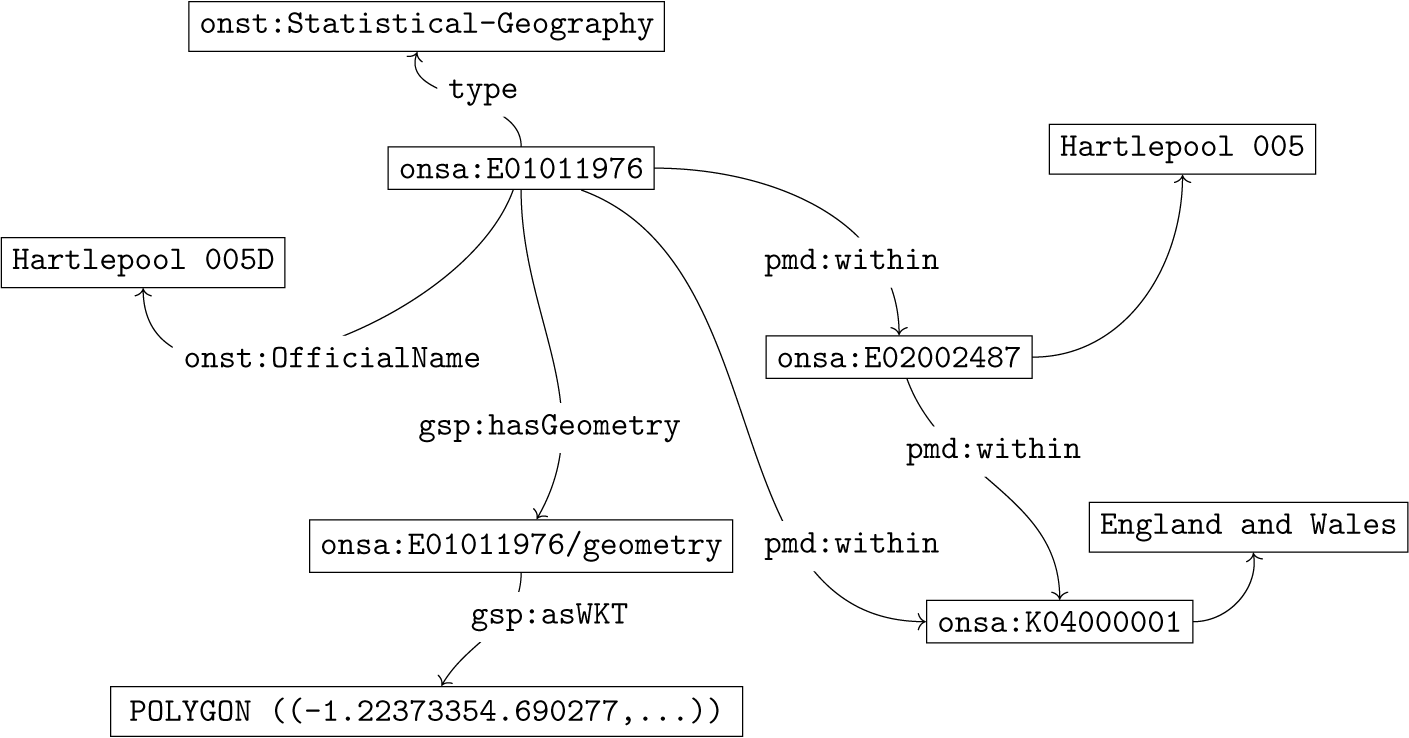
Figure 1. Representation of statistical output areas as linked data, or assertional triples $ {\mathcal{G}}_A $
. The example shown is for the Hartlepool 005D output area with respective code E01011976.
$ {\mathcal{G}}_A $
. The example shown is for the Hartlepool 005D output area with respective code E01011976.
Delmelle (Reference Delmelle2019) demonstrates the risks of performing data-driven geography with samples of uneven population size. Output areas as reported by the ONS (2011) are designed in a manner to approximately cover areas of equal population, social demographic and built environment based on census data. Cockings et al. (Reference Cockings, Harfoot, Martin and Hornby2011) outlines the methodology for the construction of the output areas utilized by the ONS.
2.3.2. UK gas transmission system and gas consumption
The UK gas transmission system, also known within technical documents as the national transmission system (NTS), consists of pipelines that transport high pressure gas from intakes near the coast to major industrial users such as power stations or local distribution offtakes where gas is further distributed to low pressure domestic gas networks. Compression stations and valves are situated throughout the NTS in order to maintain adequate pressure across the entire system based on fluctuating supply and demand. A key advantage of the gas transmission system is the flexibility it provides in energy supply. The quantity of gas contained within the grid at any one time is referred to as the linepack. Short term fluctuations in demand such as daily load changes can be met by pressurizing the grid in the evening, therefore increasing the total linepack. Likewise long-term seasonal changes in demand can be met through the decompression of liquefied natural gas (LNG) imports or the storage of gas within underground caverns.
Broadly, information regarding the NTS does not exist in a single location, and as such, key pieces of information that define what the NTS is must be identified to be parsed into relational triples. Apart from physical infrastructure itself such as pipes and compression stations, we also consider statistics associated with gas consumption, flow rates of gas at points throughout the grid, and additional knowledge regarding infrastructure.
The sources of information relating to the NTS that we represent as linked data within the knowledge graph are shown in Table 1.
Table 1. Sources of information as they relate to the UK gas transmission system including both static and dynamic data over a variety of file formats.
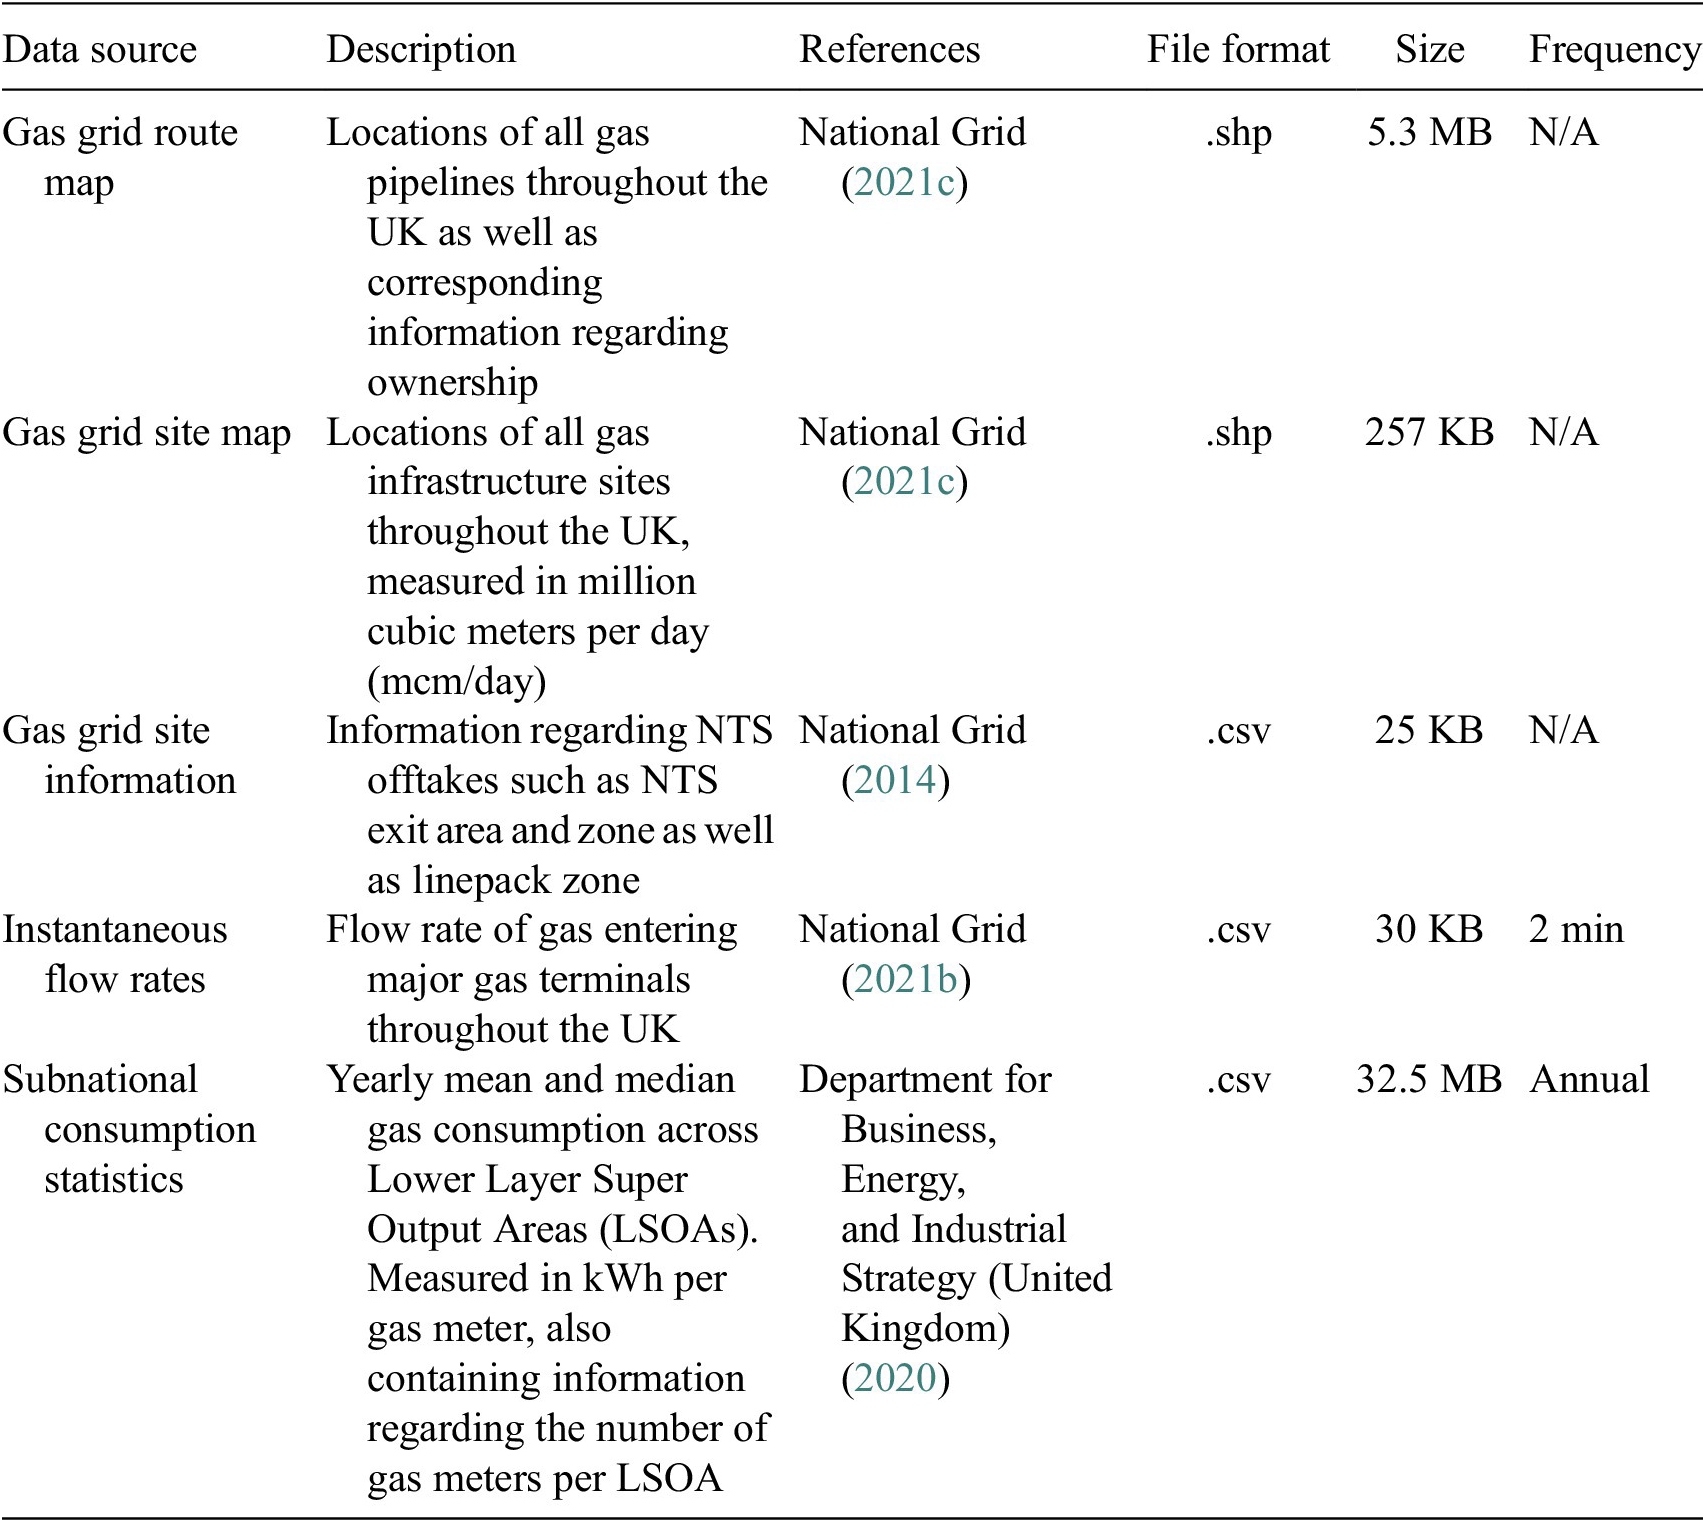
It should be noted that the information in Table 1 is at this stage disjoint. That is, despite the gas grid site map and instantaneous flow rate data referring to the same physical gas terminals, the information is not cross-referenced in a consistent way. As a result it becomes increasingly difficult to keep track of sources of information as they relate to the same physical entities. This issue is common-place in energy systems modeling wherein systems such as gas and electricity overlap. Currently approaches are bespoke and often complex such as the development of new management tools to support cross-domain interactions (O’Dwyer et al., Reference O’Dwyer, Pan, Charlesworth, Butler and Shah2020). By instantiating the concept of each gas terminal as a node within the knowledge graph, which each disjoint data set can link to, we can unify this information allowing computational agents to infer links between sources of information, therein providing a complete representation. Moreover, should additional information come-to-light, for example a hypothetical gas terminal operating condition data set, this can be easily appended to the knowledge graph by referring to the original concept of the specific gas terminal in question without requiring knowledge of existing data. Through this brief example we demonstrate the flexibility, modularity and scalablity of a knowledge graph-based solution.
2.3.3. HadUK grid climate observations
The HadUK-Grid climate data set (Perry and Hollis, Reference Perry and Hollis2005; Met Office et al., Reference Hollis, McCarthy, Kendon, Legg and Simpson2018) created by the Met Office, consists of values for various climate variables over a 1 by 1 km grid covering the entire of the United Kingdom. The variables available within the data set include: minimum, maximum and mean air temperature, precipitation, hours of sunshine, mean sea level pressure, wind speed, relative humidity, vapor pressure, snow cover and frost cover. Values are calculated through the interpolation of measurements at approximately 540 weather stations. Perry and Hollis (Reference Perry and Hollis2005) outlines the specific regression procedure used to generate monthly values.
Each grid point contains a discrete climate variable value for each month dating back to 1862. It should be noted that whilst the number of weather stations has changed since 1862 the grid over which interpolated values are presented is constant.
One of the key advantages of climate data as published as a uniform grid is that “regional values can be produced for any arbitrary area with greater accuracy and consistency” (Met Office, 2021). This advantage in the aggregation of climate data provides a benefit when considering its addition to the knowledge graph and subsequent linking to other, previously outlined aspects.
3. Methodology
3.1. Ontology development
In this section, ontologies are created to ensure that entities within the knowledge graph can be described using an appropriate vocabulary. These ontologies specify the rules as to which triples can logically exist and which cannot. For example a pipe segment has a single input and output, if triples were created allocating two outputs to a single pipe segment this would be reasoned as logically inconsistent within the rules of the ontology.
A guiding principle of ontology creation is that concepts should be reused from existing ontologies as much as possible to facilitate links across domains (Noy and McGuinness, Reference Noy and McGuinness2001). In this work, we define two new ontologies that are used alongside concepts from existing ontologies including OntoCAPE (Morbach et al., Reference Morbach, Yang and Marquardt2007), and the Ontology of Units of Measure (Rijgersberg et al., Reference Rijgersberg, van Assem and Top2013).
3.1.1. OntoGasGrid
To represent the concept of a gas grid ontologically we decompose the system into its parts and the whole they form. By decomposing a gas grid as such, we produce the set of rules that a gas grid must abide by in the form of an ontology, $ {\mathcal{G}}_T $
. We base the ontology on the vocabulary used to describe systems, respective subsystems and their parts defined by the OntoCAPE (Marquardt et al., Reference Marquardt, Morbach, Wiesner and Yang2010), an ontology to represent chemical processes. Specifically we make use of the upper-layer ontology.
$ {\mathcal{G}}_T $
. We base the ontology on the vocabulary used to describe systems, respective subsystems and their parts defined by the OntoCAPE (Marquardt et al., Reference Marquardt, Morbach, Wiesner and Yang2010), an ontology to represent chemical processes. Specifically we make use of the upper-layer ontology.
The first aspect we represent are physical gas pipelines. Figure 2 outlines how gas transmission pipelines are represented as triples. A mereological approach is taken, that is decomposing a system into respective parts and the whole they form. In this case, a GridPipeline is described as a combination of GridPipelineSegment instances. Each GridPipelineSegment is a system containing three parts: the start of the pipe, end of the pipe and connecting tube. Figure 3 illustrates how these discrete pipe segments are subsequently connected to form a complete grid pipeline.
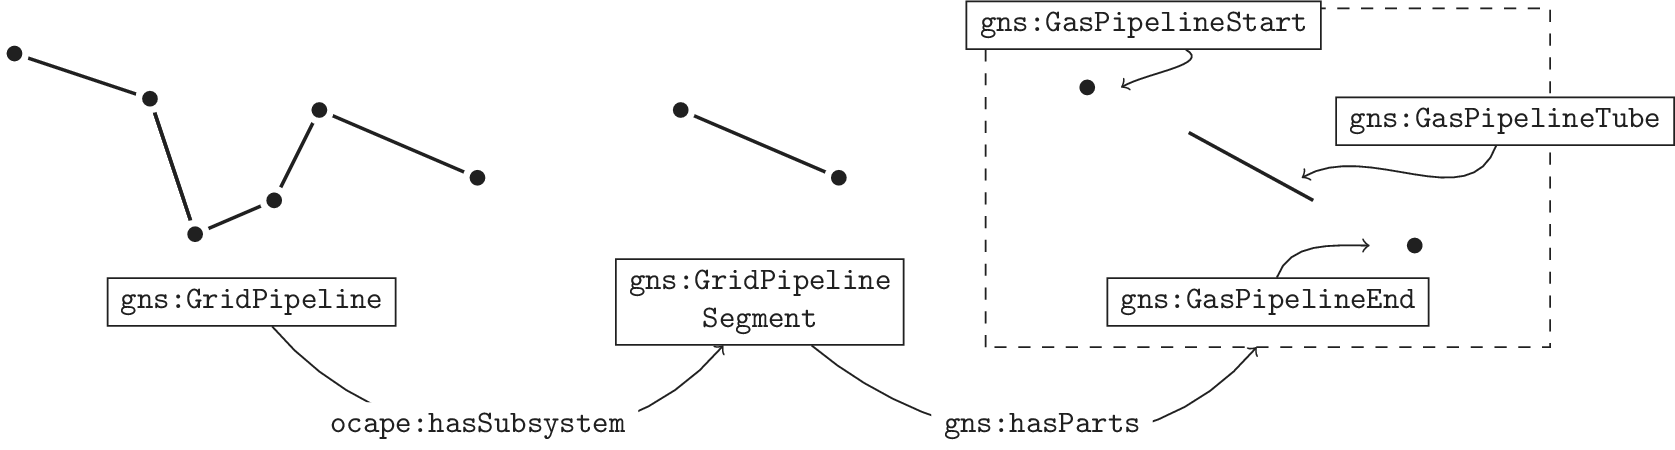
Figure 2. Outline of how pipelines are decomposed into respective segments and their parts within OntoGasGrid.
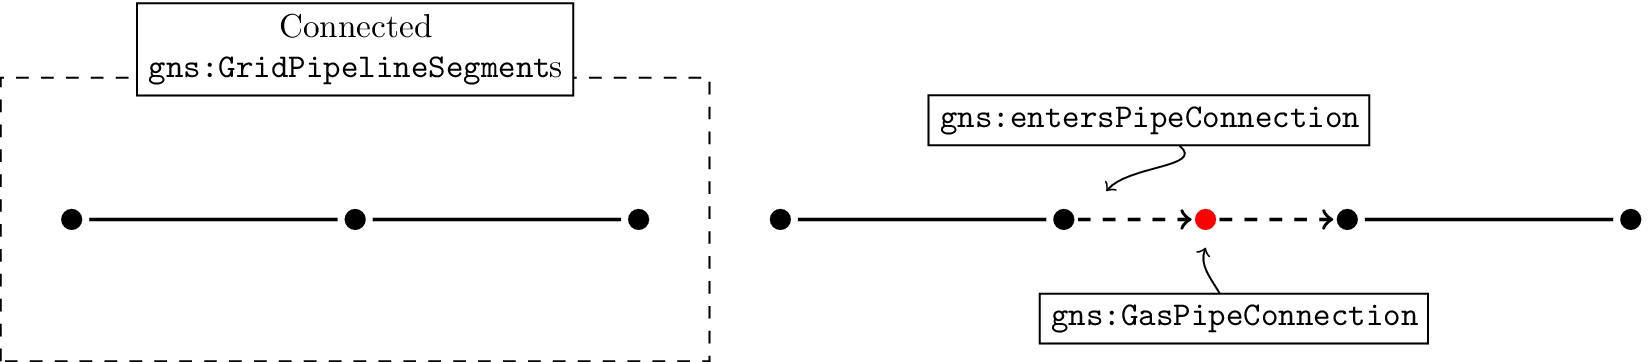
Figure 3. Example of how two connected pipe segments are related, specifying their connection.
As shown in Figure 3, the concept of a GasPipeConnection is introduced, allowing the end of one GridPipelineSegment to be specified as connected to the start of another. A longitude and latitude is assigned to each GasPipeConnection, as opposed to specifying the coordinates of the start and end of a pipe segment. This ensures that two pipe segments that start and end in different locations respectively cannot be deemed “connected.”
Aside from physical gas pipelines and their connectivity, OntoGasGrid also describes connected grid infrastructure including gas terminals and offtakes such as industrial users or power stations. The main class within this aspect of the ontology is that of a GridComponent, which consists of four main subclasses themselves decomposed into specific classes of infrastructure. This hierarchy is shown in Figure 4.
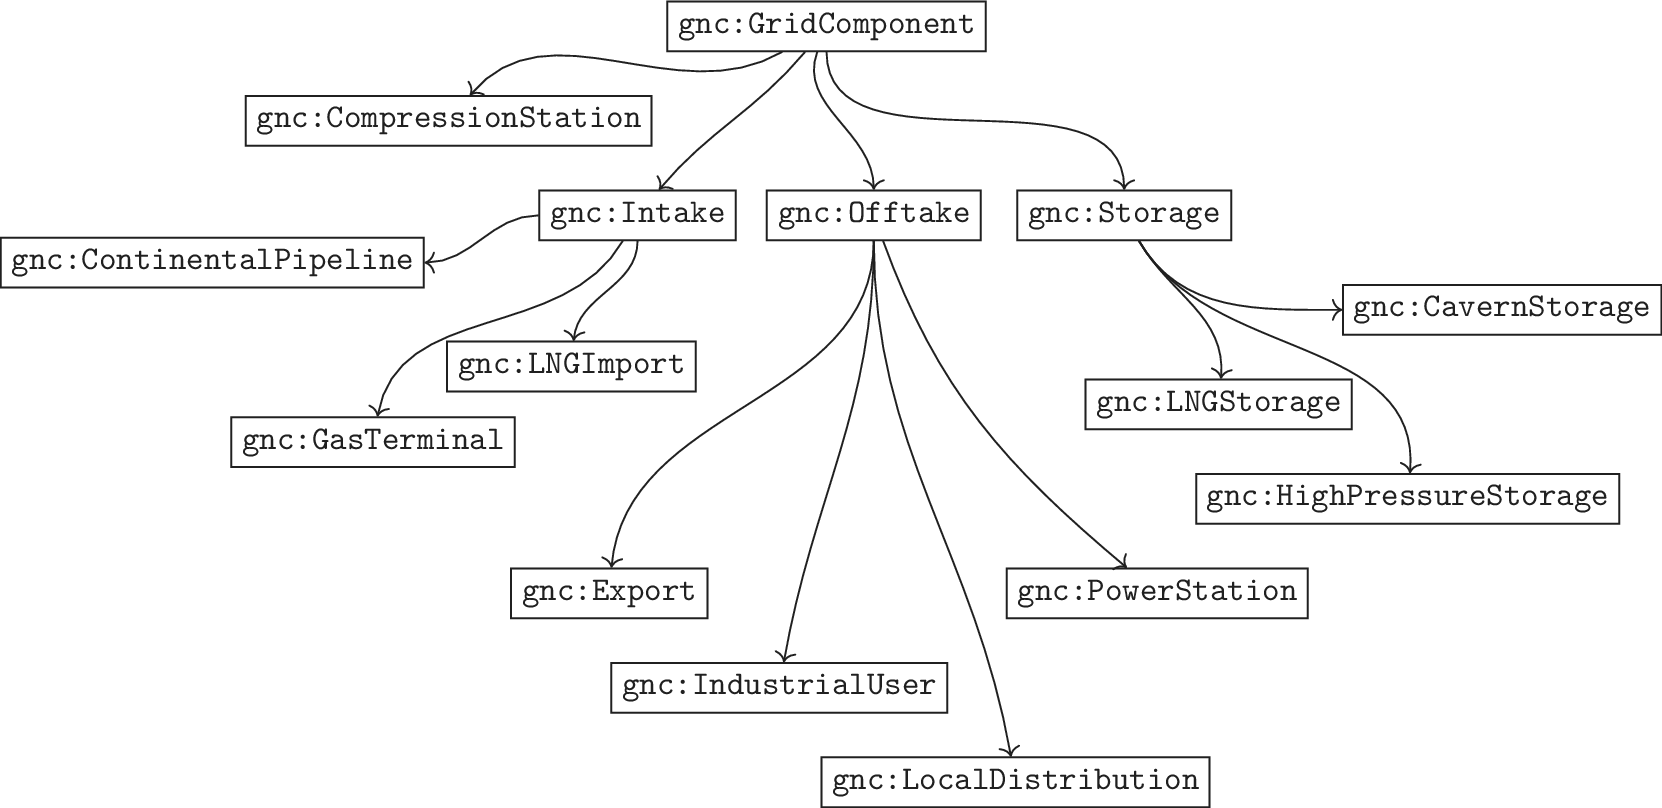
Figure 4. Hierarchy of grid infrastructure in OntoGasGrid where all arrows represent the property SubClassOf.
The ontology contains the property isConnectedToPipeline, with domain GridComponent and range GasPipeConnection. This property links connected infrastructure (i.e., instances of the class GridComponent) and gas pipelines. By providing this relation we are able to link the previously separate gas grid site map and gas grid route map presented in Table 1. Section 4.4 outlines how geospatial calculations are performed to identify connections between infrastructure and pipelines. The complete description logic (DL) representation of OntoGasGrid is provided within the Supplementary Material. At the time of writing OntoGasGrid contains 79 classes, 18 data properties which are associated to specific classes, and 841 axioms.
Although the situation does not arise in the case of the current data set, one important question is how to handle uncertainty. The philosophy we propose is that a digital twin should represent what is known, including representing gaps and uncertainty that is known to exist in data. So, in the case of networks, it should represent the known parts of the network, along with the source of the data, as well as represent, for example, any uncertainty in the route, dimensions, capacity or connections in the network. In this manner, all agents that interact with the digital twin will be able to query the full state of knowledge and make informed decisions about how to deal with the uncertainty. The use of ontologies to represent data provides the expressiveness required to do this. However, the best way to do it remains an open question.
3.1.2. OntoClimateObservations
OntoClimateObservations is a small ontology created to describe geospatial climate observations semantically. The ontology defines the minimum terminology to provide a link between previously described statistical regions and the concept of a climate measurement. Therefore, the ontology itself makes no effort to semantically describe the generating system (i.e., climate itself) and instead focuses on the concept of a measurement. The complete ontology is shown graphically in Figure 5.
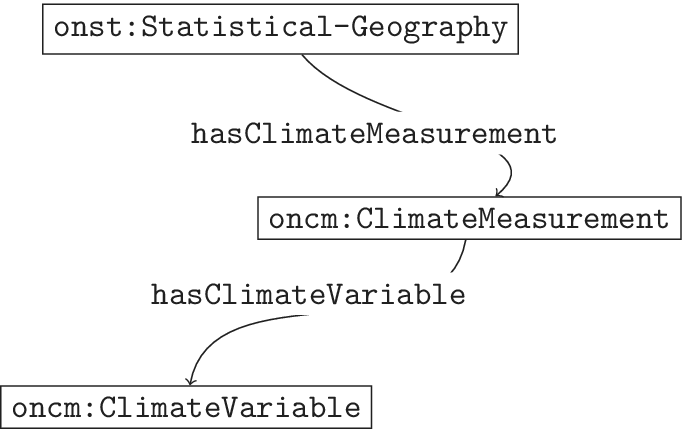
Figure 5. Ontology, $ {\mathcal{G}}_T $
to describe climate measurements associated to statistical regions. An example of assertional triples
$ {\mathcal{G}}_T $
to describe climate measurements associated to statistical regions. An example of assertional triples $ {\mathcal{G}}_A $
using this ontology is shown later in Figure 8.
$ {\mathcal{G}}_A $
using this ontology is shown later in Figure 8.
By providing a link to statistical output areas we enable the potential unification of statistics published throughout these areas, such as subnational gas consumption, with gridded climate data sets such as HadUK-Grid. The complete DL representation of OntoClimateObservations is provided within the Supplementary Material.
3.2. Computational agents
Computational agents are described in the knowledge graph using an agent ontology (Zhou et al., Reference Zhou, Eibeck, Lim, Krdzavac and Kraft2019). When activated, the agents interact with the knowledge graph to facilitate knowledge population, maintenance, information processing and retrieval. In this article, agents are created to instantiate domain specific knowledge using vocabularies from OntoGasGrid, OntoClimateMeasurements and other existing ontologies. The agents exhibit three types of behavior.
-
• Input. Agents convert information and sources of data into new triples that extend the knowledge graph. The input to the knowledge graph can be either static one-off information such as the location of physical infrastructure or dynamic information that is updated dynamically such as real-time flow rates.
-
• Output. Agents parse data from the knowledge graph to interact with the physical world, for example by controlling actuators or displaying data in convenient human-readable forms.
-
• Update. Agents query the knowledge graph, calculate new information, for example optimized model parameters (Bai et al., Reference Bai, Geeson, Farazi, Mosbach, Akroyd, Bringley and Kraft2021), and update the knowledge graph with the results, either through the modification of existing triples or by the creation of new triples. Such agents may also perform maintenance tasks such as the detection and deletion of invalid triples.
The agents developed in this work are described in detail in the following section.
4. Use Case
In this section, we outline the agents responsible for creating instances of classes previously outlined, such as gas grid infrastructure and climate values. Geospatial visualizations are enabled by a series of output agents. We conclude by presenting an example that illustrates the use of the knowledge graph in a cross-domain query to identify assets that are at risk from flooding.
4.1. Instantiation of HadUK-Grid climate observations
When considering the addition of the HadUK-Grid data set (Perry and Hollis, Reference Perry and Hollis2005; Met Office et al., Reference Hollis, McCarthy, Kendon, Legg and Simpson2018) into the knowledge graph there are two potential approaches.
-
1. Insert the HadUK-Grid data set directly within the knowledges graph by representing individual grid points and respective climate variable values as triples.
-
2. Link the HadUK-Grid data set to ONS statistical regions as opposed to representing individual grid points.
In this work, we take the second approach, first aggregating values within statistical regions and subsequently assigning values such as mean temperature to instances of these regions as opposed to representing grid points themselves.
When considering the compatibility between grid points and statistical regions it is noted that a statistical region may contain multiple grid points or alternatively a single point. In the case of small regions within urban areas a grid point may not even be enclosed within a region. This provides an additional challenge in unifying both climate variables across the UK and the set of statistical resources made available by the ONS, ensuring that regions are all assigned appropriate climate values.
A computational agent was created to interpret HadUK-Grid Network Common Data Form (netCDF) files (these are commonly used in climate research and are designed to be an appendable, portable, and self-describing method of sharing array-orientated scientific data), in order to populate the knowledge graph with climate data from throughout the UK as well as link to existing concepts of statistical regions. Subsequently, the agent represents this information as linked data using the OntoClimateObservations and Ontology of Units of Measure ontologies and uploads these triples to the knowledge graph. Grid points are assigned to statistical regions as follows:
-
• If a region contains multiple grid points, take the mean of the climate variable values of respective contained points. In the case of minimum or maximum values (such as that of minimum air temperature or mean air temperature) take the minimum or maximum value respectively of the set of contained points.
-
• If a region contains no grid points, identify the closest grid point to the region and return associated values for climate variables of interest.
A visual demonstration of this procedure is outlined in Figure 6.
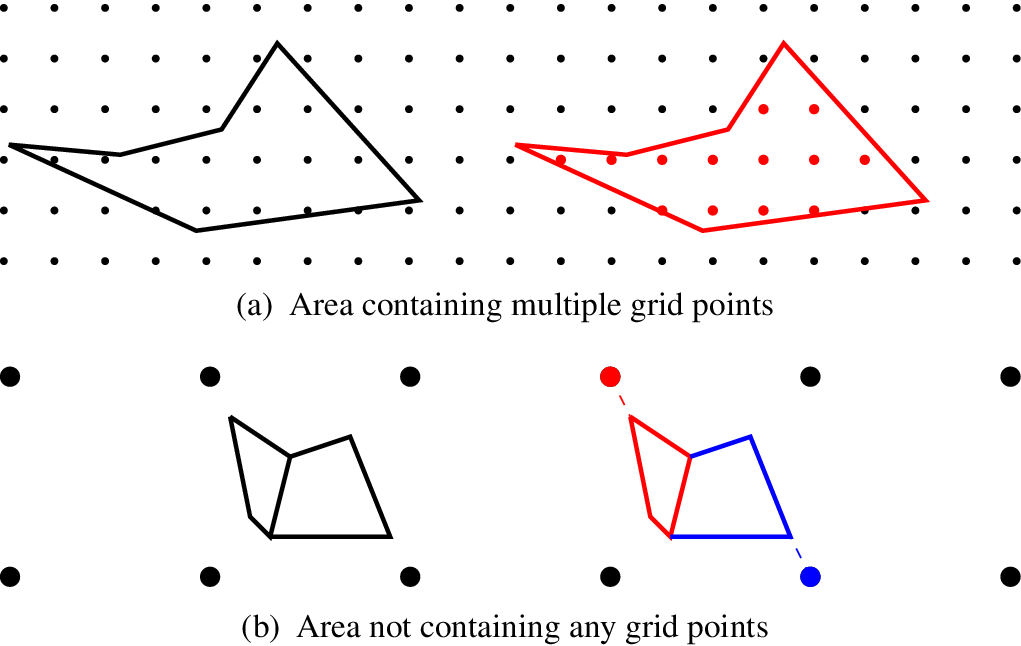
Figure 6. Demonstration of grid points associated to an example output area in the case that (a) the area contains multiple grid points, and (b) the area does not contain a single grid point.
In this work, we use the mean, minimum, and maximum temperature variables, however, other variables may be appended in the future using the same procedure. A flowchart detailing the HadUK-Grid climate input agent is shown in Figure 7.
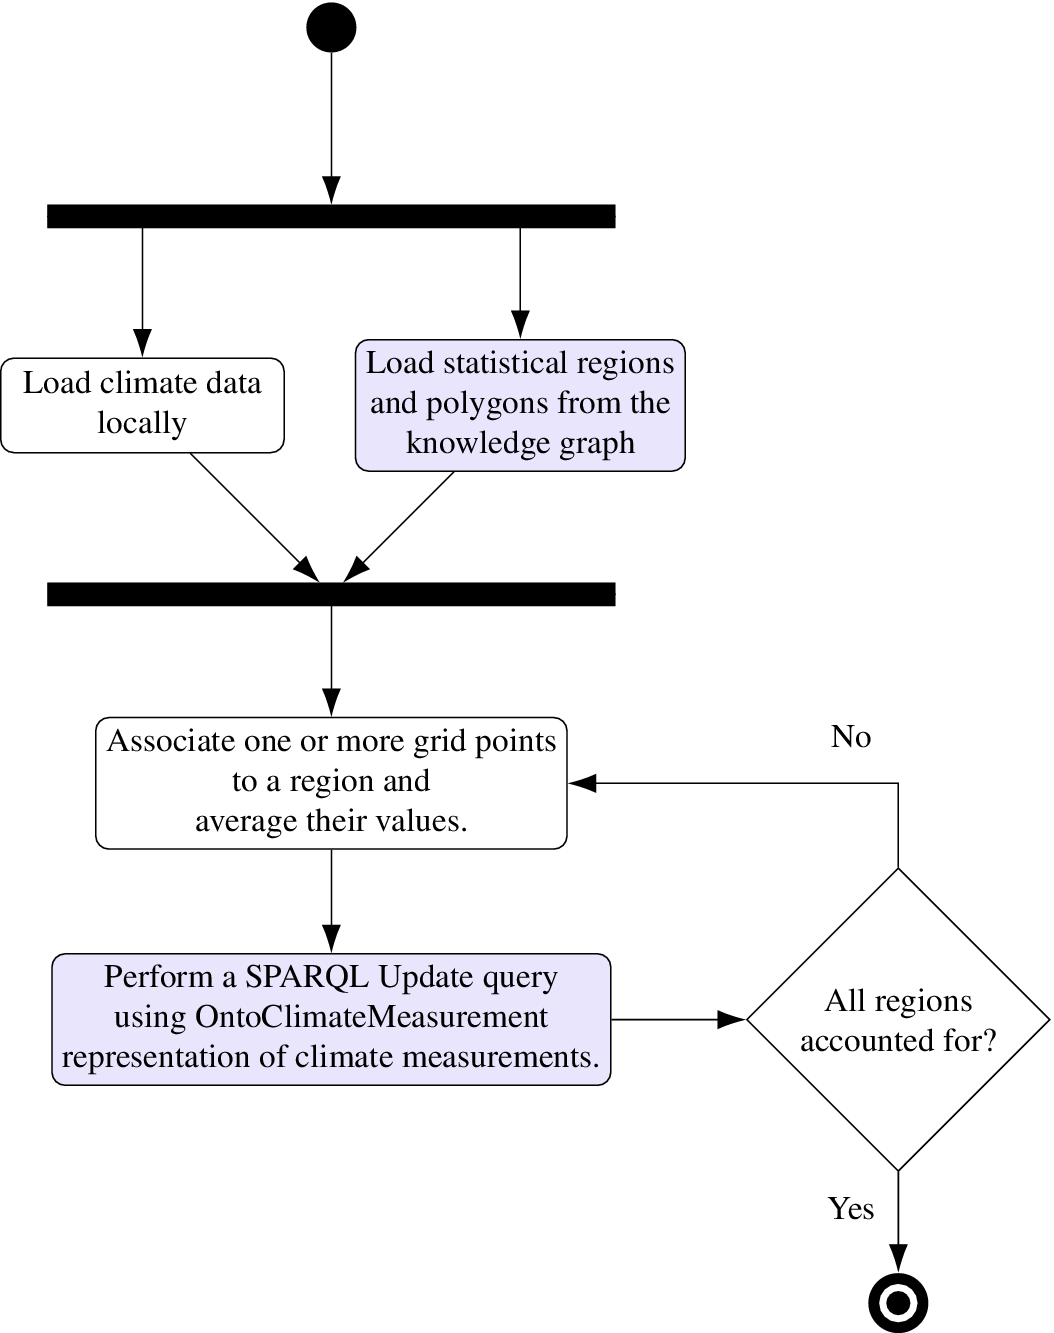
Figure 7. UML (Unified Modeling Language) diagram describing how information from the HadUK-Grid climate data set (Met Office et al., Reference Hollis, McCarthy, Kendon, Legg and Simpson2018) is instantiated in the knowledge graph using a computational agent that associates discrete grid points with statistical regions. Purple shading indicates actions that interact with the knowledge graph.
The reason we take this approach as opposed to representing grid points themselves is as follows: geospatial reasoning within knowledge graphs (for example queries such as “which grid points lie within this region?”) is not fully implemented across triple-stores. Standards such as geoSPARQL (Perry et al., Reference Perry, Herring, Car, Homburg and J.D. Cox2021) in theory allow for geospatial queries to be performed however currently the standard is not fully adopted. Jovanovik et al. (Reference Jovanovik, Homburg and Spasić2021) performs a GeoSPARQL benchmark across the most commonly used triple-stores, concluding that the GeoSPARQL standard, almost 9 years after its initial release, is often only partially supported by major triple-stores (Jovanovik et al., Reference Jovanovik, Homburg and Spasić2021). For this reason, inferring links between the discrete climate grid points and statistical regions becomes temperamental and dependent on the specific choice of triple-store. There is also the argument that specialized databases such as triple-stores are not in-fact the appropriate location to perform geospatial reasoning such as standard set operations, for example finding the union of two regions, the closest discrete point to a region, and so forth (Gillies, Reference Gillies2007).
Geospatial calculations within the agent such as the identification of discrete points within regional polygons were performed by loading well-known text (WKT) representations of regions stored directly within the knowledge graph into the Shapely Python library (Gillies, Reference Gillies2007). The agent operates using Python 3.7.9. An example upload query produced by the agent is demonstrated graphically in Figure 8.
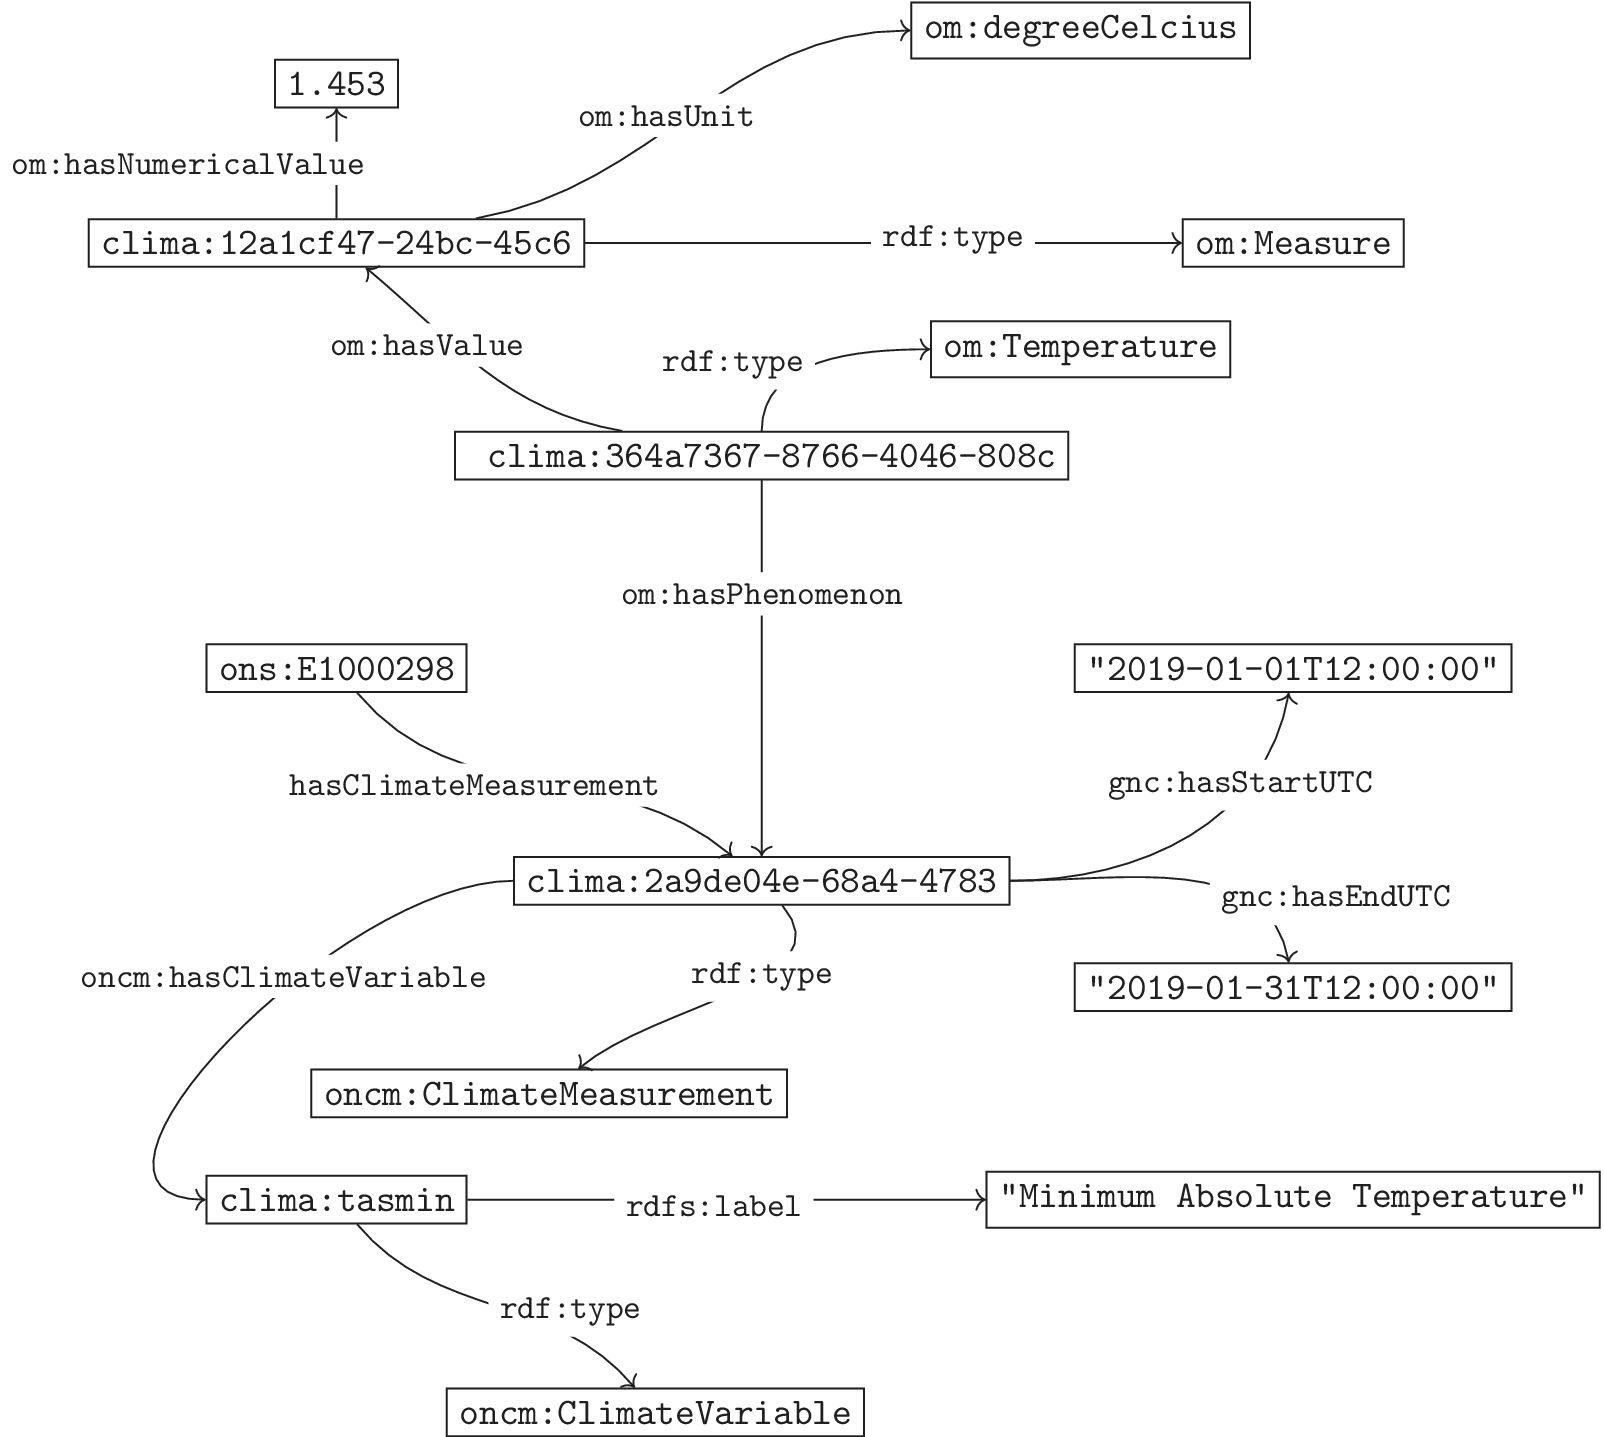
Figure 8. An example set of triples produced by the agent responsible for the addition of HadUK Grid climate measurements to the knowledge graph. Specifically the set of triples describes a single climate variable, minimum absolute temperature, for a single statistical region, E1000298, within the month of January 2019.
4.2. Instantiation of gas consumption statistics
An input agent was created to represent subnational domestic gas consumption statistics within the knowledge graph based on the respective data provided by the Department for Business, Energy & Industrial Strategy (United Kingdom) (2020). The data are reported as annual statistics and are published in the form of a spreadsheet. In an ideal world this data would be published as linked data, subverting many of the issues discussed in the introduction. However, here we make the conversion to linked data to facilitate addition to the knowledge graph. The agent links to existing instances of output areas and associates respective gas consumption values using vocabulary from OntoGasGrid and the Ontology of Units of Measure (Rijgersberg et al., Reference Rijgersberg, van Assem and Top2013).
The agent constructs an additional seven triples for each of the LSOA annual gas usage measurements, and an additional five triples to represent the number of consuming and nonconsuming gas meters per LSOA region (not presented above). The agent is therefore responsible for the addition of 482,544 triples to the knowledge graph for each annual data set.
4.3. Climate and gas consumption visualization agent
An output agent was created to query information from the knowledge graph and render into a human-usable form that is, a visualization. Figure 9 shows example output from this agent for March 2019.
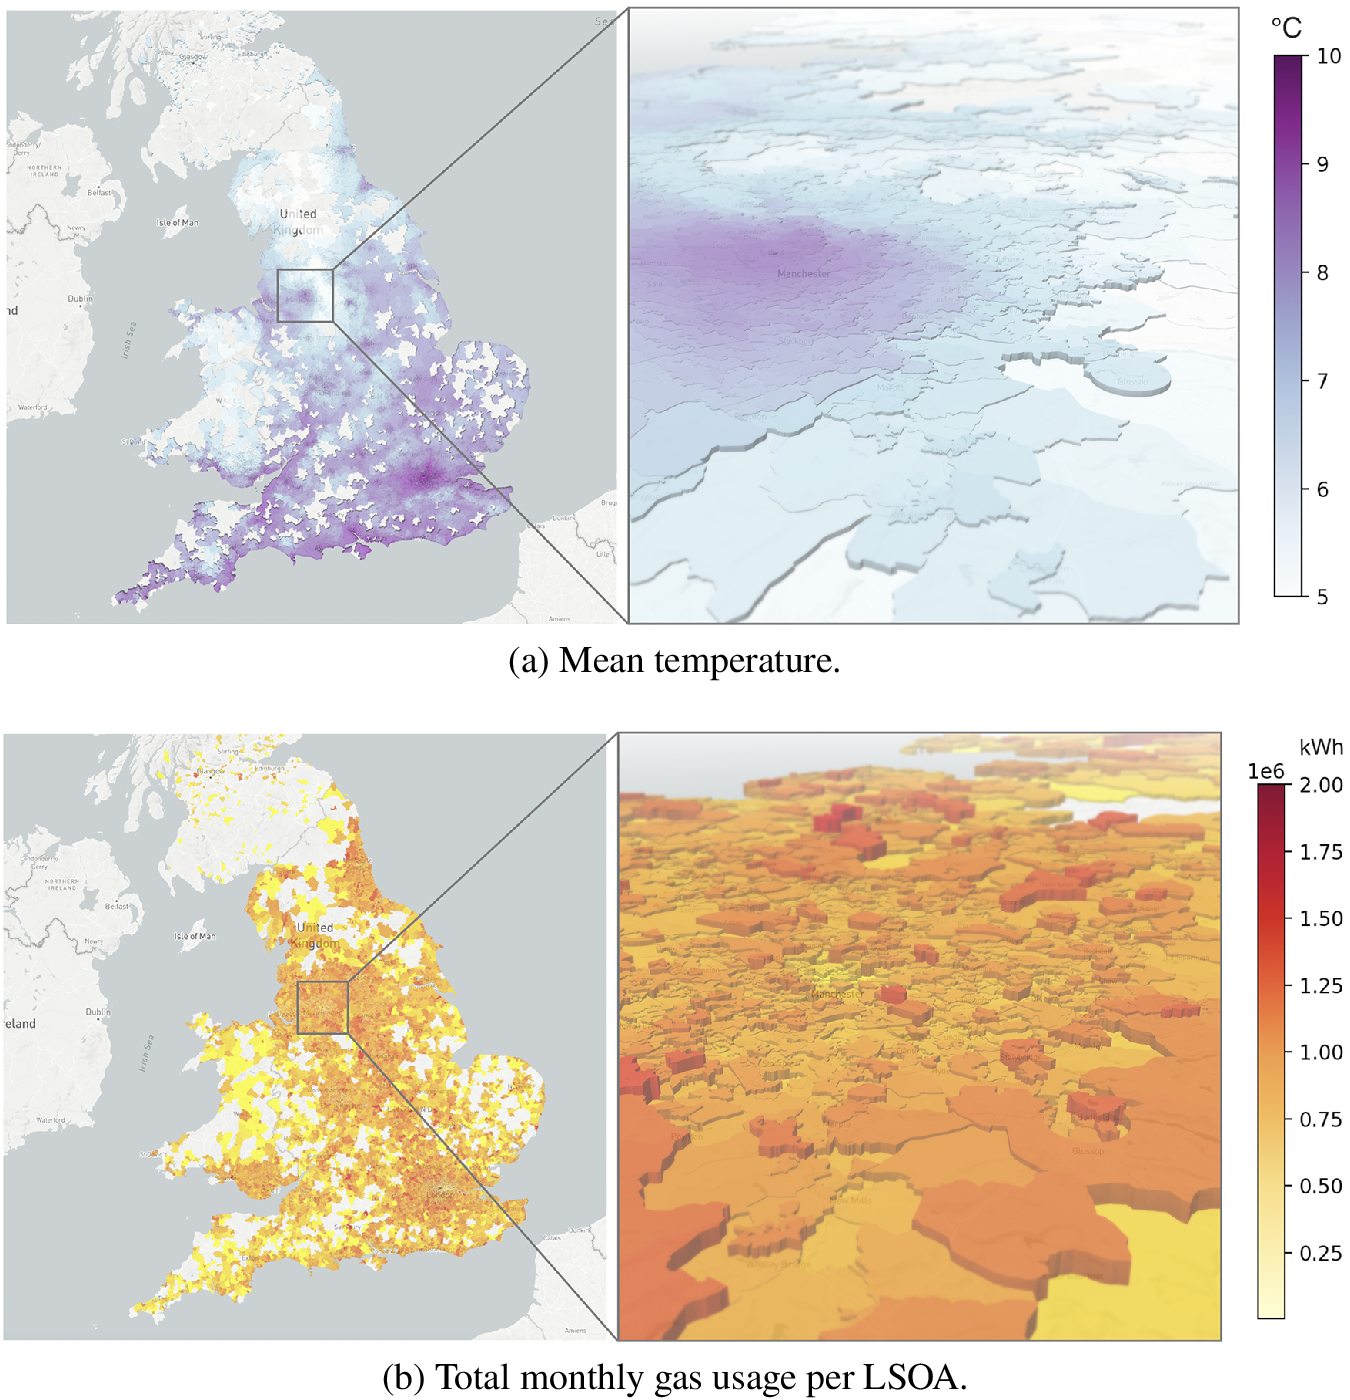
Figure 9. Example geospatial data from the knowledge graph showing mean temperature and gas consumption for March 2019, both displayed in the statistical regions defined by the Office of National Statistics (2019a). The data is queried by an output agent. The resulting geoJSON is displayed in Mapbox.
The agent interacts via a series of SPARQL queries, with WKT representations of output areas returned from the knowledge graph and subsequently parsed into geoJSON files containing values for mean temperature and gas consumption. These geoJSON files are in turn visualized using Mapbox (2021) enabling interactive output directly from the knowledge graph.
4.4. Instantiation of UK gas transmission system
An input agent was created to instantiate the UK gas transmission system within the knowledge graph. The agent parses the grid pipeline shapefile published by the National Grid (2021c), containing information such as pipe locations and respective diameters. Instances of pipe segments belonging to individual pipelines were created using the vocabulary defined in OntoGasGrid (Section 3.1.1).
A separate input agent was created to generate instances of GridComponent to describe infrastructure such as local distribution offtakes, power stations, and industrial users from information in National Grid (2014). The agent updates the knowledge graph by linking each new GridComponent to the closet instance of GasPipeConnection to express how these are connected, based on the assumption that this sufficiently approximates the physical connection. The isConnectedToPipeline property then provides a semantic link between these previously disjoint information. Below are example triples from the knowledge graph containing geospatial information, along with the connecting triple derived from these locations.
 $$ {\displaystyle \begin{array}{l}<\hskip-0.35em \mathtt{gnsa}:\mathtt{AberdeenToKirriemuirone}\mathtt{855}\mathtt{Connection},\mathtt{bd}:\mathtt{lat}-\mathtt{lon},\hbox{'}\hbox{'}\mathtt{56.7349838}\#-\mathtt{2.72631608}\mathtt{1}\hbox{'}\hbox{'}\hskip34.65em >\\ {}\hskip8.5em <\hskip-0.35em \mathtt{oga}:\mathtt{Careston,}\mathtt{bd}:\mathtt{lat}-\mathtt{lon},\hbox{'}\hbox{'}\mathtt{56.73503023}\#\hskip1em -\hskip2px \mathtt{2.72651943}\mathtt{6}\hbox{'}\hbox{'}\hskip-0.15em >\\ {}<\hskip-0.35em \mathtt{oga}:\mathtt{Careston,}\mathtt{gnc}:\mathtt{isConnectedToPipeline,}\ \mathtt{gnsa}:\mathtt{AberdeenToKirriemuirone}\mathtt{855}\mathtt{Connection}\hskip-0.35em >\end{array}} $$
4.5. Dynamic addition of live data feeds
An input agent was created in order to include dynamic data within the knowledge graph. The agent acts autonomously. The agent receives public information regarding instantaneous flow rates into the NTS and which is parsed into triples associated to instances of each gas terminal. A graphical example of triples generated by the agents is seen in Figure 10.
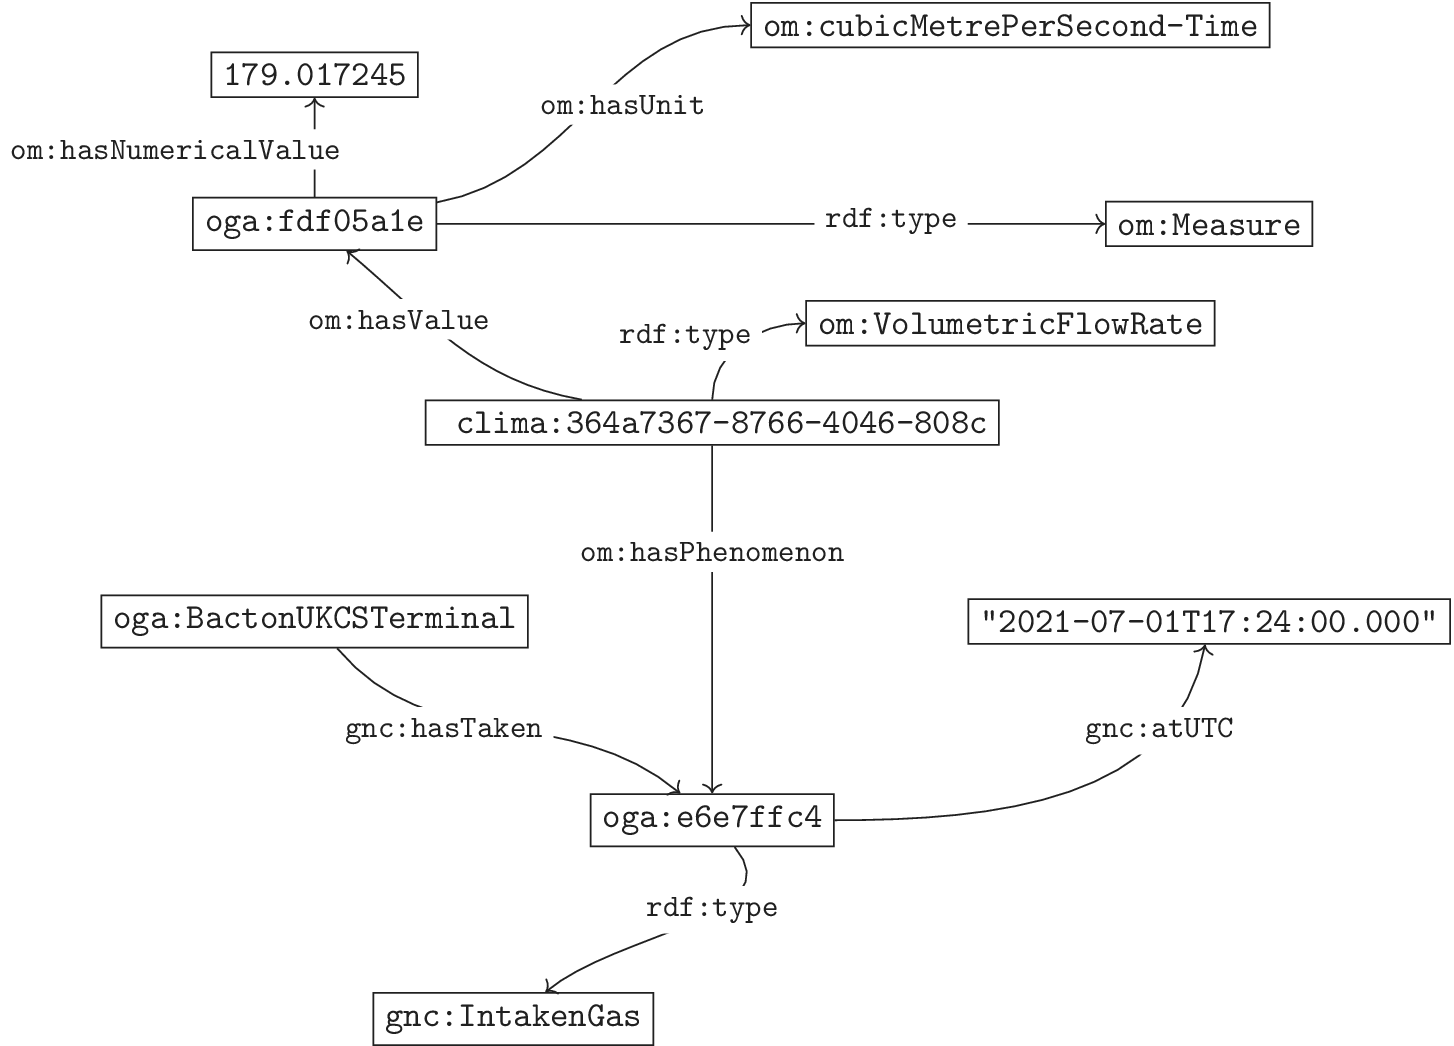
Figure 10. Representation of instantaneous flow rates as linked data applying the ontology of units of measure. Here the instance of Bacton UKCS gas terminal is instantiated with the triples describing an instantaneous flow rate of $ 179\;{m}^3/ s $
at 2021-07-01 T17:24:00 UTC, a value taken from the National Grid website by an input agent.
$ 179\;{m}^3/ s $
at 2021-07-01 T17:24:00 UTC, a value taken from the National Grid website by an input agent.
The values of the intake gas associated with a single instance of time and gas terminal are expressed in cubic meters per second using the Ontology of Units of Measure (Rijgersberg et al., Reference Rijgersberg, van Assem and Top2013) having been converted from published units of million-cubic meters per day. The agent is responsible for the addition of nine additional triples for each rate measurement for each gas terminal. The flow rate data are published at 2-min intervals (see Table 1), resulting in the addition of 2,430 triples per hour to the knowledge graph.
The flow rate, consumption and climate data have very different time scales. The time scales are determined by the frequency and resolution with which the data is published. The intake flow rates are reported every 2 min National Grid (2021b), whereas the consumption data (Department for Business, Energy, and Industrial Strategy (United Kingdom), 2020) report annual statistics and the HadUK-Grid data (Perry and Hollis, Reference Perry and Hollis2005; Met Office et al., Reference Hollis, McCarthy, Kendon, Legg and Simpson2018) reports report monthly observations, but is updated annually. The dynamic knowledge graph accommodates data feeds with all these frequencies, and would naturally extend to include feeds for other data, for example instantaneous consumption data from smart meters and temperature data from weather sensors. The availability of such data (or disaggregated monthly/annual data) would open up the possibility of estimating the instantaneous flow rate out of the grid and the corresponding effect on the line pack (i.e., the quantity of gas stored in the gas grid by pressuring the transmission system). The possibility of accessing such data should be considered in the future.
4.6. UK gas grid visualization
Three output agents were created in order to visualize the UK gas transmission system and connected infrastructure, as previously instantiated within the knowledge graph. These three agents perform SPARQL queries for the location and property relations of pipelines, offtakes, and gas terminals, respectively.
Query 1 demonstrates the SPARQL query used to return information about all local distribution offtakes. A subset of the results of this query are presented in Table 2.
Table 2. Output from Query 1.
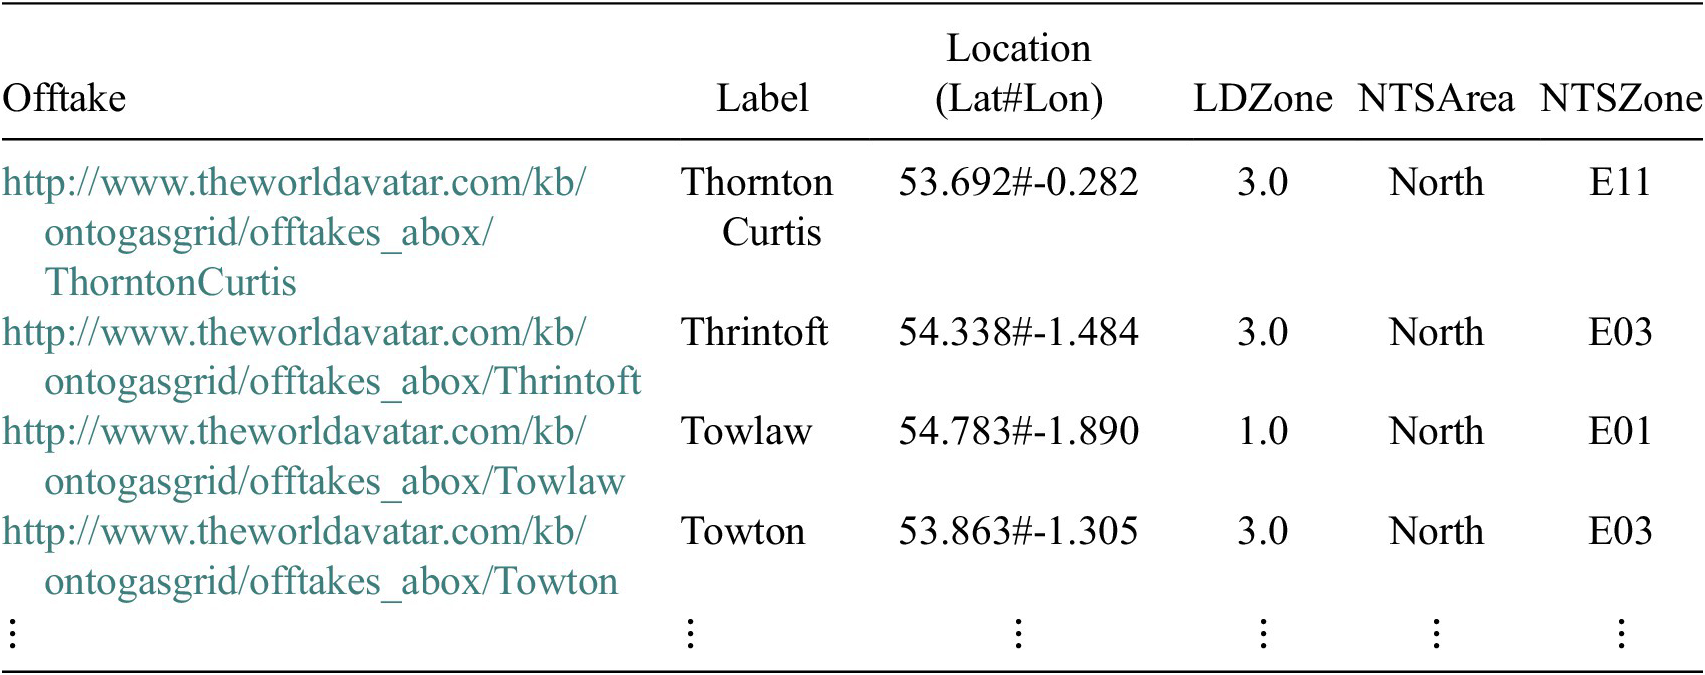
Note: This is subsequently encoded within a geoJSON file for interactive visualization.
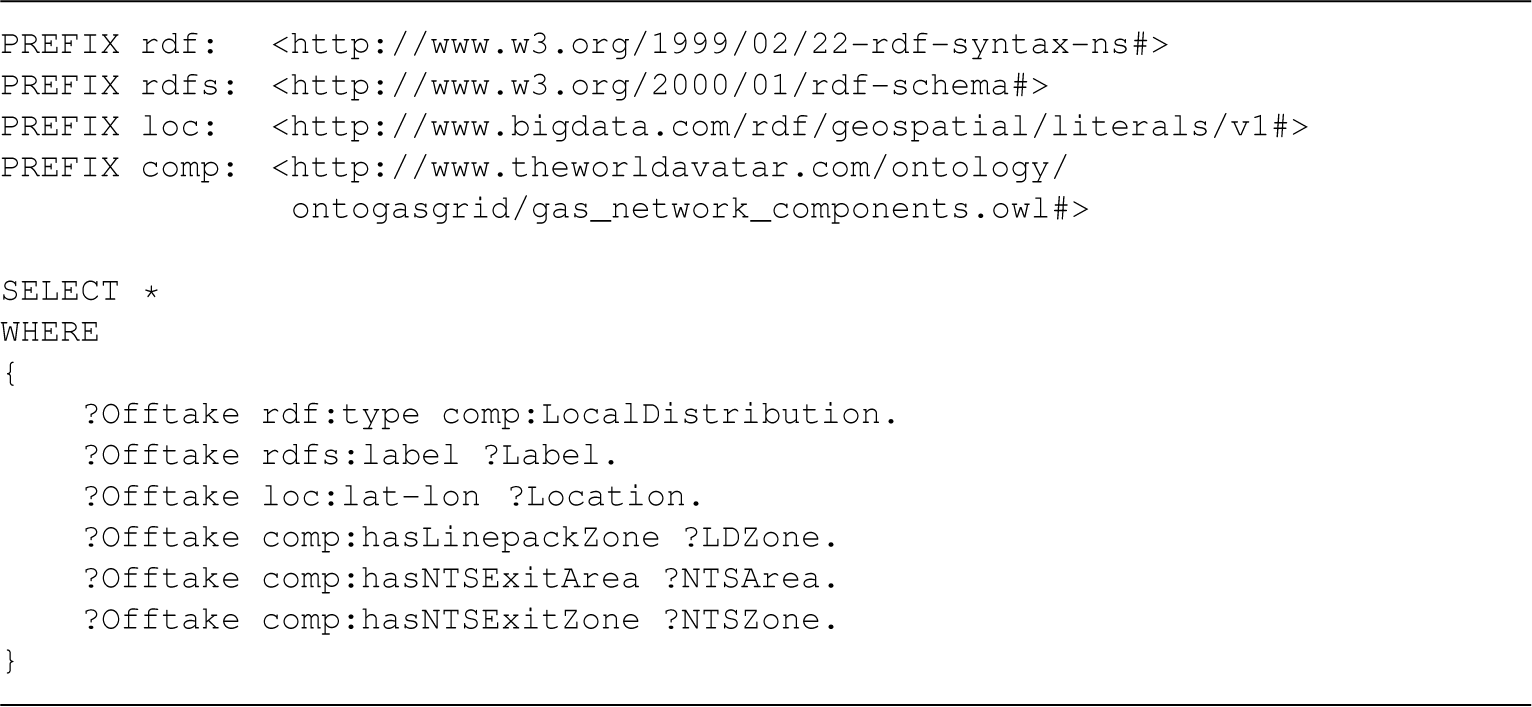
Query 1. SPARQL query to obtain local distribution offtakes and associated information.
The information from these queries is then reconstructed as a geoJSON (Butler et al., Reference Butler, Daly, Doyle, Gillies, Schaub and Schaub2016) file that is visualized using Mapbox (2021) as shown in Figure 11. The creation of geoJSON files based on the knowledge graph representation of the gas grid can be performed periodically by these agents, should any information be updated within the knowledge graph (e.g., decommissioned pipelines or the publication of a new shapefile). An additional agent was created to query the last 24 hr of instantaneous flow data associated with each gas terminal, which in turn is provided to the visualization as demonstrated in Figure 12.
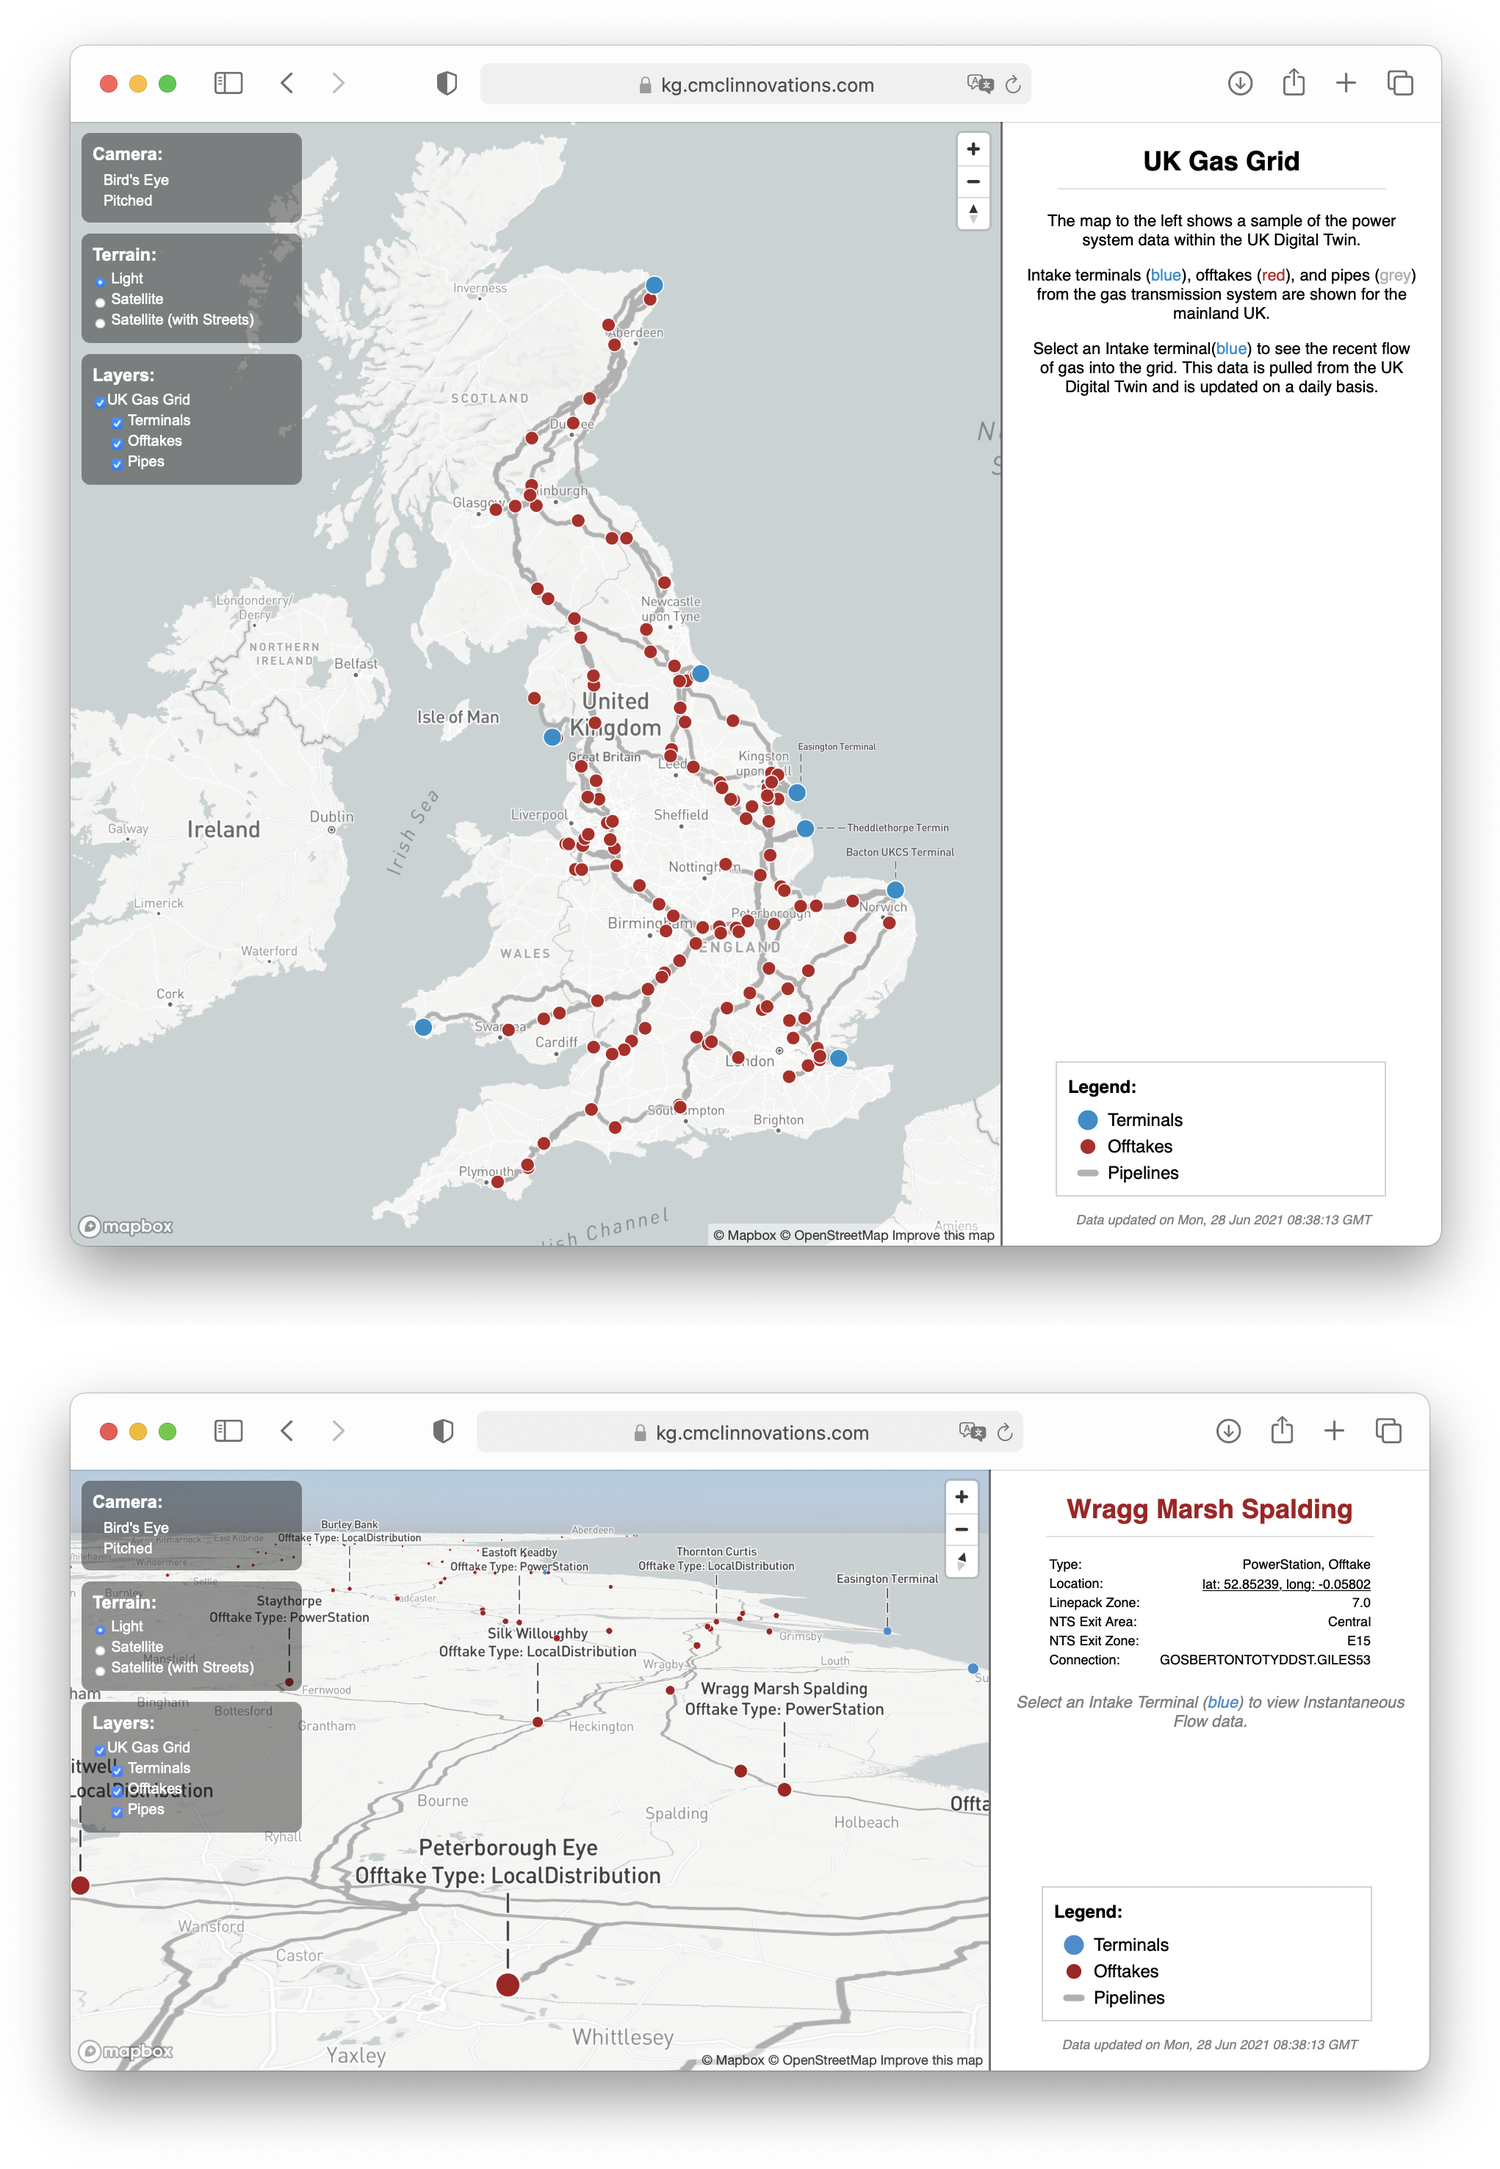
Figure 11. Web-based interactive visualization of the UK gas transmission system produced by agents operating on the knowledge graph. The panel on the right displays information about selected instances of physical infrastructure.
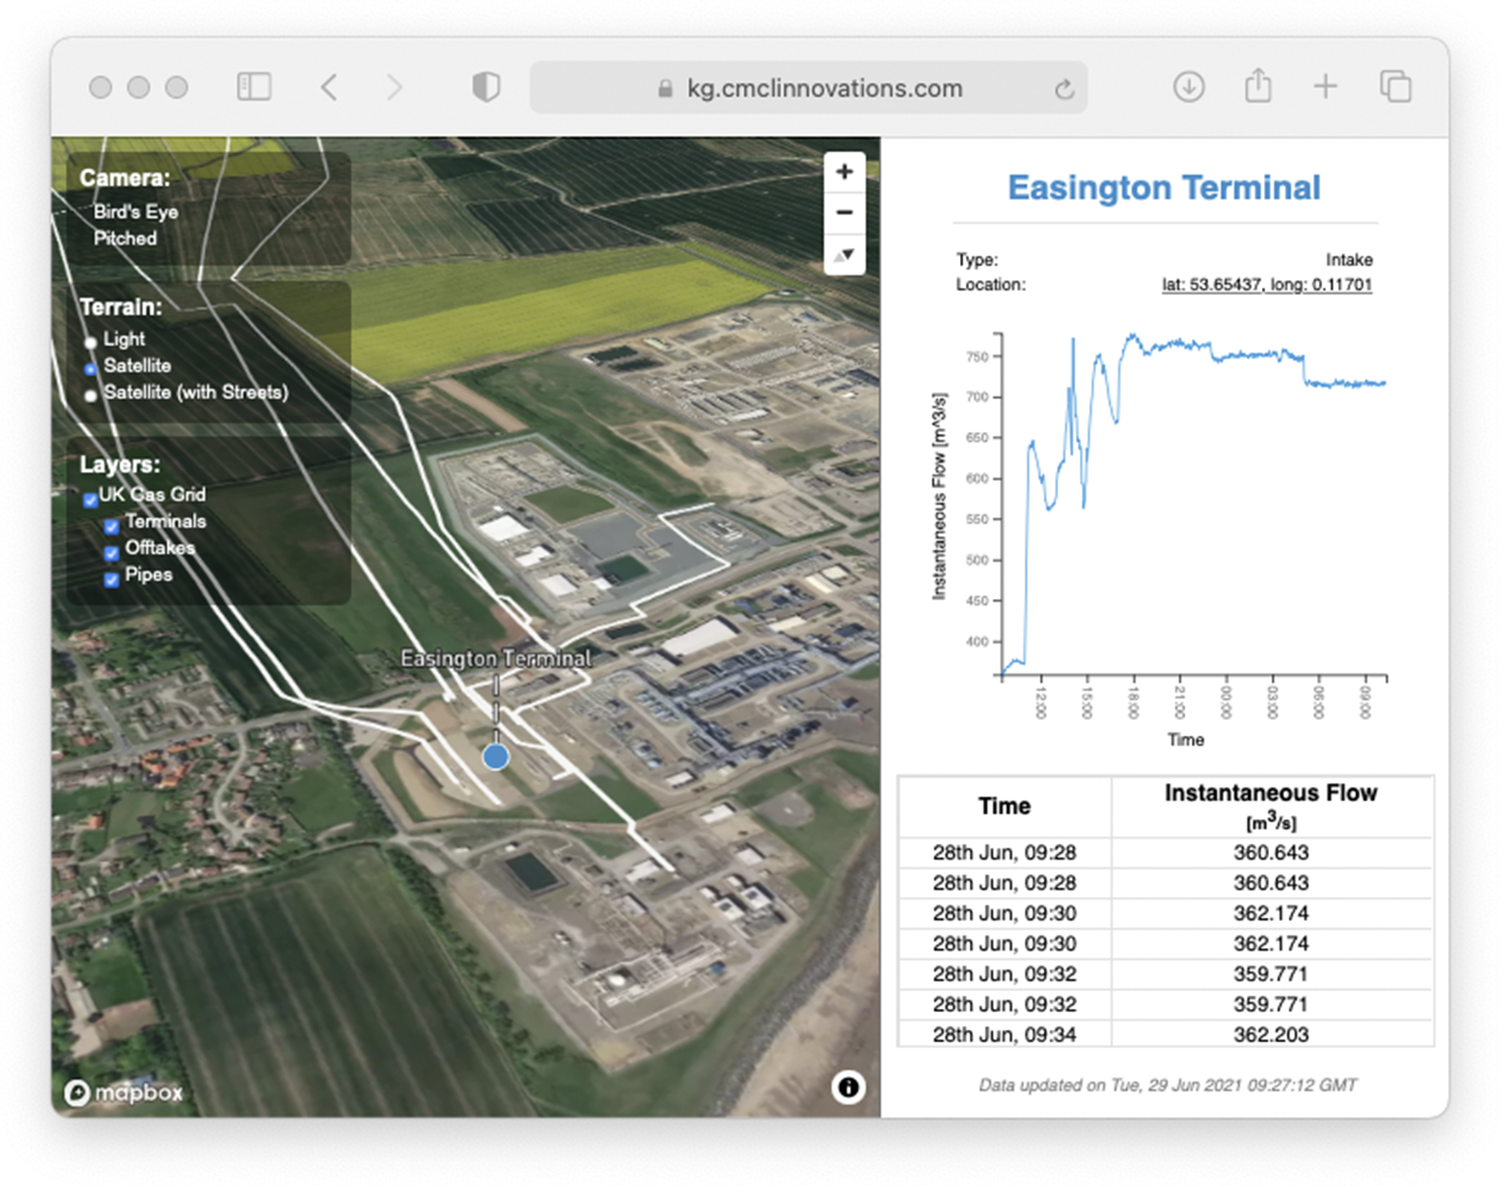
Figure 12. Instantaneous gas flow rates are added to the knowledge graph by an input agent. The data are assigned to the corresponding instances of physical gas terminals and queried from the knowledge graph by output agents. Located at https://kg.cmclinnovations.com/explore/digital-twin/gas-grid.
4.7. Flood risk
The dynamic knowledge graph approach and information models demonstrated in this article provide a uniform method both to query and share distributed (i.e., held on different computer systems and published by different entities) heterogeneous spatial and temporal data from different technical domains. The value of data sharing across sector boundaries has been recognized in the UK (National Infrastructure Commission, 2017) with the creation of a National Digital Twin programme (Centre for Digital Built Britain, 2018). The vision of the programme is to develop the digital infrastructure required for stakeholders to create a large-scale National Digital Twin that enables a data-centric approach to managing the built and natural environments. The envisaged benefit lies in the use of a data-centric approach to support better decision making.
Figure 13 shows one example of a cross-domain analysis that could be supported by such a large-scale digital twin. The figure shows data from the Flood Map for Planning (Rivers and Sea) published by the Environment Agency (2021) in the UK. The data is designed to support flood risk assessments and provide the best estimate of land areas that have 1 in 100 (1%) or greater chance of flooding each year from rivers, or a 1 in 200 (0.5%) or greater chance of flooding each year from the sea in the absence of flood defenses.
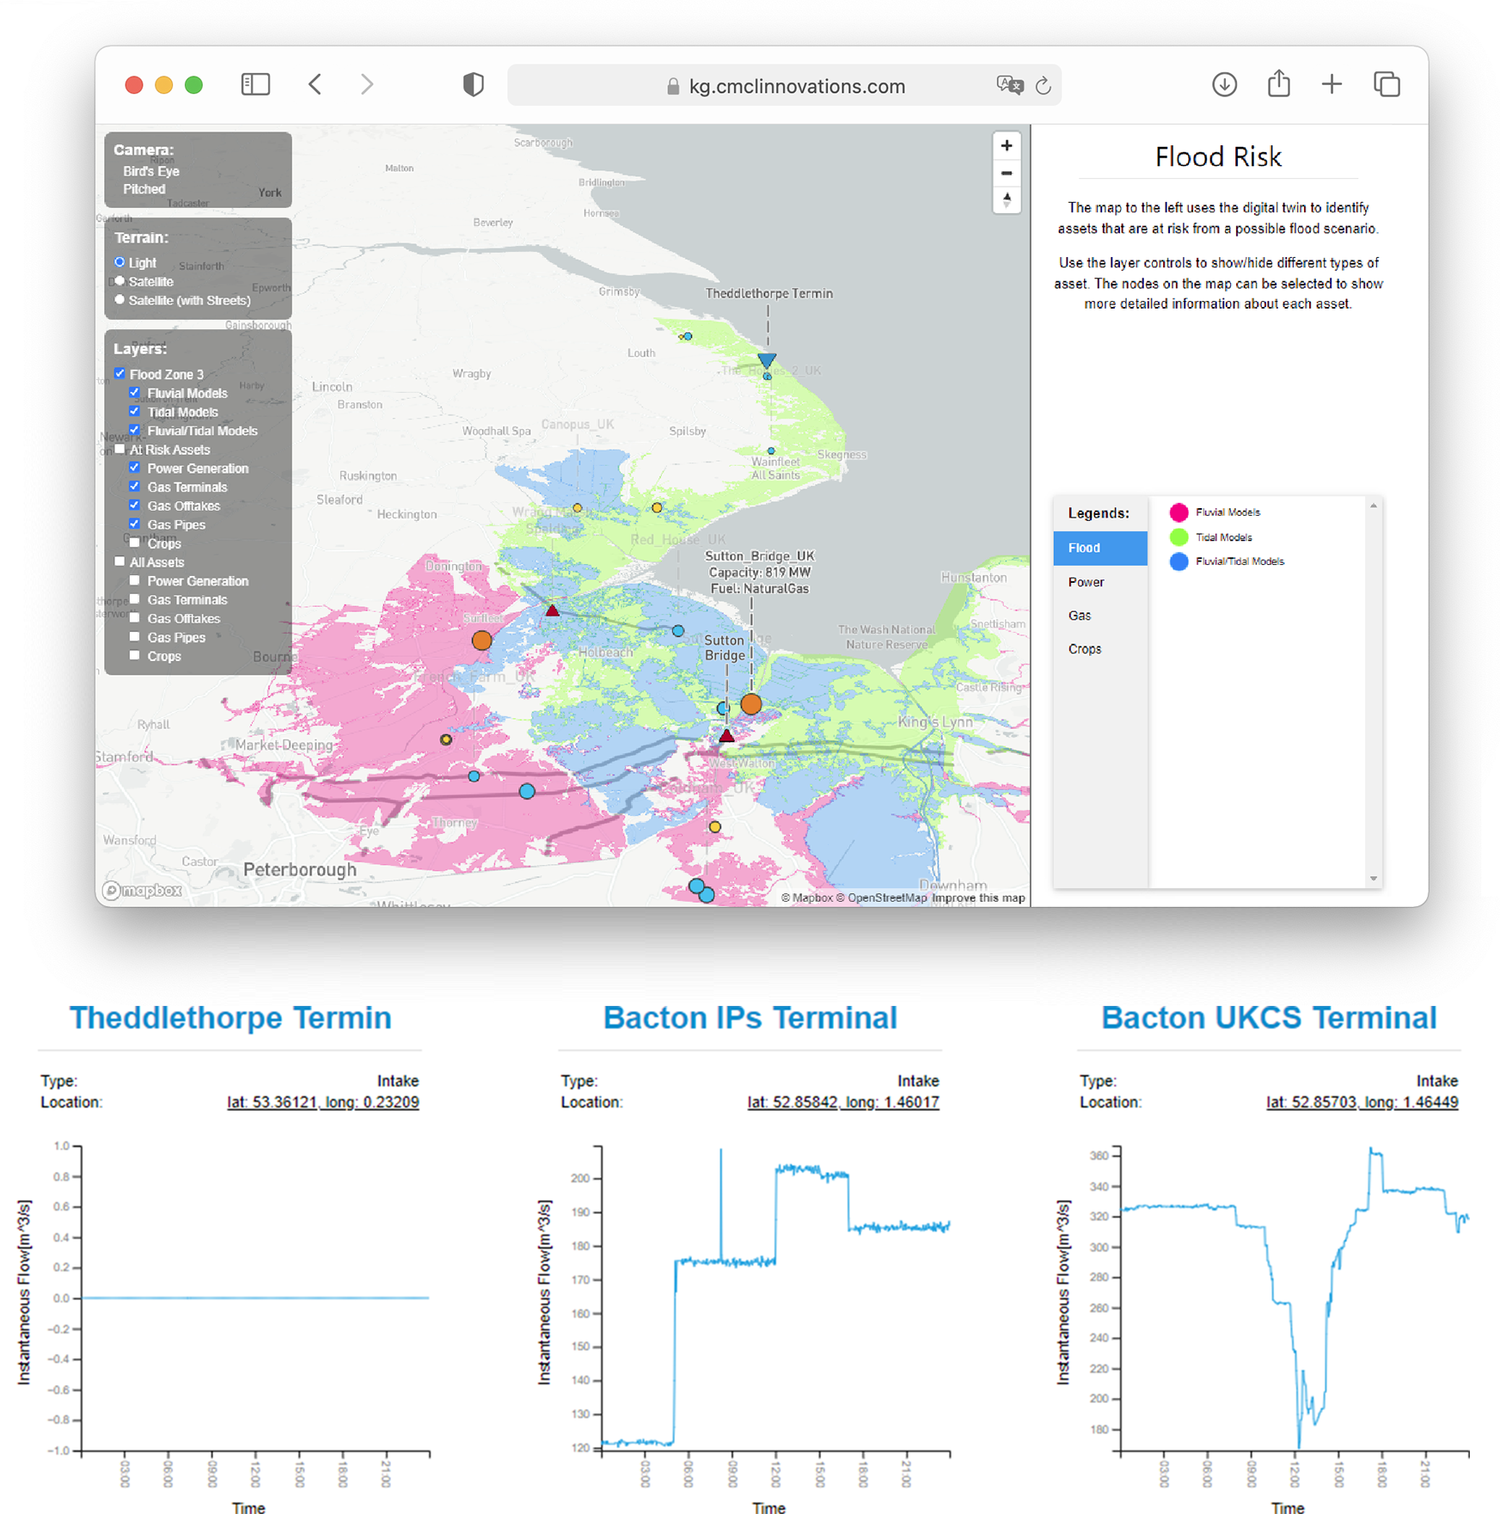
Figure 13. Assets at risk from flooding in the vicinity of King’s Lynn, UK. The flood region is based on the Flood Map for Planning (Rivers and Sea)—Flood Zone 3 (Environment Agency, 2021), which is the best estimate of land that in the absence of flood defenses has more than a 1 in 100 (1%) of flooding each year from rivers (a fluvial flood) or more than a 1 in 200 (0.5%) or greater chance of flooding each year from the sea (a tidal flood). Located at https://kg.cmclinnovations.com/explore/digital-twin/flood-risk. Flood Zone data: Environment Agency copyright and/or database right 2018. All rights reserved. Crown copyright and database rights 2018 Ordnance Survey 100,024,198.
The figure is overlaid by gas pipes, intakes and offtakes, and power generation assets (described previously, see Atherton et al. (Reference Atherton, Xie, Aditya, Zhou, Karmakar, Akroyd, Mosbach, Lim and Kraft2021) queried from the knowledge graph. It is straightforward to use spatial analysis to identify the assets within the flood zone. It is apparent that both the Teddlethorpe gas intake terminal and the offtake from the gas transmission system that supplies the Sutton Bridge power station are within the flood zone. Further queries (bottom row of Figure 13) show that there is currently no intake of has via the Teddlethorpe terminal. Rather, the closest gas intake is via the Bacton terminals to the east (see also Figure 11), so the availability of gas would probably be unaffected by a flood. The next questions to ask are, what is the vulnerability of the offtake at Sutton Bridge and Sutton Bridge power station to a flood? What critical infrastructure would be affected? What could be done to increase resilience? And how would this resilience stand up in the face of different climate scenarios?
The development of a large-scale digital twin that uses data from across sector boundaries to answer these types of cross-domain questions will provide an important tool to support data-centric analysis to enable people and organizations to make better decisions. The ontologies described in this article contribute to the ability to integrate climate data, distributed utility infrastructure and utility consumption data, including both historic and (near) real-time data feeds into such a tool. Although a degree of initial data processing is required, the point is that this only needs to be performed at the point of first upload. Once this has been done, anyone querying the tool can use the data without the need to repeat the processing. In the case of decarbonization, the availability of this data in such a tool could contribute to understanding and analyzing patterns in energy demand, and evaluating options for how to meet that demand whilst minimizing carbon emissions and providing sufficient resilience.
5. Conclusions
In this work, we have extended the World Avatar to describe gas supply systems and climate data, and have demonstrated how this data could be used as part of a national-scale digital twin to support data-centric analysis and to enable people and organizations to make better decisions.
Two new ontologies were created in order to represent these systems semantically. OntoGasGrid defines the vocabulary and respective relations to represent gas transmission systems and associated infrastructure. OntoClimateMeasurements allows for the representation of links between the existing concept of the output areas specified by the ONS, with new concepts to represent climate values.
The ontologies were used to extend the World Avatar dynamic knowledge graph to include data describing the UK gas transmission system, gas consumption statistics, real-time instantaneous intake of gas, in addition to data derived from the HadUK-Grid climate data set (Hollis et al., Reference Hollis, McCarthy, Kendon, Legg and Simpson2019). The extended knowledge graph includes links between the data and the geospatial output areas used by the ONS to report governmental data throughout the UK, for the first time formally linking these regions to the HadUK-Grid climate data.
A series of input agents were developed to incorporate data into the dynamic knowledge graph such that it remains current in time. The agents demonstrate both the addition of static data describing the physical infrastructure of the gas transmissions system, and the addition of live feeds of real-time data describing the intake of gas into the transmission system. Output agents were created to allow visualization of geospatial and temporal information queried from the knowledge graph.
The architecture of the World Avatar has been suggested to provide a suitable architecture for implementing a Universal Digital Twin (Akroyd et al., Reference Akroyd, Mosbach, Bhave and Kraft2021b). This article demonstrates the universality of the approach both in terms of the range of geospatial and temporal data that can be semantically represented and linked in the knowledge graph, and the ability of agents to incorporate new data, process the data and interact with the real-world. The ability of such a Universal Digital Twin to link previously disjoint geospatial and temporal data sets enables increased interpretability across domains, offering a means to simplify analyses that previously would have required a bespoke and time-consuming solution that may be prone to errors. Future work will demonstrate this in analyses of future energy scenarios that combine the HadUK-Grid climate data with administrative data including energy consumption and social indicators such as fuel poverty.
Nomenclature
- DL
-
description logic
- FAIR
-
findable, accessible, interoperable, reusable
- IRI
-
internationalized resource identifier
- JSON
-
javascript object notation
- LSOA
-
local super output area
- netCDF
-
network common data form
- NTS
-
national transmission system
- ONS
-
Office for National Statistics
- WKT
-
well-known text
- gnc
-
http://www.theworldavatar.com/ontology/ontogasgrid/gas_network_components.owl#
- gns
-
http://www.theworldavatar.com/ontology/ontogasgrid/gas_network_system.owl#
- gnsa
-
http://www.theworldavatar.com/kb/ontogasgrid/gas_network_system/
- gsp
- oga
- om
- oncm
-
http://www.theworldavatar.com/ontology/ontogasgrid/ontoclimate.owl#
- onsa
- onst
- pmd
Supplementary Materials
To view supplementary material for this article, please visit http://doi.org/10.1017/dce.2022.22.
Data Availability Statement
Research data supporting this publication is available in the University of Cambridge data repository (doi:10.17863/CAM.72550).
Author Contributions
Conceptualization: T.S., J.A., S.M., M.K.; Data curation: T.S., J.A., S.M.; Formal analysis: T.S., N.K., J.A., S.M.; Funding acquisition: T.S., J.A., S.M., M.K.; Investigation: T.S., J.A., S.M., M.K.; Methodology: T.S., M.H., N.K., J.A., S.M.; Project administration: J.A., S.M.; Resources: J.A., S.M.; Software: T.S., M.H., J.A., S.M.; Supervision: J.A., S.M., M.K.; Validation: T.S., J.A., S.M., M.K.; Visualization: T.S., M.H., J.A., S.M.; Writing—original draft: T.S., J.A.; Writing—review and editing: T.S., J.A., S.M., M.K.; All authors approved the final submitted draft.
Funding Statement
This research was supported by the National Research Foundation, Prime Minister’s Office, Singapore under its Campus for Research Excellence and Technological Enterprise (CREATE) programme. Part of this work was supported by Towards Turing 2.0 under EPSRC Grant EP/W037211/1 & The Alan Turing Institute.
Acknowledgments
T.S. gratefully acknowledges the support of the John Dudding Studentship awarded by Fitzwilliam College. M.K. gratefully acknowledges the support of the Alexander von Humboldt Foundation.
Competing Interests
The authors declare no competing interests exist.


 Open access
Comments
No Comments have been published for this article.