


Dairy products are sources of nutrients and bioactive compounds, which may reduce inflammation and oxidative stress, besides favouring glycaemic control and body weight loss( Reference Visioli and Strata 1 ). Low-fat dairy products are an excellent source of protein, Ca, Zn, P, Mg and vitamin D( Reference Dugan and Fernandez 2 ). Milk proteins, particularly whey protein, seem to have insulinotrophic, hypolipidaemic, anti-hypertensive and anti-inflammatory properties( Reference Dugan and Fernandez 2 ). Increased Ca consumption has been associated with beneficial effects on body weight( Reference Jacobsen, Lorenzen and Toubro 3 ), blood pressure (BP)( Reference Wang, Manson and Buring 4 ) and type 2 diabetes mellitus (T2DM)( Reference Tong, Dong and Wu 5 ). Other micronutrients of dairy products, such as vitamin D, Zn, P and Mg, are associated with lower T2DM and CVD risk( Reference Dugan and Fernandez 2 ).
Large studies, such as the Multi-Ethnic Study of Atherosclerosis, have shown inverse associations between low-fat dairy consumption and inflammation and oxidative stress biomarker concentrations, which play major roles in the onset and development of the metabolic syndrome (MetS) and its components( Reference Nettleton, Steffen and Mayer-Davis 6 ). Increased dairy consumption has also been associated with lower incidence of the MetS and T2DM( Reference Visioli and Strata 1 ). Dairy products seem to modulate some cardiovascular risk factors (e.g. insulin response, dyslipidaemia, oxidative stress and inflammation markers, BP and so on), but the association between dairy consumption and CVD is controversial( Reference Visioli and Strata 1 , Reference Alexander, Bylsma and Vargas 7 ). Apparently, the consumption of energy-restricted diets containing low-fat dairy products seems be more efficient in reducing body weight, body fat mass, waist circumference (WC) and BP compared with whole dairy and non-energy-restricted diets( Reference Abargouei, Janghorbani and Salehi-Marzijarani 8 , Reference Ralston, Lee and Truby 9 ).
In a review study involving data from randomised clinical trials (RCT), Pasin & Comerford( Reference Pasin and Comerford 10 ) concluded that dairy foods might improve glycaemic status in adults with T2DM. However, these results were observed in acute studies or in long-term studies that used probiotic yogurt for the intervention group( Reference Pasin and Comerford 10 ). The microorganisms present in yogurt can improve systemic disorders, such as T2DM, dyslipidaemia, inflammation and oxidative stress( Reference Pasin and Comerford 10 ). Therefore, the effects of other dairy products (i.e. milk) on metabolic profile of T2DM adults need to be better explored.
Although previous studies have investigated the effect of dairy products on body weight and glycaemic control( Reference Visioli and Strata 1 , Reference Pasin and Comerford 10 – Reference Torres and Sanjuliani 12 ), to the best of our knowledge no other RCT has assessed the effect of increased Ca consumption from fat-free milk associated with an energy-restricted diet on the MetS and cardiometabolic outcomes in adults with T2DM. Considering the relevance of dietary treatment on T2DM and the MetS, it is necessary to verify whether diets containing high Ca from fat-free milk have beneficial effects on these disorders. Therefore, this study aimed to investigate the effect of increased Ca consumption from fat-free milk in the context of an energy-restricted diet on MetS components and cardiometabolic measures in adults with T2DM.
Methods
This study was conducted according to the Declaration of Helsinki guidelines, and all procedures involving human participants were approved by the Committee of Ethics in Human Research of the Federal University of Viçosa/Brazil. Written informed consent was obtained from all subjects. The present trial was registered at www.clinicaltrials.gov (ID no. NCT02377076).
Participants
Study participants were recruited through public advertisements in the town of Viçosa, Minas Gerais, Brazil. Recruitment was initiated on 2 February 2014, and ended on 3 June 2015, when the required number of subjects for the study was obtained. Eligible subjects were adults of both genders with T2DM treated with only diet or with diet plus oral hypoglycaemic agents, who had the MetS( Reference Alberti, Eckel and Grundy 13 ), had low habitual Ca intake (<600 mg/d), were between 20 and 59 years of age, had a dietary restraint<14( Reference Strunkard and Messic 14 ), had light to moderate physical activity levels (PAL)( Reference Pardini, Matsudo and Araujo 15 ) and had T2DM for at least 1 year.
Exclusion criteria were the following: (1) smoking; (2) use of Ca, vitamin D, Zn or Mg supplements or medication that affects the metabolism of these micronutrients; (3) use of drugs (except hypoglycaemic drugs), herbs or diets for weight loss; (4) on hormone replacement therapy; (5) menopause or post menopause; (6) recent weight gain or loss (±5 kg) over the previous 3 months; (7) recent change in PAL over the previous three months; (8) aversion or intolerance to the shakes provided during the study; (9) alcohol consumption of more than 12 g/d for women and 24 g/d for men; (10) eating disorders; (11) endocrine (except T2DM and obesity), kidney or liver pathology; (12) Ca malabsorption; (13) history of recurrent nephrolithiasis; (14) history of gastric surgery or current gastric disease including gastroparesis; (15) consumption of more than 350 mg/d of caffeine; (16) pregnancy or lactation; (17) anaemia; and (18) changes in medication type or dosage during the study.
Study design
This is a randomised, cross-over clinical trial of two 12-week phases separated by a washout period of 8 weeks. Participants were initially randomly assigned by simple randomisation procedures (computerised random numbers) to high-Ca fat-free milk phase (MD) (equivalent to approximately 3 fat-free milk portions) or low-Ca control phase (CD) in a 1:1 ratio. Participants and data analysts were blinded. An energy-restricted diet (restriction of 2092 kJ/d (500 kcal/d)) containing 800 mg of dietary Ca/d was prescribed. Subjects daily consumed in the laboratory a breakfast shake containing 700 mg (MD) (equivalent to approximately three servings of fat-free milk) or 6·4 mg (CD) of Ca. All other meals were consumed in free-living condition in both phases. Participants were instructed to maintain constant PAL and medication use during the study.
PAL, nutrient and energy intake, MetS components (WC, fasting glucose, fasting TAG, HDL-cholesterol and BP)( Reference Strunkard and Messic 14 ), other cardiometabolic risk factors (total cholesterol, LDL-cholesterol, VLDL-cholesterol, insulin, HDL:LDL ratio, HDL:TAG ratio and lipid accumulation product (LAP) index)) and Ca homoeostasis markers (serum total Ca, P, Mg, parathormone (PTH) and 25-hydroxyvitamin D concentrations) were evaluated at baseline and after 12 weeks of each dietary phase (Fig. 1).
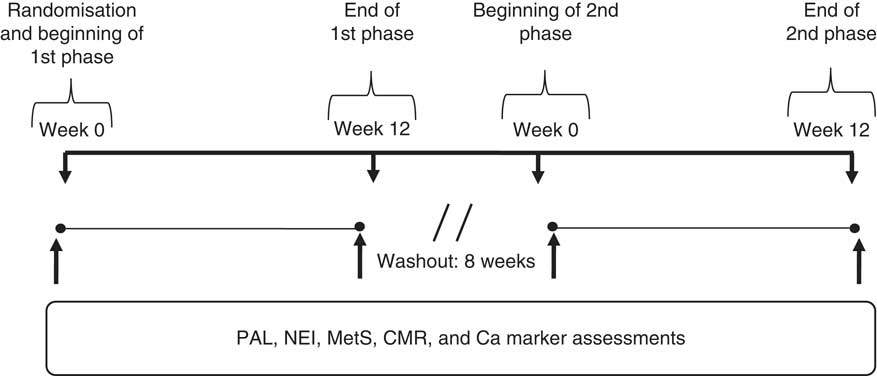
Fig. 1 Study design. Physical activity level (PAL), nutrient and energy intake (NEI), metabolic syndrome (MetS) components, cardiometabolic risk factors (CMR) and calcium homoeostasis markers (Ca markers) were assessed before and after each phase (fat-free milk and control phases) (n 14).
Physical activity assessment
PAL was assessed using the long-format International Physical Activity Questionnaire (IPAQ), version 6, validated for the Brazilian adult population( Reference Pardini, Matsudo and Araujo 15 ). The total amount of time spent in physical activity per week was estimated by the sum of each item (i.e. vigorous intensity, moderate intensity and walking) obtained from IPAQ. Total weekly physical activity (metabolic equivalents of task (MET)-min/week) was estimated by adding the products of reported time for each item by a MET value specific for each physical activity category. PAL were classified as follows: vigorous PAL=8·0 MET, moderate PAL=4·0 MET and walking=3·3 MET( Reference Pardini, Matsudo and Araujo 15 ). To verify possible changes in PAL, IPAQ was applied at baseline and at end of each phase (CD and MD).
Nutrient and energy intake
Habitual Ca consumption was assessed at baseline using a quantitative FFQ validated for assessing food intake of Brazilian adults with chronic diseases( Reference Ribeiro and Cardoso 16 ). Food intake at baseline and after 12 weeks of each experimental phase was assessed using 3 non-consecutive days (2 weekdays and a weekend day) food records. Participants were trained to keep free-feeding dietary records at baseline to increase data reliability. Each dietary record was reviewed with the participants to ensure accuracy and completeness. Moreover, a food portion photo album was used to improve data quality( Reference Monteiro, Pfrimer and Tremeschin 17 ). The amounts of foods registered in household measures were converted into appropriate units for energy intake, macronutrients, Ca, P, Mg, Zn and dietary fibre intake analyses using DietPro, version 5·1i (July 2015). A single dietitian analysed the food records. The revised Goldberg method was used to categorise misreported reported energy intake (rEI)( Reference Black 18 ). Participants were classified as under-reporters, acceptable reporters or over-reporters using the ratio of rEI to total energy expenditure (TEE). TEE was calculated from the product of BMR( 19 ) and PAL. PAL was assumed to be 1·55 (light activity) for all subjects( 19 ). A 95 % CI was calculated, and individuals who fall outside of the 95 % CI were classified as under- or over-reporters and were excluded from statistical analysis. In the present study, none was excluded for that reason.
Dietary intervention
Each participant’s daily energy requirement was based on the estimated energy requirement (EER)( Reference Trumbo, Schlicker and Yates 20 ). EER was calculated by using the dietary reference intake predictive equations developed by the Institute of Medicine( Reference Trumbo, Schlicker and Yates 20 ). In these equations, a physical activity coefficient was applied according to the subjects’ PAL. Then, 2092 kJ/d (500 kcal/d) was subtracted for dietary restriction. Diets were prescribed according to the American Diabetes Association nutrition recommendations( 21 ) and considering the nutritional composition of the breakfast shakes provided during the study. Nutrient composition was calculated by DietPro software or according to food labels. MD- and CD-prescribed diets presented similar contents of macronutrients, vitamin D, P, Mg, Zn and dietary fibre. MD-prescribed diet contained 1500 mg and CD had 800 mg of Ca/d. Participants were given meal patterns and one list discriminating the types of foods to help them in their food choices. The foods were grouped in that list considering their energy and Ca content. Participants received individualised nutritional counselling every 2 weeks to increase prescribed diet adherence. An experienced dietitian assessed eating patterns and habitual food intake, exercise and medication patterns. Nutrition counselling was provided to stimulate healthy eating habits, including adequate consumption of dietary fibre and water, besides avoiding alcohol consumption and so on, according to ADA recommendations( 21 ). Energy and nutrient requirements were adjusted according to the nutritional requirement of each subject right before the beginning of the second experimental phase. In the washout period, participants were told to maintain their normal diet, which was assessed through three non-consecutive days (two weekdays and a weekend day) food records.
Breakfast shakes
In all, twelve shake types (six for MD and six for CD experimental phase) were developed for consumption at breakfast. Shakes flavours (frozen fruit pulps or chocolate powder) were the same for both phases. They presented similar macronutrient, vitamin D, Na and dietary fibre contents (Table 1). Shakes were also visually very similar, ensuring participants remained unaware of phase differences and the purpose of the intervention. High-Ca shakes contained fat-free milk powder (Itambé® enriched with Fe, vitamins A, C and D and Ca) reconstituted in water (250 ml). To ensure similarity to high-Ca shakes, low-Ca shakes contained whey protein (BemVital®; Diacom), sucrose, sodium chloride (Cisne®) and a powder supplement containing Fe (iron chelate) and vitamins A (retinol acetate), C (ascorbic acid) and D3 (cholecalciferol). The powder supplement was prepared by a certified compounding pharmacy. Shakes were prepared by mixing all the ingredients in a blender right before ingestion. Breakfast shakes flavours were offered in random order, according to the study phase.
Table 1 Ingredients and nutrient composition of the breakfast meals according to study phasesFootnote † (Mean values and standard deviations)
MD, high-calcium fat-free milk diet; CD, low-calcium control diet.
*** P<0·001 by Student’s t test.
† Calculated by DietPro® software or according to food labels.
‡ Micronutrient powder supplement containing Fe (iron chelate) and vitamins A (retinol acetate), C (ascorbic acid), and D3 (cholecalciferol) prepared by a certified compounding pharmacy.
§ Shakes presented similar flavours (frozen fruit pulps or chocolate powder), total of six different flavours.
Subjects daily consumed a shake in the laboratory for 84 consecutive days (12 weeks) in each phase. In case any subject eventually could not come to the laboratory, the shake was consumed in their homes/ jobs. The powdered ingredients (Table 1) were weighed in plastic pots, and the frozen fruit pulps were provided separately. Subjects were instructed on how to blend all the ingredients (mixing powder, water and fruit pulp) used to prepare shakes immediately before ingestion.
Metabolic syndrome components and cardiometabolic measures
The MetS components assessed were WC, fasting glucose, fasting TAG HDL-cholesterol and BP, using the ‘harmonised’ version of the MetS( Reference Alberti, Eckel and Grundy 13 ). Other cardiometabolic risk factors assessed were total cholesterol, LDL-cholesterol, VLDL-cholesterol, insulin, HDL:LDL ratio, HDL:TAG ratio and LAP index. All assays were done using commercially available kits, according to the manufacturer’s instructions.
WC and venous blood samples were obtained after 12 h of overnight fasting. WC was measured using a flexible inelastic tape at the midpoint between the lowest rib and the iliac crest with a precision of 0·1 cm( Reference Wang, Thornton and Bari 22 ). Serum glucose, TAG, total cholesterol, HDL-cholesterol and VLDL-cholesterol concentrations were measured by enzymatic colorimetric assay (BS200; Mindray, Diagnostic Laboratory Instrument Inc.). Intra-assay and inter-assay CV were 0·6 and 1·7 % for glucose, 0·4 and 1·3 % for TAG, 0·8 and 1·4 % for total cholesterol and 1·5 and 2·0 % for HDL-cholesterol, respectively. LDL-cholesterol was calculated by the Friedewald formula. Insulin concentrations were measured with an electrochemiluminescence immunoassay (Elecsys Modular-E-170; Roche Diagnostics Systems), with intra-assay and inter-assay CV of 4·2 and 5·5 %, respectively. Systolic (SBP) and diastolic BP (DBP) were measured using a calibrated automated sphygmomanometer (HEM-742INT IntelliSense®; Omron), after a resting period of at least 10 min in the sitting position. An appropriate arm cuff was used. Arm position was adjusted so that the cuff was at the level of the right atrium. BP was measured on the dominant arm, every 3 min for 15 min, at the constant temperature of 22–24 °C. The first value was discarded, and the mean of the last four readings was used in the analysis. HDL/LDL ratio was calculated by dividing HDL-cholesterol by LDL-cholesterol values. HDL:TAG ratio was calculated by dividing HDL-cholesterol by TAG concentrations. The LAP index was calculated as (WC (cm])− 65)×(TAG concentration (mm)) for men, and (WC (cm)− 58)×(TAG concentration (mm)) for women( Reference Kahn 23 ).
Calcium homoeostasis markers
Serum total Ca concentrations were assessed by Ca arsenazo III method (Mira Plus; Roche Diagnostic Systems), with intra-assay and inter-assay CV of 0·9 and 1·5 %, respectively. Serum P and Mg concentrations were measured using a colorimetric assay (Bioclin kit; Quibasa Basic Chemical Ltda), with intra-assay and inter-assay CV of 2·7 and 2·5 % for P, and 1·2 and 1·3 % for Mg, respectively. Serum PTH concentrations were measured with an electrochemiluminescence immunoassay (Elecsys Modular-E-170; Roche Diagnostics Systems), with intra-assay and inter-assay CV of 2·8 and 3·3 %, respectively. Serum 25-hydroxyvitamin D levels were determined by chemiluminescent microparticle immunoassay (Architect i2000; Abbott Diagnostics), with intra-assay and inter-assay CV of 5·1 and 7·2 %, respectively.
Statistical analysis
Statistical analyses were conducted using the Statistical Package for Social Sciences for Windows, version 20.0 (IBM). All variables were examined for normality of distribution according to the Shapiro–Wilk test at 5 % significance. Data are expressed as means and standard deviations. An independent-samples t test was conducted to identify possible differences between who started with either MD (n 7) or CD (n 7) at baseline. To verify the efficacy of the washout period, a paired t test was conducted between the initial baseline data and the post-washout baseline data. Baseline data were calculated before each intervention period. Once the efficacy of the washout period was verified, the initial baseline and post-washout baseline data were combined and the final data from each study arm (n 14 each for the two phases) were combined. Then, data within sessions were analysed using the paired t test or Wilcoxon signed-rank test, pairing results from the same individual before (baseline) and after (12 weeks) each dietary intervention (CD or MD phase), considering P values ≤0·05 as significant. Data on changes from the baseline over the 12 weeks of the intervention (deltas, i.e. the final value minus the baseline value) were compared between the sessions using the paired t test or Wilcoxon’s signed-rank test, with Bonferroni correction for multiple comparisons. The criterion of significance was P<0·025, two tailed. Sample size was calculated according to the equation reported by Mera et al.( Reference Mera, Thompson and Prasad 24 ), considering the glycated Hb (HbA1C) as the main variable. Our eligible subjects’ baseline mean and standard deviation HbA1C values were applied, considering a desirable reduction of 1 % to decrease microangiopathy and neuropathy occurrence( 21 ). The statistical power was set up at 90 %. Therefore, and by applying a P value <0·05, the sample size required in our study was equivalent to fourteen volunteers per phase.
Results
Participants
In all, sixteen subjects met the eligibility criteria. However, fourteen (four men and ten women, BMI of 29·4 (sd 4·5) kg/m2, and 49·5 (sd 8·6) years of age; not on insulin therapy; 5 (sd 2) years duration of diabetes after diagnosis; sedentary) (Tables 2 and 3) completed both phases and were included in the analyses (Fig. 2). The reasons for these drop-outs were difficulties to daily attend the laboratory to consume the shake and owing to the change in the type of medication used.
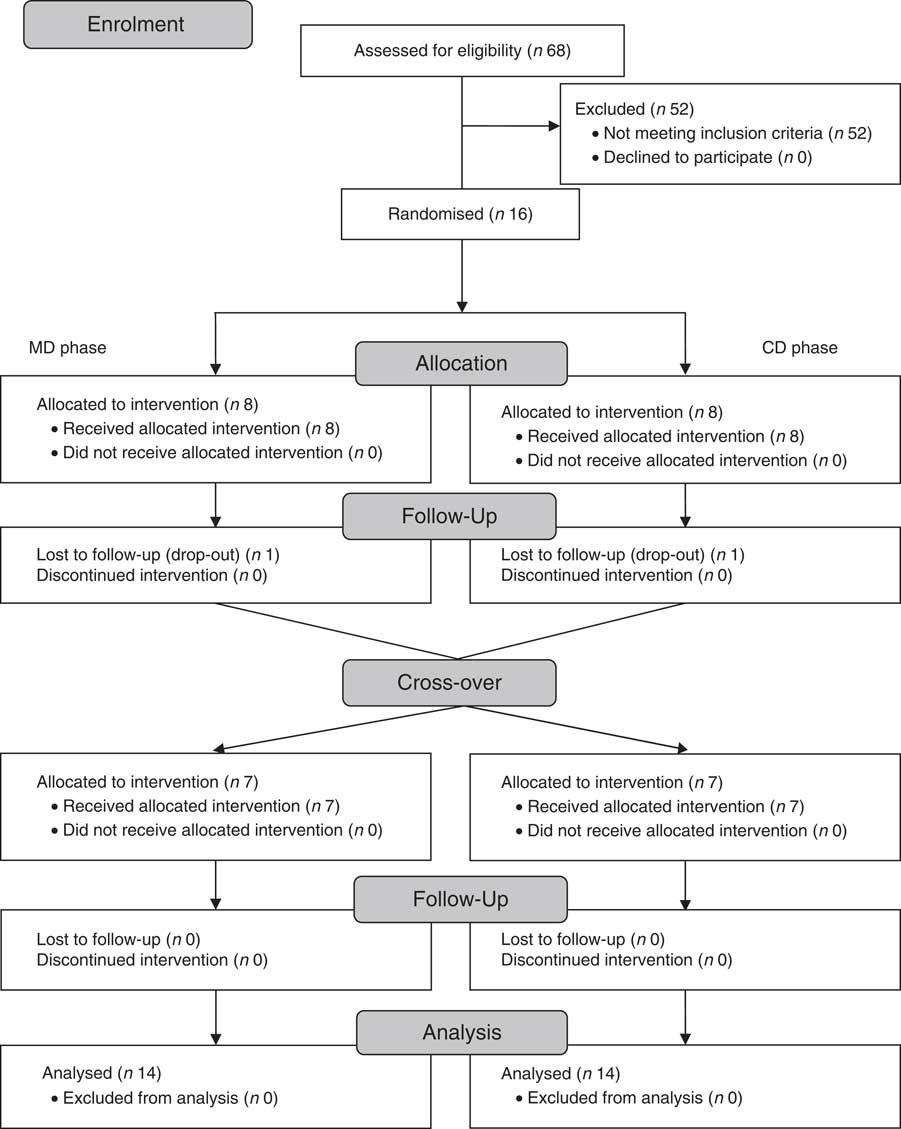
Fig. 2 Subjects flow throughout the study. MD, fat-free milk phase; CD, control phase.
Table 2 Food intake presented by the subjects, according to study experimental phase (n 14) (Mean values and standard deviations)
MD, high-calcium fat-free milk phase; CD, low-calcium control phase.
* P<0·05. P value was estimated by paired t test (intra-group comparisons). † P<0·025. P value was estimated by paired t test or Wilcoxon’s signed-rank (both with Bonferroni correction for multiple comparisons) (inter-group comparisons).
‡ Food intake was assessed by 3-d food records.
Table 3 Metabolic syndrome (MetS) components, other cardiometabolic outcomes and calcium homoeostasis markers presented by the subjects, according to study experimental phase (n 14) (Mean values and standard deviations)
MD, high-calcium fat-free milk phase; CD, low-calcium control (CD) phase; WC, waist circumference; LAP, lipid accumulation product; PTH, parathyroid hormone; 25-OH vitamin D, 25-hydroxyvitamin D.
* P<0·05. P value was estimated by paired t test (intra-group comparisons). † P<0·025. P value was estimated by paired t test or Wilcoxon’s signed rank (both with Bonferroni correction for multiple comparisons) (inter-group comparisons).
Dietary intake
Dietary fibre, Ca and P intake increased in MD compared with CD (inter-group comparison) (Table 2). Ca and P consumption at the end of MD were 232 % (693 mg) and 195·3 % (801 mg) higher, respectively, compared with the end of the CD phase (inter-group comparison) (Table 2). The Ca:P ratio was 0·49 and 0·66 at baseline, and 0·74 and 0·62 post treatment for MD and CD, respectively (intra-group comparison). No significant changes in dietary energy, carbohydrate, protein, fat, Mg and Zn intake were observed between the two dietary phases (inter-group comparison) (Table 2).
Metabolic syndrome components and cardiometabolic measures
WC decreased after MD, whereas no change was observed after CD (intra-group comparison) (Table 3). Reduction in WC from baseline to 12 weeks was greater in MD than CD (inter-group comparison) (Table 3). Total cholesterol, LDL-cholesterol, SBP and DBP, and LAP index decreased after MD (intra-group comparison) (Table 3). HDL:LDL ratio was higher after MD (intra-group comparison) (Table 3). There were no changes on biochemical variables in the CD, except from an increase in fasting glucose (intra-group comparison) (Table 3). Comparing changes from baseline to 12-week intervention, SBP, DBP and LAP index decreased in MD compared with CD (inter-group comparison) (Table 3).
Calcium homoeostasis markers
Serum Ca and P remained unchanged in both phases (intra-group comparison) (Table 3). Serum Mg and PTH decreased after MD, but there was no change after CD (intra-group comparison) (Table 3). Serum 25-hydroxyvitamin D was higher after MD and lower after CD (intra-group comparison) (Table 3). Changes in vitamin D, Mg and PTH from baseline to 12-week intervention differed between dietary phases (inter-group comparison) (Table 3).
Discussion
To our knowledge, this is the first study to investigate the effect of the increased consumption of Ca from fat-free milk on MetS components and cardiometabolic measures in subjects with T2DM. Our results indicate that the consumption of approximately three servings of fat-free milk and approximately 1200 mg of Ca/d (700 mg of Ca/d from breakfast shakes +500 mg of dietary Ca under free-living condition) during 12 weeks decreased some of the MetS components and cardiometabolic measures, such as WC, SBP, DBP and LAP index, compared with a low-Ca energy-restricted diet. In Brazil, average daily Ca intakes of 550 mg (84 % of inadequacy) and 477 mg (90·7 % of inadequacy) are estimated for adult men and women, respectively( Reference Araujo, Bezerra and Barbosa 25 ). Possible mechanisms that may explain the effects of increased fat-free milk consumption associated with an energy-restricted diet on MetS components and cardiometabolic outcomes, based on our results, are presented in Fig. 3.
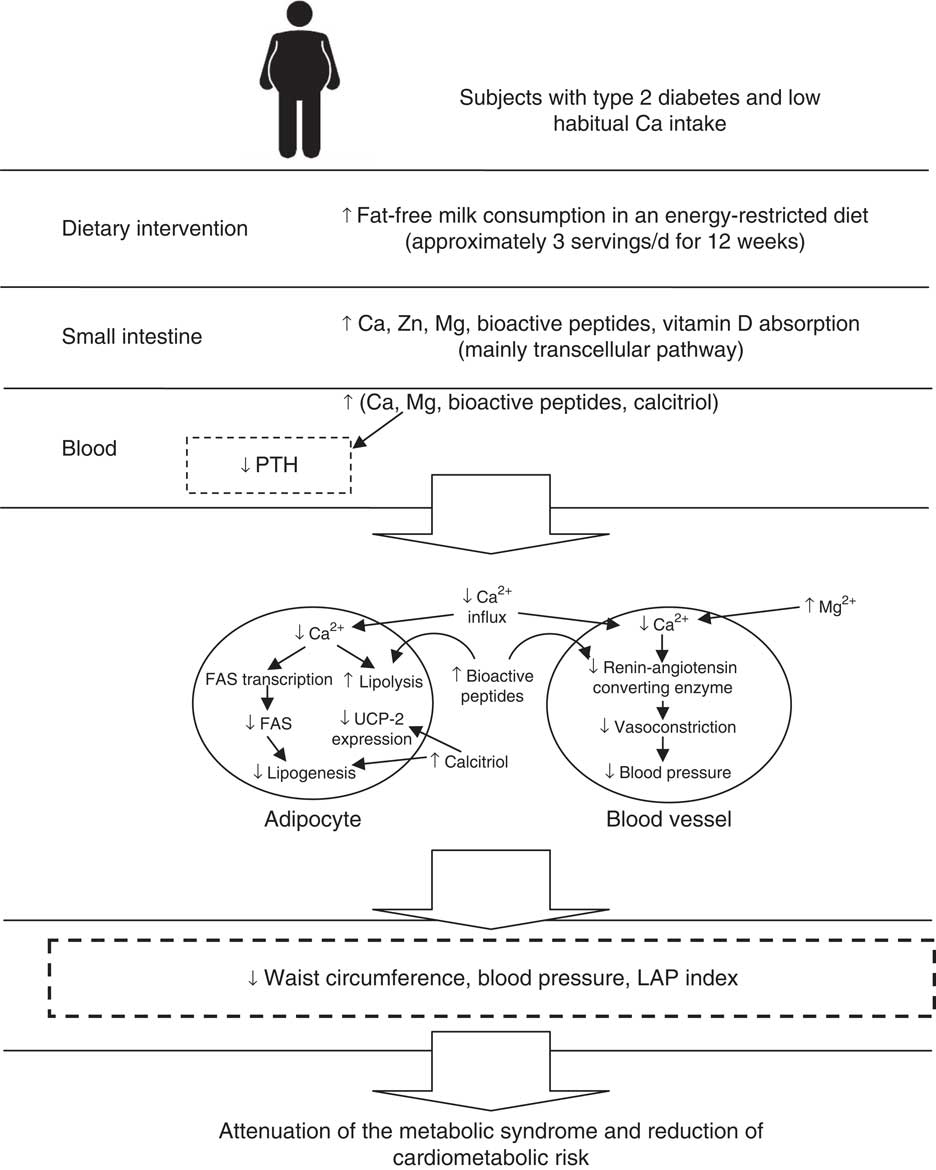
Fig. 3 Possible mechanisms that explain the effects of increased fat-free milk consumption associated with an energy-restricted diet on metabolic syndrome components and cardiometabolic outcomes, based on our results. FAS, fatty acid synthase; LAP, lipid accumulation product; PTH, parathormone; UCP-2, uncoupling protein 2.
The results of some RCT also indicate that dietary Ca (>1100 mg/d) from dairy product consumption decreased WC in adults( Reference Zemel, Richards and Mathis 11 , Reference Torres and Sanjuliani 12 ), but other authors did not find an inverse association between Ca/dairy intake and central adiposity( Reference Wennersberg, Smedman and Turpeinen 26 , Reference Jones, Eller and Parnell 27 ). Although overweight or obese subjects were also included in these clinical trials, the main differences between them were the habitual intake of Ca and the energy consumption (euenergetic or energy-restricted diets) during the studies. When the habitual intake of Ca was >800 mg/d, there was no effect on WC( Reference Wennersberg, Smedman and Turpeinen 26 , Reference Jones, Eller and Parnell 27 ). A threshold effect for Ca intake equivalent to approximately 600–800 mg/d has been proposed( Reference Dougkas, Reynolds and Givens 28 ), probably because low habitual Ca consumers typically present higher absorption of ingested Ca because they use preferentially transcellular pathway (active transport) instead of paracellular pathway (passive transport)( Reference Kopic and Geibel 29 ). In our study, the participants presented low-Ca consumption (mean intakes <600 mg/d) at baseline of both phases. A meta-analysis of fourteen RCT in 883 adults indicated that increasing dairy consumption only resulted in higher reduction in WC if energy-restricted diet was adopted compared with the consumption of conventional energy-restricted diets alone( Reference Abargouei, Janghorbani and Salehi-Marzijarani 8 ). The reduction in WC observed in MD was an important result, as WC is a good marker of visceral fat accumulation and is useful for predicting CVD( Reference Zemel, Richards and Mathis 11 ).
MD phase also promoted greater reduction of SBP and DBP compared with the CD one. Some RCT indicated lower BP in response to dairy intervention( Reference Wang, Manson and Buring 4 , Reference van Meij and Mensink 30 ), whereas in other studies the increased consumption of dairy foods did not affect BP( Reference Jones, Eller and Parnell 27 , Reference van Mierlo, Arends and Streppel 31 ). Crichton et al.( Reference Crichton, Howe and Buckley 32 ) suggest that the effects of dairy consumption on BP are clearly demonstrated only in people with high BP (SBP>130 mmHg and/or DBP>85 mmHg). Low-fat dairy products and Ca supplementation equivalent to 1200 mg/d also contribute to reduce BP, especially in people with habitual Ca intakes <800 mg/d( Reference Ralston, Lee and Truby 9 , Reference van Mierlo, Arends and Streppel 31 ). In our study, we offered fat-free milk; the subjects were low habitual Ca consumers and their baseline BP before increasing dairy consumption was slightly high (mean SBP 136·6 mmHg and mean DBP 84·2 mmHg). Therefore, we observed a significant reduction of 16 mmHg in SBP and 10·8 mmHg in DBP. Furthermore, the improved BP control with fat-free milk consumption may be clinically relevant, as people with diabetes are more susceptible to CVD( 21 ).
In our study, there was a greater LAP index reduction in the MD phase compared with within the CD. However, the large difference in LAP baseline values between these two phases is a limitation. That index has been shown to predict incident T2DM and the MetS, and it is considered a better index than BMI in predicting cardiovascular risk( Reference Kahn 23 ), and T2DM( Reference Kahn 33 ). The LAP index is also associated with glucose tolerance( Reference Wehr, Pilz and Boehm 34 ), and thus the lower LAP index after high-Ca diets could probably benefit diabetes control. The reduction in WC and in LAP index in MD suggests that this experimental phase promoted visceral adiposity reduction.
Beneficial effects of dairy product intake on MetS components and cardiovascular outcomes can be attributed to its Ca content( Reference Wang, Manson and Buring 4 , Reference Tong, Dong and Wu 5 ), but also to proteins( Reference Dugan and Fernandez 2 ) and other minerals present in dairy products( Reference Rice, Quann and Miller 35 ). Dietary fat binds to Ca in the intestine and inhibits its absorption, favouring body weight loss( Reference Jacobsen, Lorenzen and Toubro 3 ). However, the main effect of high-Ca diets is the decrease in calcitriol (1,25-dihydroxyvitamin D) and PTH concentrations, resulting in lower Ca influx into adipocytes, favouring the occurrence of lipolysis( Reference Zemel, Shi and Greer 36 ). On the other hand, low-Ca diets increase calcitriol and PTH concentrations, resulting in Ca2+ influx into adipocytes. Increased intracellular Ca2+ activates lipogenesis and suppresses lipolysis, increasing body fat and inducing insulin resistance( Reference Zemel, Shi and Greer 36 ). Calcitriol also inhibits the expression of adipocyte uncoupling protein 2, reducing mitochondrial fatty acid transport and fat oxidation( Reference Zemel, Teegarden and Loan 37 ). Therefore, the effects observed in this study may have been due to synergic dairy composition.
Ca intake may also interfere in BP. The increased Ca2+ influx into smooth muscle cells owing to low-Ca consumption can cause vasoconstriction and result in increased BP. Therefore, high-Ca diets seem to prevent Ca-mediated hypertension( Reference Dugan and Fernandez 2 , Reference Resnick 38 ). Disturbances in intracellular ions, such as increased Ca and decreased Mg, which are common responses in low-Ca diets, lead to vasoconstriction, increased platelet aggregation and thrombosis, as well as insulin resistance( Reference Resnick 38 ). In combination, Mg acts as a Ca antagonist on smooth muscle tone, blocking Ca2+ channels, and thus reducing vasoconstriction( Reference Bo and Pisu 39 ). Milk protein content may also be responsible for its anti-hypertensive and anti-obesity effects. Milk protein inhibits the angiotensin-converting enzyme, consequently reducing BP( Reference Dugan and Fernandez 2 ). In our study, besides the higher Ca content of MD breakfast shakes, both casein and whey protein (MD phase) may have contributed to lower SBP and DBP. On the other hand, the low-Ca and whey protein consumption (CD phase) did not affect BP. As hydrolysed casein is less absorbed( Reference Dugan and Fernandez 2 ) and the Ca content of micellar casein (contains 70 % of Ca in milk) could not be isolated( Reference Gaucheron 40 ), we offered only whey protein to CD to match the Ca content of the breakfast shakes. However, it is difficult to distinguish which dairy component has the better effect on MetS components and cardiovascular risk, as dairy products are good sources of the above-mentioned nutrients.
A strength of our study was the randomised, controlled cross-over design to assess the effects of high Ca from fat-free milk associated with an energy-restricted diet; hence, it reduces between-subject variability. We also controlled PAL and medication use throughout the study. Possible limitations of our study include MD dietary fibre intake increase (approximately 9·4 g/d higher than CD). However, we believe that this difference probably did not influence our results as it has been shown that a daily dietary fibre consumption of approximately 40 g is necessary to improve glycaemia( Reference Silva, Kramer and de Almeida 41 ) and the consumption of 10 g/d of fibre is not enough to increase weight loss( Reference Du, van der and Boshuizen 42 ).
In conclusion, the consumption of about three servings of fat-free milk (700 mg of dietary additional Ca/d) associated with an energy-restricted diet for 12 weeks promoted greater decrease in WC, BP and LAP index than the control diet in adults with T2DM.
Acknowledgements
The authors thank Instituto Federal do Sudeste de Minas Gerais, Coordenação de Aperfeiçoamento de Pessoal de Nível Superior, Fundação de Amparo à Pesquisa do Estado de Minas Gerais, Conselho Nacional de Desenvolvimento Científico e Tecnológico and Bioclin®, Quibasa Química Ltda.
For financial support, the authors thank Coordenação de Aperfeiçoamento de Pessoal de Nível Superior, Fundação de Amparo à Pesquisa do Estado de Minas Gerais, and Conselho Nacional de Desenvolvimento Científico Tecnológico.
The authors’ contributions were as follows: J. M. G. G. designed the study, analysed and interpreted the data and wrote the manuscript. J. A. C. assisted in analysing the data. R. C. G. A. designed the study, interpreted the data and edited the manuscript. All authors read and approved the final manuscript.
The authors declare that there are no conflicts of interest.
Supplementary material
For supplementary material/s referred to in this article, please visit http://dx.doi.org/doi:10.1017/S0007114517003956


