


Introduction
Yogurt, one of the many popular products that can be made from dairy milk, is an ancient food, whose health benefits appeared in writing as early as 6000 BC (Fisberg and Machado Reference Fisberg and Machado2015). By today's standards yogurt is broadly defined as a fermented milk product that provides digested lactose (Fisberg and Machado Reference Fisberg and Machado2015). Yogurt can contain active cultures or be heat treated, which kills the beneficial live and active yogurt cultures (NYA 2019). Today's yogurt products come in a variety of fat contents, including: low-fat (made from low-fat milk or part skim milk with between 0.5 and 2 percent milk fat) and nonfat (made from skim milk with less than 0.5 percent milkfat) (NYA 2019). Yogurt also comes in many forms, such as traditional, Greek, whipped, drinkable, and fruit on the bottom. Greek yogurt, which has more protein than traditional yogurt, has fueled the growth of the yogurt market after first being introduced in 2007 to the United States by Chobani (Meyer Reference Meyer2019).
Yogurt consumption in the United States lags behind other places such as Canada and Europe (Meyer Reference Meyer2019; Watson Reference Watson2019). However, yogurt production in the United States steadily increased from 912 million pounds in 1989 to over 4.7 billion pounds in 2014 (Figure 1). Since 2014, yogurt production in the United States has slowed, with 2018 production reaching just below 4.4 billion pounds (USDA NASS 2019). Although this slight recent downward trend may be evidence that yogurt sales have begun to stagnate, yogurt companies are hoping to expand sales by creating more varieties and convincing people to eat yogurt on occasions beyond breakfast (Meyer Reference Meyer2019). Additionally, expansion into more child-friendly flavors and packaging such as candy flavorings and yogurt tubes is believed to result in future sales growth (Watson Reference Watson2019).
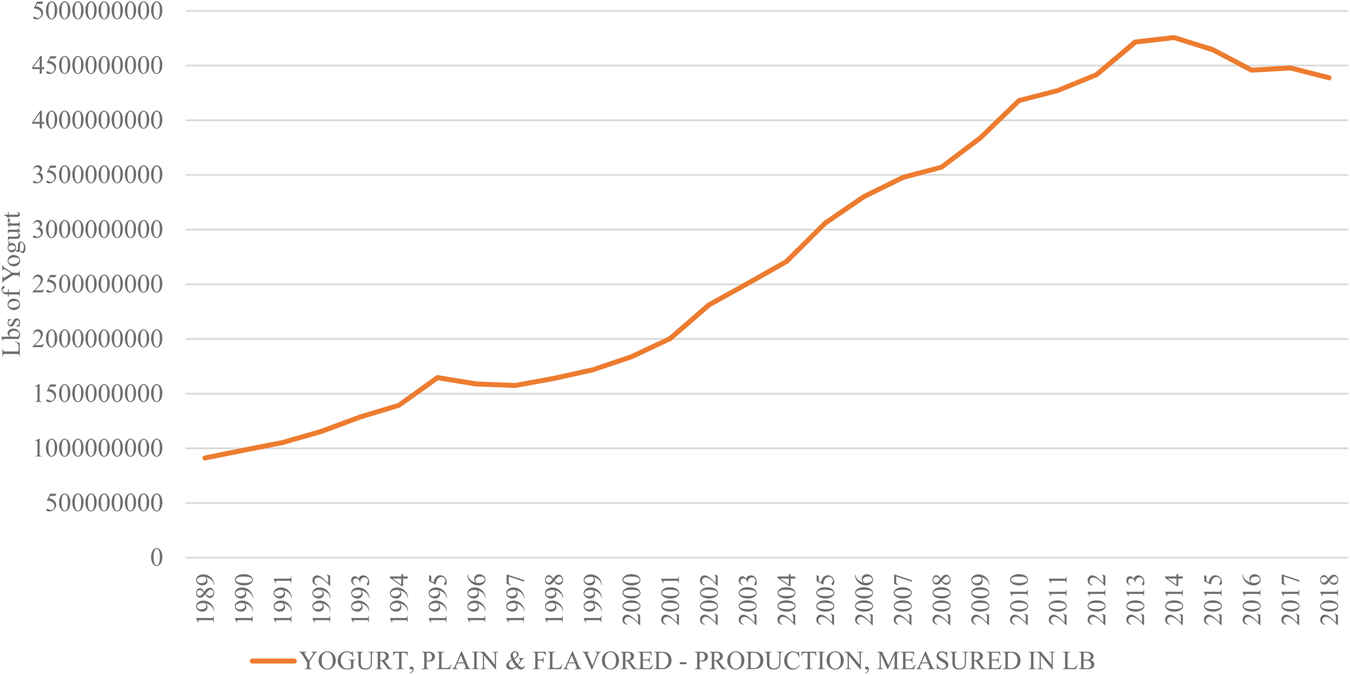
Figure 1. Plain and Flavored Yogurt Production in the United States Measured in Pounds (USDA NASS Reference NASS2019).
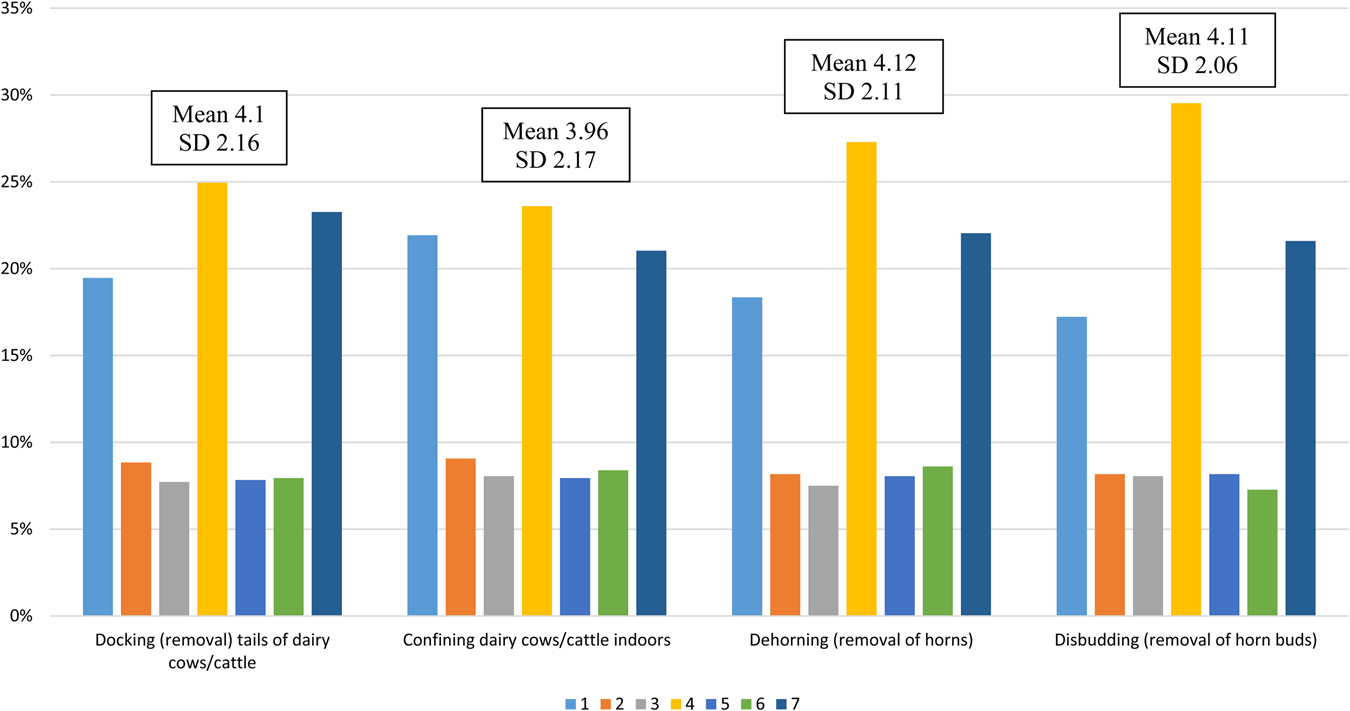
Figure 2. Respondent's Level of Agreement That the Following Practices Reduces Dairy Cattle Welfare 1 (Very Strongly Agree) to 7 (Very Strongly Disagree) n = 894
Although yogurt has been studied extensively from a health perspective, such as for immunologic effects (Meydani and Ha Reference Meydani and Ha2000), effects on metabolism (Wang et al. Reference Wang, Livingston, Fox, Meigs and Jacques2013), and general gut health (Fisberg and Machado Reference Fisberg and Machado2015), little exists in the literature regarding consumer preferences for yogurt and especially consumer preferences for Greek yogurt. Moro et al. (Reference Moro, Veneziani, Sckokai and Castellari2015) studied Italian consumer willingness to pay (WTP) for probiotics and catechin-enriched yogurt and found a positive WTP for both attributes, while Olynk and Ortega (Reference Olynk and Ortega2013) found that U.S. consumers had a positive willingness to pay for USDA-, retail-, or industry-verified pasture access, antibiotic use, and rbST use in ice cream and yogurt. Additionally, statistically significant differences were found between the WTP for the attributes in the two products, with respondents willing to pay more, on a price adjusted percentage basis, for credence attributes in yogurt when compared to ice cream (Olynk and Ortega Reference Olynk and Ortega2013). This work contributes to the literature by further evaluating and comparing consumer preferences for milk production practices in the purchasing of Greek and traditional yogurt.
Preferences for other dairy products, including fluid dairy milk and cheese, have been studied. Napolitano et al. (Reference Napolitano, Braghieri, Piasentier, Favotto, Naspetti and Zanoli2010) employed a WTP model to evaluate Italian consumers’ preferences for Pecorino cheese and found that consumers prefer organic, and similarly Krystallis and Chryssohoidis (Reference Krystallis and Chryssohoidis2005) found a preference for organic feta cheese in Greek consumers. Other studies have focused on specific animal welfare-related attributes. Bir et al. (Reference Bir, Widmar, Wolf and Delgado2019) used a best-worst scaling model to elicit consumer preferences for container material, rbST-free, price, container size, fat content, humane handling, brand, required pasture access, and cattle fed an organic diet in fluid dairy milk. Top attributes in terms of preference revealed public interest in both product attributes themselves, such as fat content, as well as animal-related attributes, such as humane handling or requiring access to pasture (Bir et al. Reference Bir, Widmar, Wolf and Delgado2019). Other studied dairy production practices include dehorning, which is practiced on dairy operations to improve safety for both people and animals, decrease aggressive behavior, and decrease carcass damage; however, the process of dehorning is painful and often done without pain medication (AVMA 2014). Twelve percent of respondents in a nationally representative 2017 survey indicated that they had altered their dairy consumption due to animal welfare concerns, and tail docking and dehorning were perceived as the least beneficial and most negative implications for dairy cattle welfare of those studied (Widmar et al. Reference Widmar, Morgan, Wolf, Yeager, Dominick and Croney2017). Consumers’ preferences can differ between products (Olynk and Ortega Reference Olynk and Ortega2013); therefore, previous findings from other dairy products cannot be directly applied to yogurt. With the rise of Greek yogurt as an option in the marketplace, understanding differences in preference among production process attributes between Greek and traditional yogurt can help inform producers regarding potential dairy cattle management practices.
This work aims to build on previous findings by evaluating consumer WTP for attributes associated with pasture access, dehorning/disbudding of dairy cattle, and Greek and traditional yogurt that is labeled free of high-fructose corn syrup and/or nonfat. Although both are yogurt products, Greek and traditional yogurt are priced differently, typically come in different sized containers, and may be consumed for different reasons and by individuals from different demographic groups. High-fructose corn syrup is a modified corn syrup that has an increased amount of fructose made from the enzymatic conversion of glucose, and is widely used as a sweetener (Merriam Webster 2019). Although there are no scientific links between high-fructose corn syrup, obesity, and other negative health effects in humans, some health-conscious consumers have recently become skeptical and are avoiding high-fructose corn syrup in products (Parker and Nwosu Reference Parker, Salas and Nwosu2010).
The objectives of this study are to (1) evaluate when, why, and what type of yogurt products people in the United States consume; (2) elicit and compare consumer WTP for traditional and Greek yogurt attributes; and (3) determine if differences in WTP for traditional and Greek yogurt attributes can be ascribed to demographics and shopping behavior. These results contribute to the literature by evaluating an understudied, but commercially important, dairy product – yogurt.
Methods
An online survey designed in Qualtrics was administered from June 11 to June 21, 2019, to gather demographic information and dairy consumption behaviors, with a special focus on yogurt purchases and consumption. To further understand preferences for yogurt, two WTP experiments featuring Greek or traditional yogurt were included with the novel approach of allowing consumers to self-select into the experiment for the yogurt type for which they most commonly shopped. Kantar, a company which hosts an opt-in online panel, was used to obtain survey respondents: a total of 894 respondents completed the survey with the associated yogurt WTP experiments.Footnote 1 The sample was targeted to be nationally representative of the United States in terms of gender, income, education, and geographical region of residence as defined by the U.S. Census Bureau Regions and Divisions using quotas in Qualtrics (U.S. Census Bureau 2016). Using the test of proportions, the statistical representativeness of the survey respondents was evaluated for the targeted demographics.
To understand dairy shopping and consumption behavior, and to describe the survey sample, respondents were asked how much they spend on food in an average week, how frequently they eat out for each meal, what snacks they purchase outside the home, and what types of information they look for on packaging. Respondents were asked how frequently (if at all) they purchased specific yogurt products for their household. If they responded that they purchased the yogurt product at least monthly, they were asked additional specific questions about that product, such as what type they purchased and for what consumption purpose. Respondents were also asked a series of yogurt purchasing questions for their households, including if they had decreased yogurt consumption for any of the following concerns: animal welfare/handling, health, budgetary, and food safety. To develop an understanding of respondents’ perceptions of dairy cattle management practices, they were asked to indicate their level of agreement that practices such as docking (removal) of tails of dairy cows/cattle, confining dairy cows/cattle indoors, dehorning (removal of horns), and disbudding (removal of horn buds), decreased dairy cow/cattle welfare on a scale from 1 (very strongly agree) to 7 (very strongly disagree). Means and standard deviations were calculated, and the levels of agreement across the production practices were statistically compared using a t-test.
WTP for Greek and Traditional Yogurt
After responding to questions regarding household dairy consumption, including yogurt, and prior to participating in a WTP choice experiment, respondents were asked to indicate which type of yogurt they most commonly shop for: Greek yogurt, traditional yogurt, or neither. This question differs slightly from the demographics and general purchasing section of the survey because it asked about the individual, not the household's, purchasing behavior. Although some consumers may purchase both Greek and traditional yogurt, it is unlikely they purchase both types at the same frequency or in the same quantity. Respondents who purchase both could have participated in both experiments; however, that may have resulted in survey fatigue, which is known to decrease data quality (Galesic and Bosnjak Reference Galesic and Bosnjak2009). Therefore, the compromise of having respondents participate in the experiment for the product that was most commonly shopped for was chosen. Additional proportion testing was conducted within demographic categories for those who purchased yogurt, and in particular purchased Greek or traditional yogurt. If the respondent selected Greek yogurt, they participated in a WTP choice experiment where they were asked to choose between two Greek yogurt purchasing scenarios or the option “I do not choose to purchase either option A or B.” If they selected traditional yogurt, they participated in a WTP experiment of traditional yogurt purchasing scenarios. If the respondent selected neither, they were randomly assigned to participate in either the Greek or traditional WTP choice experiment. The SAS OPTEX program was used to design a main effects experiment and determine the specific combination of attribute levels seen by respondents in the choice experiment (Lusk and Norwood Reference Lusk and Norwood2005). The specific design was chosen by maximizing D-efficiency, which was 85.49 for both the Greek and traditional yogurt designs. The final design resulted in 12 choice scenarios (questions), and respondents participated in all 12 choice scenarios for either Greek or traditional yogurt. With the exception of the attributes that were presented in each choice scenario, respondents were informed that the two traditional or two Greek yogurt products presented in each scenario had the same characteristics in terms of color, brand, and flavor. Information explaining each of the four attributes in the choice experiment were shown to respondents prior to presenting any questions and are available in Appendix A. The cheap talk script as proposed by Lusk (Reference Lusk2003) is intended to minimize hypothetical bias and was employed in both WTP experiments.
Attributes included were the same for the traditional and Greek yogurt WTP experiments: price, required pasture access or pasture access not required, dehorning/disbudding not permitted or dehorning/disbudding permitted, labeled free of high-fructose corn syrup or no high-fructose corn syrup labeling claim, and nonfat or low-fat. For Greek yogurt, the prices presented per 5.3 oz. cup were $0.72, $1.00, and $1.29. For traditional yogurt, the prices presented per 6.0 oz. cup were $0.40, $0.79, and $1.14. Prices and cup sizes were determined by observing prices and available sizes in the marketplace in April 2019. Currently in the United States, animal welfare-related labeling is not required by legislation or regulation. However, often to garner a premium or increase sales, companies may choose to include production information on their labels. Whether this production choice, such as dehorning method or pasture access, results in improved animal welfare may be a point of debate among animal scientists. Additional information to respondents regarding this debate about animal welfare was not provided in order to more closely mimic a real shopping experience where consumers bring their own opinions and knowledge to the store. These results can be used by the dairy industry to help inform production decisions, bearing in mind that information regarding the pros and cons of the production practices were not included in a formal way.
Choice experiments are based in random utility theory. The probability that respondent n chooses alternative i, which represents maximizing utility (U) with deterministic component Vnit, if Unit > Unjt $\forall$ j≠i is represented by (Train Reference Train2009):

Given the underlying distribution of the error term, Equation 1 can be condensed through algebraic manipulation to:

The random utility of a selection for either traditional or Greek yogurt is defined as:

where Price is the price a respondent is willing to pay for traditional or Greek yogurt, and Optout is a constant which represents the respondent's disutility from having to walk away from purchasing either Greek or traditional yogurt, ReqPasture is the effects coded term for required pasture access, NoDehorn is the effects coded term for dehorning/disbudding not permitted, FreeOfFructose is the effects coded term for labeled free of high-fructose corn syrup and Nonfat is the effects coded term for nonfat as opposed to low-fat. For the RPL model, the mean WTP is calculated as the negative of the ratio of the coefficient for the particular attribute and the coefficient of price; for example, the WTP for required pasture access can be calculated as:

The −2 in Equation 4 accounts for the effects coding of the various levels of the attributes. In this experiment, all attributes had two levels and were coded with −1 and 1, unlike typical 0,1 dummy variable coding (Tonsor and Wolf Reference Tonsor and Wolf2010). This coding prevents the left-out dummy variable from being incorporated into the intercept, which occurs under the traditional dummy variable estimation setup (Lusk et al. Reference Lusk2003). The disutility in terms of dollars of walking away from the purchase of traditional or Greek yogurt (OptOut) is calculated as:

A likelihood-ratio (LR) test was used to determine if those who purchased and those who did not purchase Greek (traditional) yogurt could be pooled for analysis in the Greek (traditional) yogurt models (Louviere, Hensher, and Swait Reference Louviere, Hensher and Swait2000). Using the Krinsky and Robb method of parametric bootstrapping, 95 percent confidence intervals were determined for each attribute in each model to account for variability in estimation (Krinsky and Robb Reference Krinsky and Robb1986; Olynk and Ortega Reference Olynk and Ortega2013). Within each model, either traditional or Greek yogurt, overlapping confidence intervals were compared to determine if there were statistically significant differences between WTP for each attribute (Schenker and Gentleman Reference Schenker and Gentleman2001). To statistically compare WTP for each attribute between the traditional and Greek models, the complete combinatorial method as outlined by Poe, Giraud, and Loomis (Reference Poe, Giraud and Loomis2005) was employed.
In order to better understand the relationship between demographics, shopping behavior, and WTP for both traditional and Greek yogurt, two seemingly unrelated regressions (SURs) were employed. SURs were used because it was likely that the error terms for the WTP estimates within the individual equations were correlated (Greene Reference Greene2013; Zellner, Reference Zellner1962). The same model structure was used for both Greek and traditional yogurt, defined as:


where Male indicates male gender, BuysYogurt indicates purchasing yogurt outside the home, AnimalWelfare indicates reading animal welfare labeling on milk, meat, or dairy products, HighIncome indicates an income of $75,000 or higher, Child indicates having a child in the household, CattleConfine indicates the level of agreement that confining dairy cows/cattle indoors decreases welfare, CattleDehorn indicates the level of agreement that dehorning (removal) of horns decreases welfare, CattleDisbud indicates the level of agreement that disbudding (removal) of horn buds decreases welfare, and Milk indicates that the respondent purchases 2 percent, 1 percent, or fat-free dairy milk. The Breusch-Pagan test was conducted to determine if the individual equations within the SUR models were correlated (Breusch and Pagan Reference Breusch and Pagan1980).
Results
The demographics of the 894 respondents who completed the survey instrument and WTP experiments statistically varied from the U.S. census in only a few demographic categories (Table 1). The percentage of respondents who were 18–24 (9 percent) was statistically lower than the U.S. census (13 percent). A lower percentage of respondents did not graduate from high school (6 percent), and a higher percentage of respondents graduated from high school (33 percent), when compared to the U.S. census, 13 percent and 28 percent, respectively. A higher percentage of respondents were from the South (39 percent), and a lower percentage of respondents were from the Midwest (21 percent), when compared to the U.S. census 21 percent and 38 percent, respectively.
Table 1. Demographics, Comparison to U.S. Census, and Comparison of Yogurt Consumers
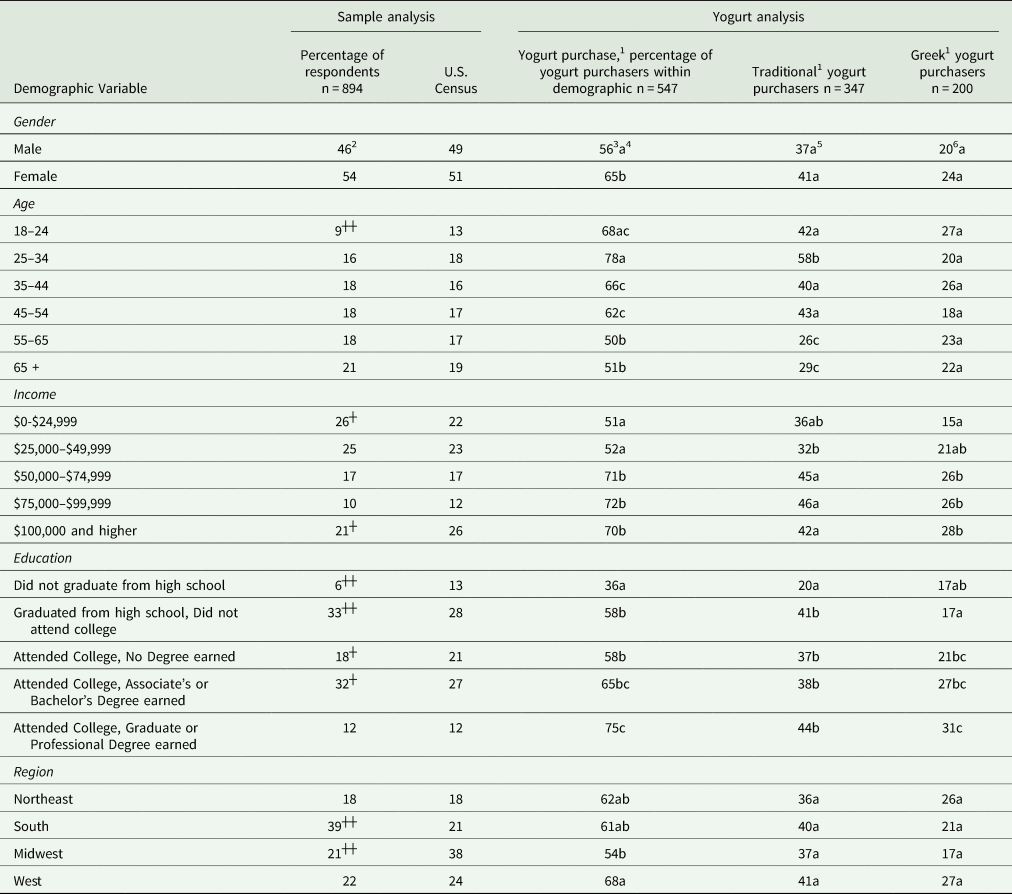
┼Percentage of respondents is statistically different than the percentage of the U.S. Census at the 0.05 level ┼┼<0.001 level
1 Respondent reported purchase of yogurt for self as opposed to household.
2 For example, read this as 46 percent of respondents were male.
3 For example, read this as 56 percent of men purchased yogurt.
4 Matching letters indicate the percentage for that demographic within the demographic category are not statistically different. Differing letters indicate the percentage for that demographic within the demographic category are statistically different. For example, the percentage of men who purchase yogurt is statistically different than the percentage of women.
5 For example, read this as 37 percent of men purchased traditional yogurt.
6 For example, read this as 20 percent of men purchased Greek yogurt.
On average, respondents spent $176.86 (SD 479.28, n = 879) per week on total food consumption, including at home, in restaurants, take-out, etc. Approximately half of respondents (56 percent) did not consume breakfast outside the home during a typical week and 40 percent of respondents did not consume lunch out in a typical week (Table 2). Fifty-four percent of respondents never purchased ice cream outside the home, 67 percent never purchased juice/smoothies outside the home, and 71 percent of respondents never purchased yogurt cups outside the home. Most respondents indicated that they read information when reviewing meat, egg, or milk product packaging. Sixty-six percent of respondents indicated they looked for price, 60 percent looked for the product expiration or “sell by” date, 38 percent looked for nutritional information, and only 14 percent looked for animal welfare information. Sixty-seven percent of respondents purchased at least some fluid dairy milk (skim, low-fat 1 percent, reduced-fat 2 percent, and whole milk) in a typical week. The mean level of agreement that confining dairy cows/cattle indoors decreased dairy cattle welfare was statistically lower than all other dairy cattle welfare practices, indicating respondents were most concerned about this practice. There were no statistically significant differences between the production practices of docking (removal) tails of dairy cows/cattle, dehorning (removal of horns), and disbudding (removal of horn buds).
Table 2. Respondent Consumption and Shopping Habits
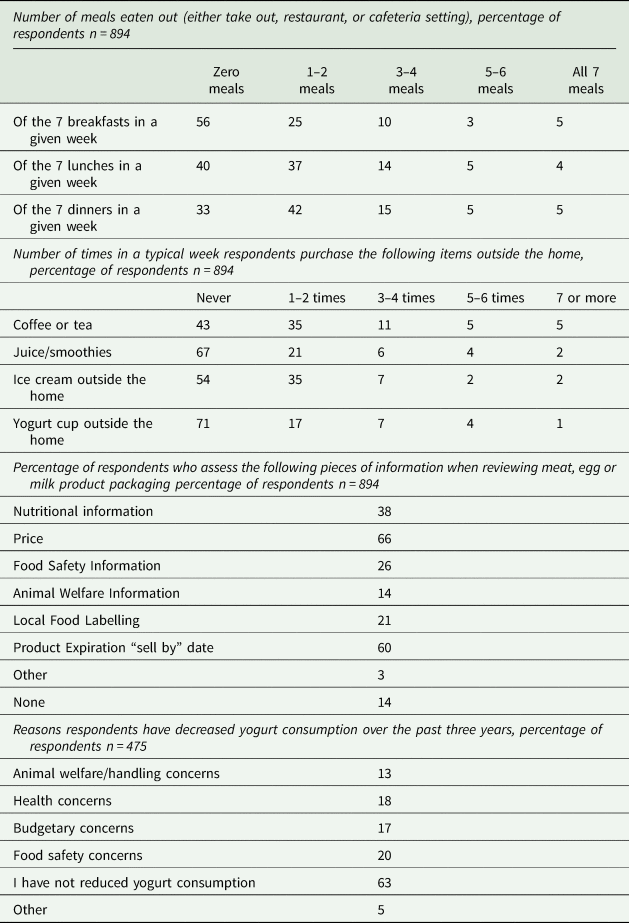
Five-hundred-forty-seven (61 percent of) respondents indicated that they purchased/consumed yogurt themselves (Table 1). A statistically higher percentage of women (65 percent) purchased yogurt for themselves when compared to men (56 percent). Lower percentages of respondents 55 and older purchased yogurt when compared to all other age categories. Higher percentages of respondents with incomes of over $50,000 purchased yogurt when compared to the lower income categories. Traditional yogurt was purchased most commonly by 347 respondents, 39 percent of all respondents, or 63 percent of yogurt shoppers. Greek yogurt was purchased most commonly by 22 percent of the total sample (or 37 percent of yogurt consumers). Lower percentages of respondents with an income of less than $50,000 purchased Greek yogurt when compared to all other income categories. Fifty-three percent of respondents indicated that someone in their household purchased yogurt at least four times a year, 42 percent indicated they did not, and 5 percent indicated that they did not know. Of those respondents, the majority (63 percent) had not reduced yogurt consumption over the past three years. Twenty percent indicated that they had reduced yogurt consumption due to food safety concerns, and only 13 percent had reduced consumption due to animal welfare/handling concerns (Table 2).
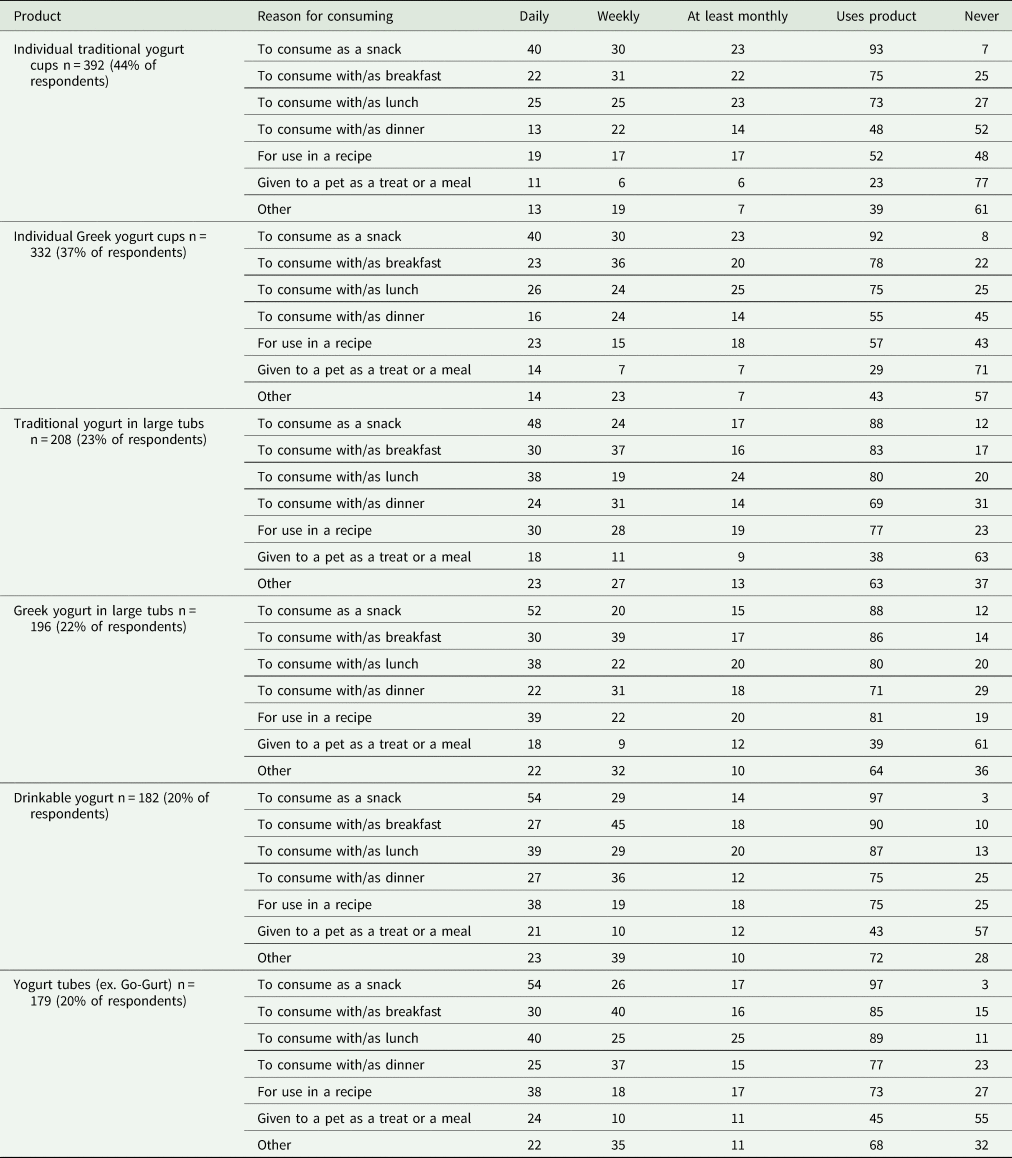
Respondents who purchased yogurt (n = 475) were asked which specific types of yogurt products their household purchased as well as the frequency (Table 3). Forty-five percent of yogurt purchasers purchased individual traditional yogurt cups weekly, while 41 percent purchased individual Greek yogurt cups monthly. For traditional yogurt in large tubs, Greek yogurt in large tubs, drinkable yogurt, and yogurt tubes, high percentages of yogurt buying respondents never purchased these products (ranging from 51 percent to 54 percent). A high percentage of respondents (39 percent) who purchased yogurt in large tubs (n = 196) purchased plain yogurt. For all yogurt products, low percentages of respondents, ranging from 10 percent to 18 percent, purchased heat-treated products. The most common uses for all yogurt products studied were to consume as a snack, to consume with/as breakfast, and to consume with/as lunch (Table 4). For Greek yogurt in large tubs, an additional category, for use in a recipe, was selected by 81 percent of Greek yogurt in large tub purchasers (n = 196). Fed to a pet as a treat or meal, was selected the least for all products studied; however, it was still selected by 23 percent of individual traditional yogurt cup purchasers, which was the lowest product use (n = 392).
Table 3. Respondents’ Household Purchasing Behavior of Specific Yogurt Products
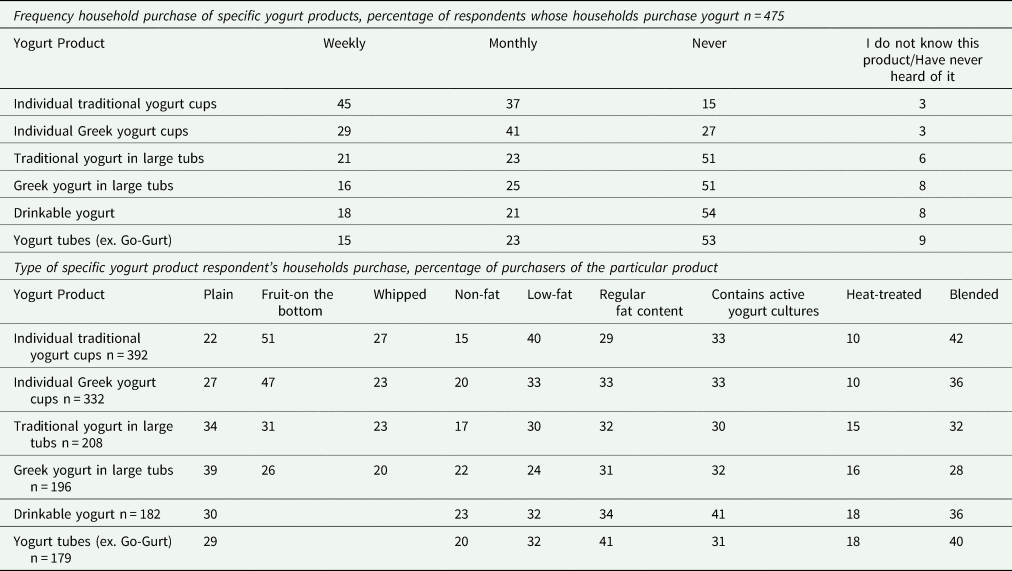
Note: Greyed-out boxes indicate options that were not available to respondents for that particular product. They were not included because for that particular yogurt product, the option was not available in the marketplace (did not exist/did not make sense).
Table 4. Reasons and Frequency of Respondent's Household's Purchase of Yogurt Products, Percentage of Respondents Whose Household Purchases Each Product
WTP for Greek and Traditional Yogurt Production and Production Process Attributes
For both the traditional and Greek yogurt models, those who did and did not consume that type of yogurt could not be pooled (LR = 143, df = 20, p < 0.001 for Greek, and LR = 233, df = 20, p < 0.001 for traditional). Respondents were willing to pay a statistically significant amount for all attributes for the traditional yogurt, with the exception of yogurt labeled free of high-fructose corn syrup (Table 5). Respondents had a higher WTP for both required pasture access ($0.46) and dehorning/disbudding not permitted ($0.58) when compared to fat content in traditional yogurt. There was not a statistically significant difference in mean WTP for pasture access and dehorning/disbudding not permitted for traditional yogurt. For the attribute nonfat, respondents were willing to pay −$0.14 when compared to low-fat in traditional yogurt. Walking away from a traditional yogurt purchasing opportunity (Optout) resulted in a disutility of $1.50.
Table 5. RPL Coefficients, Standard Errors, and Willingness to Pay for Traditional and Greek Yogurt
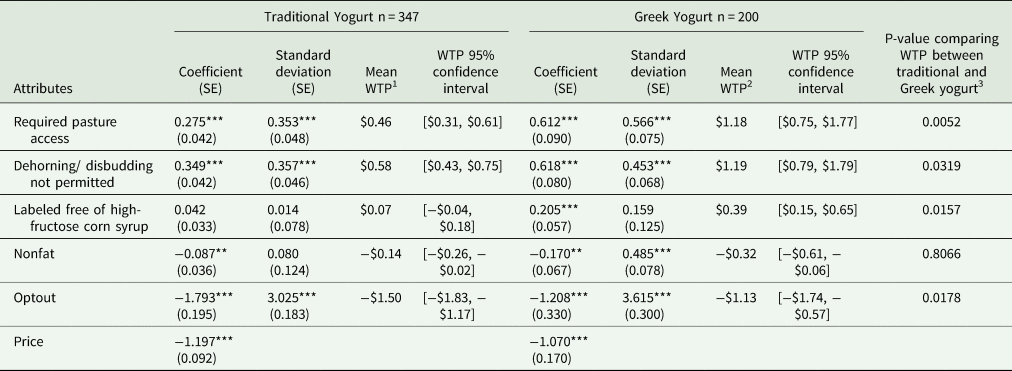
* Statistically significant at the 0.10 level, **0.05 level, and *** at the <0.001 level.
1 Prices presented to respondents for the traditional yogurt WTP choice experiment were $0.40, $0.79, $1.14 per 6 oz cup, mean $0.78.
2 Prices presented to respondents for the Greek yogurt WTP choice experiment were $0.72, $1.00, and $1.29 per 5.3 oz cup, mean $1.00.
3 Mean prices for the traditional and Greek WTP choice experiments were used to normalize prices prior to comparison.
For Greek yogurt, respondents were willing to pay a higher amount for required pasture access ($1.18) and dehorning/disbudding not permitted ($1.19) when compared to the attributes labeled free of high-fructose corn syrup and nonfat. Respondents were not WTP a positive amount for nonfat Greek yogurt, relative to low-fat yogurt. Walking away from the Greek yogurt purchasing opportunity (Optout) resulted in a disutility of $1.13. When comparing the normalized WTP between traditional and Greek yogurt, respondents were willing to pay more for required pasture access and dehorning/disbudding not permitted in Greek yogurt than in traditional yogurt.
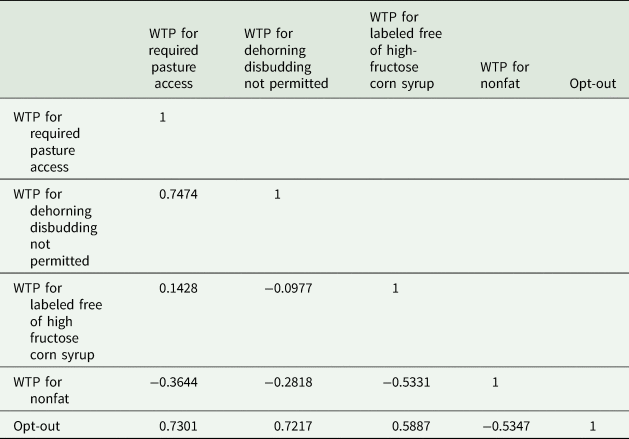
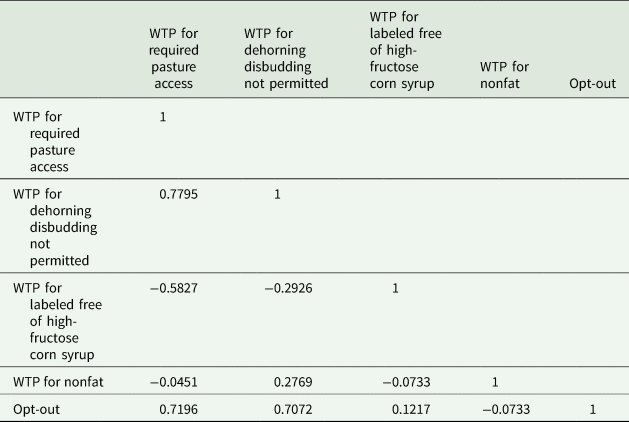
For both the SUR for traditional and Greek WTP, the residuals of the individual equations were correlated, with a Breusch-Pagan test for independent equations of less than 0.001 for both models. The correlations between each equation for the two models are available in Appendix B. All individual models were statistically significant for both Greek and traditional yogurt, with the exception of the model for WTP for nonfat traditional yogurt (Table 6). Being male decreased WTP for required pasture access and dehorning/disbudding not permitted for both traditional and Greek yogurt when compared to being female. Buying yogurt outside the home decreased WTP for required pasture access, and dehorning/disbudding not permitted for both traditional and Greek yogurt when compared to not buying yogurt outside the home. Additionally, buying yogurt outside the home increased WTP for nonfat Greek yogurt. Looking at animal welfare labeling did not have a statistically significant impact on WTP for required pasture access or dehorning/disbudding not permitted for traditional yogurt but increased WTP for required pasture access in Greek yogurt when compared to not looking at animal welfare labeling. Having an income above $75,000 as opposed to an income of less than $75,000 decreased WTP for required pasture access for both traditional and Greek yogurt. Additionally, having an income above $75,000 increased WTP for labeled free of high-fructose corn syrup in traditional yogurt. Having a child in the household decreased WTP for dehorning/disbudding not permitted in traditional and Greek yogurt and decreased the disutility experienced from walking away from a traditional or Greek yogurt buying opportunity. Furthermore, having a child decreased the WTP for required pasture access in Greek yogurt. Interestingly, the level of agreement that confining dairy cows/cattle indoors decreases dairy cattle welfare did not statistically significantly impact WTP for required pasture access in traditional or Greek yogurt. The level of agreement that disbudding (removal) of horn buds decreases welfare did not have a statistically significant impact on WTP for dehorning/disbudding not permitted for either traditional or Greek yogurt.
Table 6. Seemingly Unrelated Regressions of Willingness to Pay for Traditional and Greek Yogurt Attributes and Demographic/Shopping Characteristics
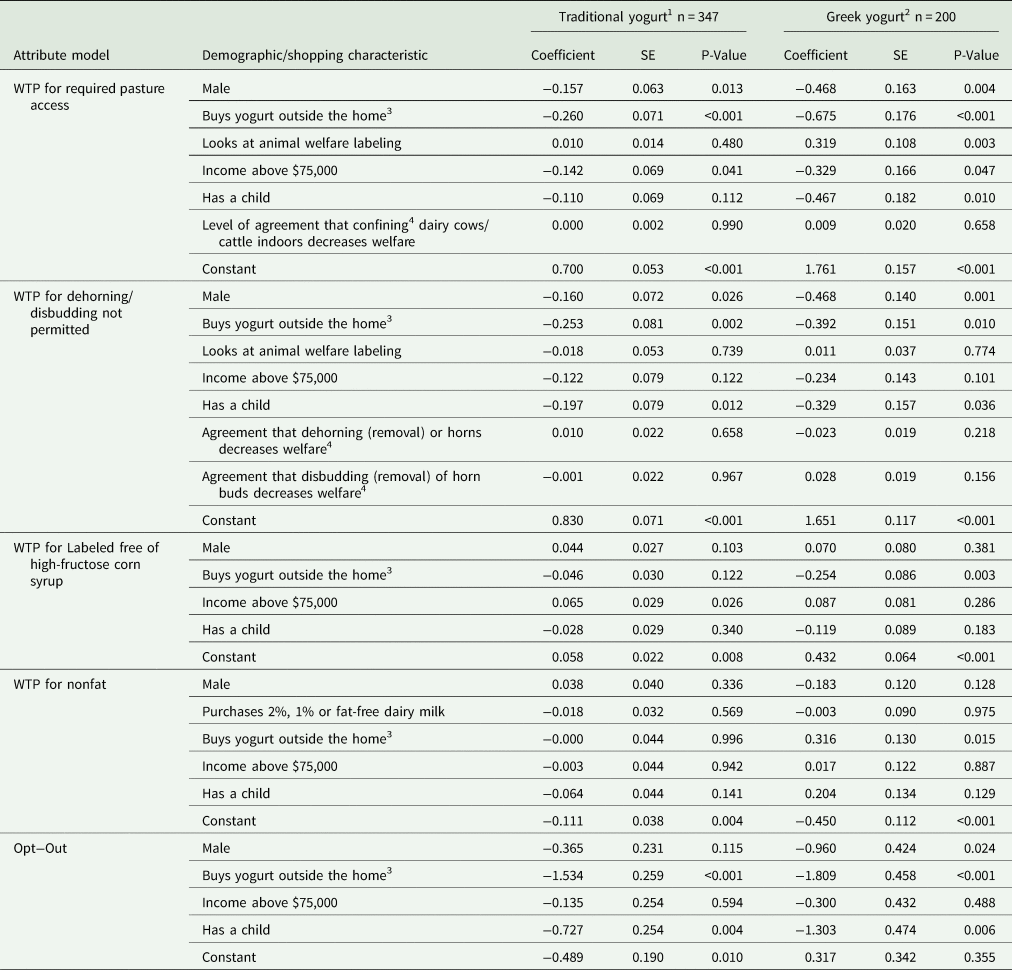
1 P-value for individual traditional yogurt models (top to bottom) <0.001, <0.001, 0.002, 0.6028, <0.001.
2 P-value for individual Greek yogurt models (top to bottom) <0.001, <0.001, 0.002, 0.009, <0.001.
3 Respondent purchased yogurt outside the home at least 1–2 times a week.
4 Level of agreement was indicated on a scale of 1 (very strongly agree) to 7 (very strongly disagree).
Discussion
Although the survey respondents had a slightly higher education, which is a common occurrence in online surveys (Szolnoki and Hoffmann Reference Szolnoki and Hoffmann2013), in general the demographics closely matched the U.S. census. Reported weekly food shopping spending, including at home, in restaurants, and take-out, was somewhat higher than previous findings. McKendree et al. (Reference McKendree, Widmar, Ortega and Foster2013) found that on average respondents spent $132.77 on food, which is lower than the $176.86 reported in this study. The bureau of labor statistics reported average food expenditure (at home and eating out) in 2018 as $7,923, which is $152 (USDL 2019). There was a 2.5 percent increase in food expenditure between 2017 and 2018 (USDL 2019). Therefore, the higher total weekly spending found in this analysis may reflect a general increase in food prices over the past six years, among other possible factors.
In a December 2016 Gallup poll, 38 percent of adult Americans did not eat dinner out in an average week, and 45 percent ate 1–2 dinners out (Saad Reference Saad2017). This study's findings that 33 percent of respondents consumed zero dinners out and 42 percent consumed 1–2 dinners out corroborated previous statistics. Interestingly, although ice cream and yogurt are both dairy products, a higher percentage of respondents purchased ice cream outside the house at least once a week when compared to yogurt. Consumers are eating less ice cream, but the ice cream they are consuming is higher-end (Leathan Reference Leathan2017). Traditionally, ice cream may be seen as a treat, while yogurt is part of a meal or healthy snack (Olynk and Ortega Reference Olynk and Ortega2013). As people become more conscious of sugar consumption, people have begun to consume premium yogurts as a household dessert in place of ice cream (Leathan Reference Leathan2017).
Yogurt did not become mainstream in the United States until the 1970s. It had previously been a product sold mostly in health food stores (Meyer Reference Meyer2019; Davis et al. Reference Davis, Blayney, Muhammad, Yen and Cooper2010). Sixty-one percent of respondents in this analysis indicated that they purchased yogurt. Unsurprisingly, lower percentages of those 55 and older purchased yogurt, as perhaps it was not part of their diet earlier in life. A higher percentage of women consumed yogurt when compared to men. Conversely, Bonanno (Reference Bonanno2013) found that yogurt demand among Italian consumers increased with age. This demonstrates that consumption patterns in one country may not necessarily be assumed to hold in another. Douglas et al. (Reference Douglas, Ortinau, Hoertel and Leidy2013) found that consuming a snack of Greek yogurt (with 24 g. protein) reduced hunger, increased fullness, and delayed further eating in healthy women when compared to lower-protein snacks. Women, especially postmenopausal women, require more calcium, which dairy products, including yogurt, provide, to combat bone loss that occurs when bone breakdown exceeds formation (ODS 2019). Although there were not differences in consumption of Greek yogurt specifically for women and men, higher percentages of respondents with an income over $50,000 purchased yogurt. Based on their results using a cross-sectional analysis and Neilson data, Davis et al. (Reference Davis, Blayney, Muhammad, Yen and Cooper2010) proposed that price and consumer income were the main drivers of yogurt demand.
Although fewer respondents purchased Greek yogurt most commonly in this study, Greek yogurt accounts for around 45 percent of dollar sales for the yogurt industry (Watson Reference Watson2019). Both Greek and traditional yogurt were purchased by more respondents as individual yogurt cups when compared to large tubs. Considering the percentage of respondents who consume yogurt as a snack (which may be outside the home), purchasing the portable version makes sense. Additionally, higher percentages of respondents used tubs of yogurt (either Greek or traditional) in recipes when compared to individual cups. Yogurt naturally contains calcium and potassium and is often fortified with vitamin D, all nutrients listed as nutrients of concern in Dietary Guidelines of America (Webb, Donovan, and Meydani Reference Webb, Donovan and Meydani2014). The incorporation of yogurt in recipes may be due to its health benefit, but further research would be needed to understand respondents’ reasoning behind the incorporation of yogurt in their diet. Heat treating, which prolongs the shelf life of yogurt (Speck Reference Speck1977), kills the beneficial live and active yogurt cultures (NYA 2019). Additionally, heat treating also inactivates lactase, which renders the previously edible yogurt inedible by those with lactose intolerance (Speck Reference Speck1977). Likely due to the benefits associated with non-heat treated yogurt, and the prevalence of non-heat treated yogurt in the marketplace, few respondents purchased heat treated yogurt of any kind.
Only 14 percent of respondents looked for animal welfare improving information, which was interesting considering a positive WTP was found for what some believe are animal welfare improving practices, requiring pasture access, and not permitting dehorning/disbudding. In the SUR, looking at animal welfare labeling was not statistically significant for either WTP for required pasture access or WTP for not permitting dehorning/disbudding. More research is needed to determine how consumers are getting the information needed to consciously select credence attributes of dairy cow production systems. It is possible that consumers research brands prior to shopping or are influenced by commercials that promote credence attributes for specific brands or products. Bonanno (Reference Bonanno2013) found that brand loyalty played a big role in the demand for functional (health enhanced) yogurt.
Thirteen percent of respondents had reduced yogurt consumption due to animal welfare/handling concerns in this study, similar to the 12 percent of respondents who had altered their general dairy consumption due to animal welfare concerns found by Widmar et al. (Reference Widmar, Morgan, Wolf, Yeager, Dominick and Croney2017). Despite many respondents not changing their consumption patterns, the mean level of agreement that confining dairy cow/cattle indoors decreases welfare was slightly lower than neutral 3.96 and was of greatest concern when compared to the other practices studied. Widmar et al. (Reference Widmar, Morgan, Wolf, Yeager, Dominick and Croney2017) asked respondents to indicate on a scale from 1 (extremely negative impact) to 7 (extremely positive impact) the impact of dairy production attributes, including access to pasture (mean score 5.6), tail docking (mean score of 3.8), and dehorning on the welfare of dairy cattle (mean score of 3.8). Required pasture access and dehorning/disbudding not permitted had positive estimated mean WTP for traditional and Greek yogurt in this analysis. Despite differences in the Likert scale results, there were no statistically significant differences between the WTP for required pasture access or dehorning/disbudding not permitted for either yogurt type. For these particular products, being concerned about the production practice did not result in increased WTP in the SUR, illustrating how researchers should be careful when interpreting the implications of different preference elicitation methods. Similarly, Ochs et al. (Reference Ochs, Wolf, Widmar and Bir2019) found differences between Likert scales, forced ranking, and best-worst scaling when studying U.S. resident perceptions of laying hen welfare. Lagerkvist (Reference Lagerkvist2013) proposed that differences found between best-worst scaling and Likert responses may be due to a lack of topic knowledge on the part of respondents.
Consumers were willing to pay a positive amount for both required pasture access and dehorning/disbudding not permitted for both traditional and Greek yogurt. Similarly, Olynk and Ortega (Reference Olynk and Ortega2013) found positive WTP for pasture access in both ice cream and yogurt, and Olynk, Tonsor, and Wolf (Reference Olynk, Tonsor and Wolf2010) found positive WTP for pasture access in fluid dairy milk and pork chops. Although cows prefer to be in the barn during certain weather conditions, given free choice, pasture access helps reduce mastitis and improve lameness problems (Von Keyserlingk et al. Reference Von Keyserlingk, Rushen, de Passillé and Weary2009). In the U.S. Department of Agriculture's National Animal Health Monitoring System Dairy 2014 report, 94.3 percent of dairy operations surveyed disbudded or dehorned their heifer calves. One method to avoid the need to dehorn calves is to select for polled (naturally hornless) cattle. Thompson et al. (Reference Thompson, Widmar, Schutz, Cole and Wolf2017) estimated the costs of incorporating polled genetics into a breeding program to range from $0 to $26/head. Determining if making such changes is economically profitable for dairy farms is difficult, as the main product is fluid dairy milk, which is a component of various dairy products for which respondents may have varying WTP for dehorning/disbudding not permitted. Being male decreased WTP for both pasture access and dehorning/disbudding not permitted. Increased female concern for farm animal welfare is well documented in the literature and was also found by Morgan, Croney, and Widmar (Reference Morgan, Croney and Widmar2016), Vanhonacker et al. (Reference Vanhonacker, Verbeke, Van Poucke and Tuyttens2007), and McKendree, Croney and Widmar (Reference Mckendree, Croney and Widmar.2014).
Studies have been mixed regarding the health effects of high-fructose corn syrup; however, while studying rats, Bocarsly et al. (Reference Bocarsly, Powell, Avena and Hoebel2010) found that high-fructose corn syrup resulted in a higher weight gain when compared to rats consuming the same amount of calories with less high-fructose corn syrup. A simple Google search indicated that consumers concerned with health are worried about high-fructose corn syrup with such headlines as “8 ‘health’ foods that contain high-fructose corn syrup”, “23 surprising foods with high-fructose corn syrup”, and “Top 7 foods with hidden high-fructose corn syrup” (Elliott Reference Elliott2016; Eat this, not that! 2016; Donsky Reference Donsky2019). All of the mentioned lists include yogurt, many of which include tips for purchasing yogurt without high-fructose corn syrup. WTP for labeled free of high-fructose corn syrup was statistically significant for Greek yogurt but not for traditional yogurt. The difference between traditional and Greek yogurt is mainly protein content. Perhaps those respondents who primarily purchased Greek yogurt are more concerned about health-related attributes as opposed to other attributes such as taste.
Respondents had a preference for low-fat traditional and Greek yogurt when compared to nonfat, as demonstrated by the negative WTP for nonfat yogurt. In Greek yogurt, higher fat content results in increased firmness and denseness, with full-fat yogurts characterized by the highest levels (Desai, Shepard, and Drake Reference Desai, Shepard and Drake2013). The industry is beginning to push higher fat content yogurts into the marketplace with some success (Watson Reference Watson2019), although low-fat and nonfat options made up the bulk of what was available in stores in 2019. Increased fat content in “light” products can mitigate the negative lingering taste of aspartame, which is often used to decrease caloric count (King, Lawler, and Adams Reference King, Lawler and Adams2000). Interestingly, purchasing 2 percent, 1 percent, or fat-free dairy milk was not a statistically significant indicator of yogurt fat content preference for either traditional of Greek yogurt in the SUR models. Consumers have a preference for reduced-fat/low-fat milk when compared to whole and nonfat milk, with high consumption of 2 percent reduced-fat milk (WMMB 2017; Harwood and Drake Reference Harwood and Drake2018; Bir et al. Reference Bir, Widmar, Wolf and Delgado2019); however, these preferences are not emulated in their WTP for fat content in yogurt.
The mean response to the level of agreement that the production practices docking tails, confining dairy cattle, and dehorning and disbudding of dairy cattle reduced dairy cattle welfare was closer to very strongly agree than very strongly disagree. Additionally, respondents had a positive willingness-to-pay for pasture access and dehorning/disbudding not permitted. Together, these results indicate that at least some people are willing to pay for these production changes. However, simply changing production practices does not mean that dairy producers will receive a premium. Milk produced by dairy producers can be made into many different products or sold as fluid milk. Although a positive mean WTP for the production attributes has been found in Greek and traditional yogurt, previous studies have suggested the same is unlikely across all dairy products (Olynk and Ortega Reference Olynk and Ortega2013), and the amount respondents were WTP differed between the two yogurt products evaluated here. Contrasting between yogurt producers/brands interested in producing yogurt with labeled pasture access required or dehorning disbudding not permitted would likely be necessary to incite change. Individual dairy farms must evaluate if potential premiums would be enough to change production practices and remain profitable.
Alternatively, legislation could be passed that may change production standards regarding pasture access or dehorning. Due to the political preferences of individuals regarding the level of government intervention, having a preference for animal rearing practices and voting for such practices in ballot initiatives may not be correlated. Further research would be necessary to determine if people who have a preference for these practices are also willing to vote for legislative changes. This work does show that consumers have a positive mean WTP for pasture access and dehorning for regular and Greek yogurt products in individual cups, but this cannot be translated to preferences more generally in the marketplace or regulatory environment.
Conclusion
Yogurt, an understudied dairy product, was purchased by a high percentage of survey respondents (61 percent). Differences were found between the demographics of those who did and did not purchase yogurt. For example, a statistically higher percentage of women (65 percent) purchased yogurt for their own consumption when compared to men. Although Greek yogurt has risen in popularity, traditional yogurt was still commonly purchased by more respondents, 39 percent of all respondents commonly purchased traditional yogurt, while 22 percent of respondents commonly purchased Greek yogurt. Greek yogurt which has higher protein levels than traditional yogurt, is sold in different sized containers than traditional yogurt, and is priced higher.
It has been established in the literature that WTP can differ for the same attributes in different products, even if they are made from the same or closely related ingredients. This research differs from previous studies by customizing the WTP experiment that respondents participated in based on the type of yogurt they commonly purchase. Respondents were assigned to the choice experiment for the yogurt type, either traditional or Greek, they most commonly purchased. Those who were not purchasers of either product were randomly assigned to one of the choice experiments, but in the analysis, those who were not yogurt shoppers were found unable to be pooled with shoppers, indicating that being an experienced buyer impacted buying behaviors exhibited. Consumers had a positive WTP for required pasture access and not permitting dehorning/disbudding for traditional and Greek yogurt. Respondents were WTP a positive amount for labeled free of high-fructose corn syrup for Greek yogurt, but not traditional yogurt. Respondents were not willing to pay a positive amount for nonfat when compared to low-fat in traditional or Greek yogurt, as demonstrated by the negative WTP for nonfat yogurt. A SUR was employed to better understand the relationship between demographics, shopping behavior, preferences, and WTP for Greek and traditional yogurt. Looking at animal welfare labeling was not statistically significant for either WTP for required pasture access or WTP for dehorning/disbudding not permitted, indicating research is needed to determine how consumers are selecting credence attributes. For Greek and traditional yogurt, being concerned about dehorning/disbudding or pasture access as evaluated in a Likert scale, did not result in increased WTP in the SUR. This exemplifies why researchers should be careful when interpreting the implications of different preference elicitation methods.
Conflict of interest
The authors declare no conflict of interest in this publication.
Funding Statement
This data collection effort was made possible by Jim and Neta Hicks and the USDA National Institute of Food and Agriculture, Hatch project IND00044133.
Appendix A. Verbiage seen by consumers participating in WTP choice experiment for Greek yogurt
The next portion of this survey presents you with hypothetical Greek yogurt purchasing scenarios that you could face in a retail store where you typically shop. The two products that will be presented in each scenario possess the same characteristics (e.g., similar color, brand, flavor, etc.) except for varying levels of the attributes presented below. Prices vary for each product.
For each scenario, please select the 5.3 oz cup of Greek yogurt that you would purchase, or neither, if you would not purchase either Greek cup of yogurt. For your information in interpreting alternative cups of yogurt:
Typical single-serve Greek yogurt cups are 5.3 oz in size. Thus, price refers to the cost per 5.3 oz cup of Greek yogurt: $0.72 per cup $1.00 per cup $1.29 per cup
Animal welfare attributes
Pasture access refers to the ability of dairy cattle to access grass pasture and not be confined solely to indoor production facilities
– Required pasture access means the animal was raised on an operation providing animals with access to grass pasture
– Pasture access not required indicates that no claims regarding access to grass pasture are being made
Dehorning/disbudding refers to the removal of horns/horn buds to insure dairy cows do not have horns
– Dehorning/disbudding not permitted means the animal was raised on an operation that does not dehorn/disbud cattle.
– Dehorning/disbudding permitted indicates that no claims regarding dehorning are being made
Product attributes
High-fructose corn syrup is a modified corn syrup that has an increased amount of fructose made from the enzymatic conversion of glucose and that is widely used as a sweetener
– Labeled free of high fructose corn syrup means the product does not contain high fructose corn syrup
– No high fructose corn syrup labeling claim means that no claims regarding the use of high fructose corn syrup are being made on this product
The amount of fat in yogurt depends on the type of milk the yogurt is made from
– Nonfat indicates the yogurt is made from skim milk and contains less than 0.5% milkfat
– Lowfat indicates the yogurt is made from skim milk and contains between 2% and 0.5% milkfat
The experience from previous surveys is that people often state a higher willingness to pay than what a person actually is willing to pay for the good. It is important that you make your selections like you would if you were actually facing these choices in your retail purchase decisions, noting that allocation of funds to these products means you will have less money available for other purchases.
Verbiage seen by consumers participating in WTP choice experiment for Traditional yogurt
The next portion of this survey presents you with hypothetical traditional yogurt purchasing scenarios that you could face in a retail store where you typically shop. The two products that will be presented in each scenario possess the same characteristics (e.g., similar color, brand, flavor, etc.) except for varying levels of the attributes presented below. Prices vary for each product.
For each scenario, please select the 6 oz cup of traditional yogurt that you would purchase, or neither, if you would not purchase either traditional cup of yogurt. For your information in interpreting alternative cups of yogurt:
Typical single-serve traditional yogurt cups are 6 oz in size. Thus, price refers to the cost per 6 oz cup of traditional yogurt: $0.40 per cup $0.79 per cup $1.14 per cup
Animal welfare attributes
Pasture access refers to the ability of dairy cattle to access grass pasture and not be confined solely to indoor production facilities
– Required pasture access means the animal was raised on an operation providing animals with access to grass pasture
– Pasture access not required indicates that no claims regarding access to grass pasture are being made
Dehorning/disbudding refers to the removal of horns/horn buds to insure dairy cows do not have horns
– Dehorning/disbudding not permitted means the animal was raised on an operation that does not dehorn/disbud cattle.
– Dehorning/disbudding permitted indicates that no claims regarding dehorning are being made
Product attributes
High-fructose corn syrup is a modified corn syrup that has an increased amount of fructose made from the enzymatic conversion of glucose and that is widely used as a sweetener
– Labeled free of high fructose corn syrup means the product does not contain high fructose corn syrup
– No high fructose corn syrup labeling claim means that no claims regarding the use of high fructose corn syrup are being made on this product
The amount of fat in yogurt depends on the type of milk the yogurt is made from
– Nonfat indicates the yogurt is made from skim milk and contains less than 0.5% milkfat
– Lowfat indicates the yogurt is made from skim milk and contains between 2% and 0.5% milkfat
The experience from previous surveys is that people often state a higher willingness to pay than what a person actually is willing to pay for the good. It is important that you make your selections like you would if you were actually facing these choices in your retail purchase decisions, noting that allocation of funds to these products means you will have less money available for other purchases.
Appendix B. Correlation between individual equations in the seemingly unrelated regression models
Correlations between individual equations in the seemingly unrelated regression for Greek yogurt
Correlations between individual questions in the seemingly unrelated regression for traditional yogurt


 Open access