


Experience in conducting research and writing research papers is an important learning outcome in most universities, across departments.Footnote 1 A particular research challenge in the social sciences is that students typically are not involved in ongoing research projects as part of faculty labs; therefore, they have to start research assignments from scratch each semester. This often is done based on qualitative analysis of secondary sources; however, in the digital age, computerized content analysis provides a feasible and attractive option for undergraduate students to contribute original data within the confines of a typical semester- or quarter-long course.
Computerized content analysis is the process of leveraging technology to transform text into data. In the past, the need for sophisticated software skills to access large text datasets and to utilize them statistically had largely relegated computerized content analysis to the domain of specialized researchers. However, the growing availability of textual data and user-friendly software has made computerized content analysis a technique that is accessible for use in undergraduate political science courses.
This article presents a framework for teaching computerized content analysis based on available resources and the analytical goals of a particular student project. We first discuss how content analysis allows students to make an authentic, original contribution through text-based data collection and analysis in a course research paper. We structure the article around a content-analysis assignment, following in order the steps of producing a student paper using computerized content analysis. Second, after describing the assignment, we outline various sources of texts appropriate for social-scientific analysis that are accessible to students. Third, we address coding by explaining the distinctions between human and computer coding as well as precoding and postcoding as a way to design undergraduate research projects. Fourth, we review various software packages for different content-analysis techniques, which are available to and appropriate for students’ general skill level. Fifth, we discuss issues related to data presentation and write-up of content-analysis assignments. Throughout, we provide examples from our own teaching and highlight methodological learning opportunities that arise from both the strengths and weaknesses of computerized content analysis.
USING CONTENT ANALYSIS IN AN ORIGINAL RESEARCH ASSIGNMENT
Before delving into the specifics of a content-analysis assignment, two caveats are necessary. First, it is helpful to discuss the differences between content and discourse analysis. Although some have strong views on this distinction, we take a pragmatic approach and define content analysis as simply the systematic analysis of texts.Footnote 2 This systematization often is accomplished by following specific coding rules—that is, looking for and counting the usage of certain words or phrases—and using computer programs from ordinary word-processing search functions to more sophisticated programs. However, in its elementary form, content analysis can be accomplished by a human being reading and systematically counting or recording some aspect of a text. Discourse analysis often is concerned with deeper meaning, beyond counting words, and some practitioners might reject a positivist methodology. However, we think that to some extent, all content analysis must include attention to the meaning behind words or it risks becoming merely a counting exercise. Therefore, students must give some thought as to why they are using content analysis for research purposes (Benoit Reference Benoit and Bucy2010; Neuendorf Reference Neuendorf2016; Neuendorf and Skalski Reference Neuendorf, Skalski, Abdelal, Johnston, Herrera and McDermott2009; Prasad Reference Prasad2008; Wiedemann Reference Wiedemann and Wiedemann2016).
The second caveat is that any content-analysis–based research assignment must begin with a research question. This may seem obvious, but without a research question providing a goal for the analysis, looking for certain words is simply a measurement exercise (e.g., find every instance of the terms “North Korea” and “Canada” in US State of the Union speeches). Contrast that exercise with similar exercises grounded in empirically testable research questions. For instance, is there a difference in how often allies versus enemies are referenced in US State of the Union speeches? Counting mentions of North Korea and Canada can demonstrate that allies are almost never mentioned by name whereas enemies are. Knowing this, we can quantify which states are enemies simply by analyzing named-state references in the speeches, as Hymans (Reference Hymans2006) did in his work on nuclear ambitions.
Discourse analysis often is concerned with deeper meaning, beyond counting words, and some practitioners might reject a positivist methodology. However, we think that to some extent, all content analysis must include attention to the meaning behind words or it risks becoming merely a counting exercise.
With these two caveats in mind, we can illustrate a content-analysis–based research assignment. Because we are introducing a new method to students, we think it is best if the assignment is structured in stages—submitted throughout the course with feedback at each stage—rather than as a single final assignment. In our own courses, we follow a learning-by-doing pedagogical strategy in which we assign readings on content analysis and discuss them in class. We then have students complete a short two-page measurement assignment that consists of four parts: (1) formulating a research question; (2) finding a relevant source of digitized text; (3) analyzing the text using a publicly available content-analysis software package; and (4) writing a description of the analysis. The result is an abbreviated version of the final paper that students will find difficult to do. Therefore, we think it should be a small percentage of their grade (e.g., 10%) to ease the stress of trying something new outside of their comfort zone. However, by doing this all at once at the beginning of the course, students will get a sense of all of the components, and the instructor can use mistakes and oversights in the assignment as teaching opportunities.
After providing feedback on the measurement assignment, we proceed to the stages of the final paper, which consists of three paper plans followed by a final paper. The three paper plans focus on (1) formulating a research question and hypotheses (based on existing work) that can be addressed using content analysis; (2) choosing appropriate text sources and preparing them for analysis; and (3) devising a plan for coding and using computer software for the analysis.
FINDING TEXTS FOR CONTENT ANALYSIS
Texts suitable for content analysis can be obtained from numerous sources typically available to students via the university library or the internet. Newspaper databases are perhaps the most common and easiest to access, with a plethora of databases with options for the mass downloading of articles for analysis. For students interested in American politics, Readex, Proquest, and Newspaper Source Plus each have a database of American newspapers, at the national and regional level, as far back as the seventeenth century. For students working on comparative politics and international relations, sources of foreign newspapers include the Irish Newspaper Archive, Yomidas Rekishikan (Japan), Integrum and Westview (both for former Soviet states), and Proquest’s database of English-language newspapers from China.
Full texts of government meetings and treaties are another available source for students. For example, proceedings and full-text opinions of US Supreme Court cases are available in electronic form from various online databases. Hein Online boasts a full-text database of international treaties, and the United Nations Treaty Collection contains all multilateral treaties deposited at the UN. Fully searchable texts of the entire US Congressional Record are available from Congress.gov; Hansard Corpus contains the same for the British Parliament since 1803. Institutional websites from universities, government agencies, political candidates, and NGOs also represent a major source of information that can be analyzed to understand policy positions. The free availability in digitized form of these original documents is an amazing opportunity for students to work with primary sources using their laptops.Footnote 3
The drawbacks of such data sources also provide pedagogical opportunities. For instance, instructors can emphasize that the newspapers in the database may not be representative of all newspapers in a country, much less the opinions of the population. Circulation data (i.e., number and demographics of subscribers and the geographic reach of distribution) can be suggested as a way to consider the biases that exist in particular sets of newspapers. In addition, directing students to newspaper databases from different countries about the same events or topics is a valuable hands-on tool for demonstrating government influence on the media. For example, we developed a module in which undergraduates conduct word-count analyses of several thousand newspaper articles to identify the differences in how the issue of nuclear power is discussed in both China and the United States.
For instance, instructors can emphasize that the newspapers in the database may not be representative of all newspapers in a country, much less the opinions of the population. Circulation data (i.e., number and demographics of subscribers and the geographic reach of distribution) can be suggested as a way to consider the biases that exist in particular sets of newspapers.
Large datasets, or “big data,” provide another opportunity for students to think about selection bias. To effectively work with textual big data, they must understand at least one key distinction in big-data collections: are they general texts such that the students want to know what is being said about a certain topic, or are they specific texts that students already know address a certain topic and they want to know how it is done? These two broad types of data require different coding approaches to avoid students’ efforts producing nothing but noise.
As an example of the first type of dataset, it is feasible for students even at this stage to acquire the full text of every newspaper article published in the United States in a given year. This is general text applicable to an infinite number of subjects; as such, it requires rigorous precoding to target the variables of interest rather than simply measure the general trends of the text. An example of the second type of dataset is the subset of newspaper articles that mention taxes. Although at face value, this dataset is more useful for researching a specific research question (such as tax policy), it has a more subtle problem about which students should be encouraged to think.
It is tempting for students to approach this second type of dataset as a basis for generating measures of how taxes are discussed. However, because the subset of data being examined was selected on the basis of the dependent variable (i.e., something related to taxes), there are problems of selection bias if students are trying to understand what was discussed in general and of external validity if they are trying to draw inferences from the sample. It may be true that some of the significant results would be the case for any topic. It is important to run identical content analyses on random samples of general texts to serve as a control or baseline to ascertain that the results are driven by the variables of interest. This illustrates for students many of the conceptual skills necessary for the comparative method on an intuitive level without necessarily being statistical in nature.
Social media is an exciting source of text data for students. Twitter is a particularly good source because the company has opened its data to various application programming interfaces, which allow programmers to build software that searches and downloads data en masse. Tweets are fully searchable for only about two weeks before being archived, but the immediate nature of the data makes it ideal for providing analyzable text on current events. The Chorus Project provides a simple graphical interface for searching and downloading tweets for students to generate their own corpus of text data for their particular project (Brooker, Barnett, and Cribbin Reference Brooker, Barnett and Cribbin2016). We supervised undergraduate independent-study projects using this technique in which students collected tweets in real time for analysis in their research papers on subjects such as abortion rights in America and South Korean presidential elections.
Social media data can be problematic methodologically for content analysis, which again introduces an excellent teaching opportunity regarding its usage. For example, tweets are at most 280 characters and therefore must be grouped together for analysis. This forces students to consider the implications of what their unit of analysis should be: treating all tweets from a single user as one unit of text or doing the same for times or dates may yield different results based on context. Students also could be encouraged to consider whether tweets are representative of the overall population and how they might identify and compensate for bias.
Finally, after a source has been identified and downloaded, the text must be prepared for further analysis. A key step is creating files suitable to the software that will be used; in addition, the student researcher must give considerable thought to how hypotheses might be tested with such data—specifically, what type of content to look for in the data.
CODING
In general, there are two categories of content analysis: human and computer. Whereas the former is more attractive to students (i.e., the only barrier to entry is their ability to read all of the texts) and this article focuses on introducing the latter, it is important for students to understand the advantages and disadvantages of each category in designing their own research project.
A human coder can code with more nuance than software in two ways. First, humans can read subjective meaning into the subtext of a piece, recognizing sarcasm, layered meanings, and cultural references that simply cannot be programmed into computer software regardless of its complexity. This type of coding might be called discourse analysis to distinguish it from simpler forms of content analysis, as discussed previously. Second, the capacity for subtlety possessed by human coders also is useful for coding semantically complicated constructions. For instance, it is a simple (and relatively objective) process for a human coder to read a paragraph and identify whether it is positive or negative with regard to the political issue discussed. Yet, the semantic richness of language makes this relatively simple task unreliable even with sophisticated software.
However, the drawbacks of human coding also should be emphasized to students. A “back-of-the-envelope” calculation can give students a rough idea of the limitations of human coding. The average American reads at a rate of approximately 250 words per minute, approximately the same length as a half-page of a single-spaced text. If we assume that individuals can code as fast as they can read, then a human coder will code no more than about 30 single-spaced pages per hour. This is an impressive if unrealistically quick pace, but it pales in comparison to the size of large text datasets. The US Congressional Record, for instance, typically generates between 15,000 and 30,000 pages in a single session, which would take even an ideally efficient coder years of full-time work to manually code—much longer than a typical student’s semester-long research project!
The initial challenge of undertaking a content-analysis project can be daunting for students: choosing the wrong word lists or the wrong texts to code can lead to weeks of wasted effort with nothing to show for it as the semester deadlines loom. Uncertainty about the correct way to proceed can lead to “analysis paralysis,” in which a project is never started because students cannot evaluate which route to take. Computerized content analysis, with the efficient ability to code mass amounts of texts, allows for a trial-and-error approach. Rather than being forced to commit to a coding strategy up front, students can explore different approaches and learn from the data.
Precoding versus Postcoding
It also is important for students to distinguish between precoding and postcoding. Content analysis takes place in three steps: conceptualizing what to look for in the text, coding the text, and analyzing the results. When most of the work is done on the conceptualization side, it is precoding; when most of the work is done on the analysis side, it is postcoding.
An example is a student hypothesizing that “welfare queen” is a pejorative and symbolically meaningful term and thus fruitful to search for in political speech. The student could search for the term in speeches by different politicians to get a sense of their views on welfare, hypothesizing that anti-welfare politicians would use the term whereas pro-welfare politicians most likely would not. In this case, conceptualization has accomplished much of the work; computer-aided content analysis will simply carry out the program. A drawback of precoding that should be emphasized as a general methodological lesson is the potential for introducing researcher bias and omitted variable biases. That is, it is a hands-on lesson for how students’ preconceived ideas of which words to search for can tangibly affect the results—whether through their own unconscious bias or ignorance of additional terminology.
However, when a student does not have a firm idea of which terms to search for and anticipates focusing on results of the content analysis to find patterns, this is postcoding. An example in this case is a student wanting to know the reasons that politicians give for supporting a particular welfare bill. For example, to analyze “earned income tax credit” in congressional speeches, a computer can easily produce statistics on word-count frequencies and which incidences of words seem to correlate with one another, effectively showing what the text looks like in the dataset when that term is discussed. This can lead to surprising results—correlations that are logical once they are seen but were not anticipated in advance. In one sense, this is more of a bottom-up approach—that is, looking at the content to figure out what to look for in the content.
To a certain degree, all content-analysis projects use both precoding and postcoding. We can neither run content analysis completely blindly and do all the thinking after the fact nor plan for every contingency and have the content analysis produce precisely what we envisioned in advance. However, we can determine whether we have enough information to front-load the effort of interpretation or whether we do so after the content analysis. Students should be particularly encouraged to take advantage of the efficiency provided by computerized content analysis to approach their projects iteratively: precode their best guesses, use postcoding to learn what they were wrong about, and then rerun analyses with a new round of precoding.
Dictionaries
Once students have a sense of concepts to be analyzed and have developed a plan for terms to search for, the next step is to create “dictionaries.” Dictionaries—essentially researcher-provided lists of words for the software to look for—are an important part of precoding and can be created by the researcher; however, several pregenerated dictionaries on various topics also are available in some software packages.
A potentially time-consuming aspect in creating dictionaries is the issue of “tokenization,” which is creating a single term from a phrase that includes spaces. This might be necessary because some software programs only allow for searches of single terms (e.g., “postcommunism” versus “post communism”). Moreover, some texts may use different styles; therefore, the same term might be rendered differently across texts. For example, if the idea were to find all references to “post communism” for a paper about the different meanings of “Eurasia” in scholarly work, then manipulation of the text (i.e., find and replace phrases with spaces with a single term—e.g., “post communism” becomes “post+communism”) might be necessary to ensure that all instances of the concept are found. Otherwise, different terms may need to be put in one dictionary (e.g., “post-communism,” “postcommunism,” and the tokenized “post+communism”).
Beyond the issue of tokenizing, there may be reason to create a dictionary with an aggregate concept—for example, Lantinx terms, which include specific subterms such as Hispanic, Latino, and Chicano (or their roots, Latin- and Chican-) so that the disaggregated terms can be chosen and the aggregated category observed. Developing dictionaries is directly related to the operationalization of concepts in analysis and therefore must be done in accordance with the theoretical goals of a project.
One problem to be aware of is the possibility of bias introduced by the researcher in the selection of terms for the dictionary. That is, a word list assumes that the researcher knows the “correct” words to search for, but if omitted words have a systematic relationship with the variable of interest, then significant bias can be introduced. For example, if a researcher conducted content analysis on social media texts to evaluate economic concerns of different demographic groups using economic-topic dictionaries that did not include the particular economic slang used by youths, any results would be predictably biased. Whether students create their own or use preconstructed dictionaries, instructors should ensure that they are aware of their assumptions.
SELECTING SOFTWARE
The most common computer-aided content analysis is the counting of words and their relative frequencies in texts. The word clouds that appear on many blogs and websites function using the same basic premise—that is, creating visualization by making the font size a function of the word frequency. Two such tools are Wordle and WordItOut, which allow a user to upload a text to the website and then have it rendered as a word cloud. For example, this article’s five most commonly used words are “content,” “analysis,” “students,” “text,” and “data.” This method is mainly visualization, works without dictionaries, and typically makes no theoretical claim other than showing the most frequently used words. More advanced word-counting software packages include Yoshikoder, KH Coder, Textanz, and WordCruncher. Table 1 summarizes these software packages and lists their website addresses.
Table 1 Summary of Content-Analysis Software

It is worth highlighting Yoshikoder in particular, which—in addition to providing relatively advanced functionality—has an interface sufficiently intuitive that we use it as required software for our undergraduate and graduate courses. The software has prompts for loading plain-text files and provides a simple interface for building hierarchical dictionaries of terms. Yoshikoder provides three main tools that we encourage our students to use: word frequencies, dictionary reports, and concordances. Word-frequency reports are perhaps the simplest tool, allowing students to obtain a list of all words that appear across all selected documents, as well as the number of times each occurs and the percentage of total words represented. This report then can be exported to Excel, where students can sort, graph, and compare results among documents. Dictionary reports apply the dictionary created by students (i.e., at its simplest, a short list of specific words identified as important to their research question) to generate a word-frequency report limited to the dictionary terms, which again can be exported for analysis in Excel. Concordances allow students to see how a chosen word from a dictionary is used in context in selected texts, listing every instance along with the surrounding sentence. This is important because it gives students a tangible sense of the use of these words in addition to numerical reports.
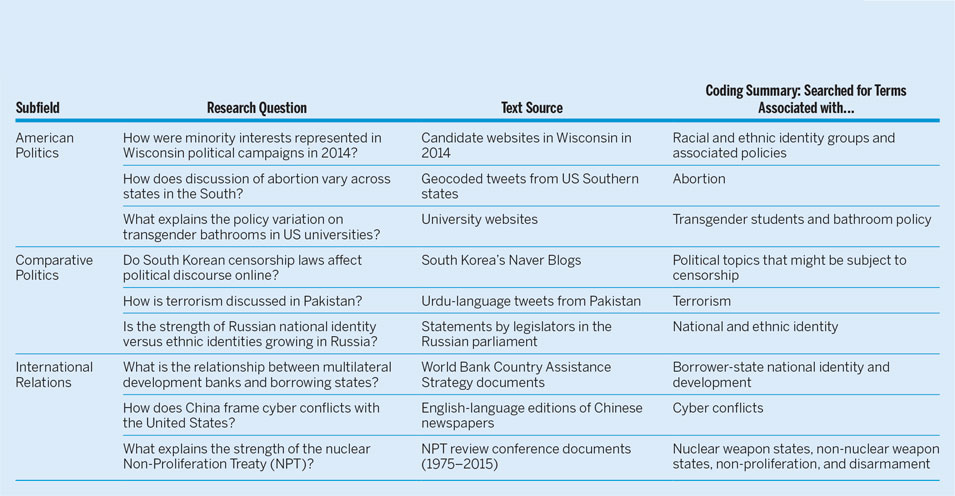
Table 2 summarizes a sampling of actual research projects undertaken in our undergraduate courses. Each content-analysis project used Yoshikoder to analyze large bodies of text from various sources across multiple political science subdisciplines and substantive areas. Students tackled research questions of their own design on topics as varied as dialogue about abortion in American social media and discourse about terrorism in South Asia. Although most of these projects dealt in English-language sources, students with appropriate skills produced research in many other languages, including East Asian languages. This demonstrates the flexibility of Yoshikoder’s use in the classroom and highlights its strength in engaging with international undergraduate students. By being language neutral, these techniques give students tools they can use on text sources from their own linguistic context while still embedded in a foreign-language classroom context. That is, students who speak foreign languages can use those skills in research and students who work only in English also can use English-language sources. This increases engagement and improves learning outcomes by ensuring that multilingualism is a methodological strength.
Table 2 Completed Student Research Projects in the Authors’ Courses
One nuance of word-counting software to highlight for students is the problem of how words are counted in the software. In any language, there are a substantial number of different versions of the same word—for example, different verb tenses and noun cases. When doing word-frequency analysis, we ideally want our software to be sufficiently intelligent to know that “jump,” “jumped,” and “jumping” are the same word rather than counting each separately and diluting them statistically. The problem is even worse with languages that support declension of nouns and adjectives. For instance, a Russian noun can have as many as 10 different forms depending on how it is being used in a sentence; an adjective can have several dozen forms depending on gender and number.Footnote 4 Sophisticated content-analysis packages are sufficiently intelligent to trim words down to their base to avoid this problem (this technique is called “stemming” and must be rewritten for the logic of the language being processed). However, this feature is not part of the more user-friendly software that we expect students to use. Instructors should explain the problem and encourage students to be careful in searching for various word endings or alternate spellings of keywords as necessary.
Finally, one issue with word-frequency analysis is that it reports the most common words used in various texts that are, in fact, the most common words in the language in question. For example, word-frequency analysis of almost any English-language text will find that “the,” “but,” “a,” and similar words are used most frequently. More sophisticated software packages will screen out these words based on a “stop word list,” which defines those so common to a particular language that they are semantically meaningless. However, students should be aware of this issue and consider screening out semantically neutral words from either the output statistics or the inputted text before running the content analysis.
Human-coded content analysis tends to require more sophisticated software on the interface side (although not necessarily in what is happening “under the hood”). Software must be user friendly and intuitive so that students can be guided easily through the process of hand-coding texts. This class of software streamlines the process of human coding by displaying texts, directing the user to searched-for keywords established in the precoding process, and prompting for various coding responses. This includes the abilities to enter commentary for coding determined in the precoding process to be subjective, to highlight blocks of text as relevant to the content analysis, and to assign codes to blocks of text from menus. For example, in the previous example that analyzed discourse about welfare recipients, the precoding process might include setting up a set of tags (i.e., positive, neutral, and negative) that the human coder must assign to given blocks of text. MAXqda and NVivo are the two leading software packages for human coding; although they are proprietary, they are frequently available via university IT-shared resources.
Finally, we think it is important to encourage students to put effort into their data presentation and write up of results following content analysis.
A growing area of content analysis is automated topic identification, which uses advanced statistics to allow algorithms to mimic the subjectivity of human coders. This area of research employs Bayesian topic modeling in conjunction with Latent Dirichlet Allocations (LDA) to use the frequency of words and their proximity to one another in texts to create statistical probabilities that certain texts are related to other texts (and therefore are part of the same “topic”). This technology lends itself especially well to postcoding, with minimal precoding assumptions. If, for example, we have a set of newspaper articles about welfare policy but we are not confident in our ability to precode word dictionaries or instructions for human coders, we can use automatic topic analysis to generate groupings of the texts along with the most statistically significant words in each topic. This is a classic postcoding design because it leaves most of the interpretation to after the coding step. As discussed previously, this also can be the prelude to a second round of content analysis using human coders or more refined word-frequency analysis, using this analysis as the precoding for that step.
Unfortunately, automated topic analysis is currently only supported in libraries for statistical packages such as R, with no user-friendly graphical interfaces. To demonstrate the possibilities of these approaches, students can be directed to the foundational Quinn et al. (Reference Quinn, Monroe, Colaresi, Crespin and Radev2010) article for an accessible walkthrough using LDA to automatically classify individual speeches by topic in the US Congressional Record. In addition, advanced students can be directed to Cranshaw and Yano (Reference Cranshaw and Yano2010), Gerrish and Blei (Reference Gerrish and Blei2011), Grimmer (Reference Grimmer2010), Schrodt (Reference Schrodt2011), and Yano, Cohen, and Smith (Reference Yano, Cohen and Smith2009) for applications of LDA to political science problems. Students with R fluency can be referred to the TM package, which is a mature and streamlined package for using these techniques (Feinerer and Hornik Reference Feinerer and Hornik2017).
DATA PRESENTATION AND ANALYSIS
Finally, we think it is important to encourage students to put effort into their data presentation and write up of results following content analysis. Programs such as Wordle are explicit data-visualization tools (e.g., options for colors, fonts, and shapes) and can be included in a paper to illustrate the most frequent terms in a text. In addition, data can be input to Excel or a similar program to create tables and figures.Footnote 5 We have found that by asking students in the initial assignment to describe their results, they will produce a range of examples of good and bad data presentation, which can be discussed in class. In addition to the presentation of results in tables and figures, , content analysis requires a return to the theoretical question and hypotheses. It is worth emphasizing this point so students do not lose sight of their research goal in the context of the substantial work required for the content analysis.
CONCLUSION
Computerized content analysis can be a daunting prospect, with a multitude of potential tripping points and several different strategies and approaches. However, with the framework presented in this article for approaching text selection, coding, software choices, and data presentation, students can be equipped to design and deploy their own computerized content-analysis projects, providing an opportunity for original research contributions in undergraduate papers.


