


Introduction
Gelifluction is the dominant process of sediment transfer on many periglacial slopes (Reference WashburnWashburn, 1973; Reference Harris, Anderson and RichardsHarris, 1987), but field-based process studies are often severely hampered by problems of instrumentation in remote and climatically hostile environments and by the long period of time necessary to quantify annual variability. In addition, a large number of site-specific field studies are necessary in different settings with respect to climate and soil conditions in order to provide quantitative analyses. Thus, although field validation remains critically important, laboratory simulation experiments in which model boundary conditions and soil properties are precisely controlled, and instrumentation and logging is relatively straightforward, may allow rapid progress in understanding relevant process variables.
Full-scale laboratory simulation studies of gelifluction processes carried out in the Centre National de la Recherche Scientifique cold laboratories in Caen, France, by Reference Harris, Davies and CoutardHarris and others (1995, Reference Harris, Davies and Coutard1997) demonstrated the potential of physical modelling under controlled laboratory conditions. In these studies, thaw rates, pore-water pressures and soil-movement rates for one specific slope geometry (12° slope) and two different soils were monitored. Equivalent data have, to date, not been collected in field studies. However, each of the two tests took 2 years to complete. Thus, multiple modelling at full scale, to investigate the effect of soil type, slope geometry or thermal regime on movement styles and rates, requires a major commitment of time and resources. In this paper we report on a new approach to the investigation of periglacial mass-movement process that takes advantage of dimensional and temporal scaling laws associated with centrifuge modelling. The principal objective is to compare results of scaled centrifuge modelling in an elevated gravitational field with the full-scale modelling at one gravity in the Caen laboratories.
Centrifuge modelling described here forms part of a larger-scale test programme funded by the European Union (EU) project ˚Permafrost and Climate in Europe" (PACE) and designed to investigate a range of mass-movement processes associated with thawing of frozen ground. To date, seven test series have been completed on slopes of different gradient and soil type. This paper presents results of test series 2, in which the 12° full-scale Caen experiments were simulated at 1/10 scale in the centrifuge.
Centrifuge Scaling Laws
Stress/strain behaviour of granular soils is highly non-linear, stress-level dependent and stress-history dependent. Accurate scale modelling therefore requires (a) similitude between material properties in prototype and model, and (b) the correct stress distribution within the model. If a model is constructed at 1/N scale using soil from the prototype (providing similitude in soil properties), and tested under an enhanced gravitational field equivalent to N gravities, stress similitude between model and prototype may be readily demonstrated. In the prototype and model, self-weight stress at a given depth equals the product of depth, density and gravitational acceleration. In the model, depth is reduced by the scaling factor N, but acceleration is increased by the same scaling factor N, giving similitude in stress between prototype and model. The centrifuge allows the modeller to approximate the required increased gravity field by generating a centrifugal acceleration given by:
where g is the acceleration due to the Earth’s gravity τ is the representative radius of the model from the axis of rotation, ω is the angular velocity of centrifuge rotation and N is the number of gravities. Selected scale factors for geotechnical modelling are presented in Table 1.
Table 1. Selected scale factors for centrifuge modelling (after Reference Ketcham and BlackKetcham and Black, 1995)
In assessing the results of centrifuge modelling, it is important that potential time-scaling conflicts are considered. In this case, experiments were designed to model soil shearing on thawing slopes. An analytical framework is provided by the thaw-consolidation ratio (Reference Morgenstern and NixonMorgenstern and Nixon, 1971), which is governed by the rate of thaw penetration and the rate of seepage of excess meltwater. It can be seen from Table 1 that time for seepage force similarity and for heat transfer both scale as 1N2. Conceptually, in the case of water seepage, the reason for this is that in a 1/N scale model accelerated at N gravities, the hydraulic gradient is increased by a factor of N whilst the flow-path length is decreased by N. This has been proved rigorously by Reference Coce, Pane, Znidarcic, Yo, Olsen, Schiffman and CraigCoce and others (1985). Similarly, for heat conduction in a 1/N scale model with thermal boundary conditions identical to the full-scale prototype, the thermal gradient is increased by a factor of N and the heat-flow path length reduced by N. The analysis of Reference SavidouSavidou (1988) has demonstrated rigorously that the time-scale factor for heat transfer by conduction and ad-vection through a soil body scales at 1/N2. Thus, no scaling conflicts arise in centrifuge modelling of the thaw-consolidation process, and time-scales are reduced by a factor of N2 compared with the full-scale prototype.
Above the water table, where capillary processes dominate, capillary pressures and suction gradients in silty soils may be accurately modelled provided the gravitational field is no higher than approximately 50 gravities (Reference Konig, Rezzoug, Heibrock, Craig, Davies and BurkhartKönig and others, 1998). The present tests were performed at ten gravities, so no scaling conflicts are anticipated. The same soil material was used in both the full-scale prototype laboratory experiments and the scaled centrifuge model, and similitude in constitutive behaviour is therefore anticipated. Non-linear elasticity and plasticity can therefore be modelled with no scaling conflicts. Where viscous behaviour is likely, however, as is the case here, care must be taken in interpreting modelling results with respect to the prototype since time-scale conflicts will arise. The time-scaling factor for viscous force similarity is 1, whereas, as discussed above, that for thaw-consolidation processes is 1/N2 The significance of this is discussed later in this paper in the context of the observed soil shear strains.
Experimental Method
Centrifuge facility
The Cardiff geotechnical centrifuge facility comprises a beam centrifuge of radius 2.8 m capable of accelerating a model package with a mass of up to 1000 kg at an acceleration of 100 gravities. The test package is contained within a strongbox of external dimensions approximately 750 mm × 550 mm × 500 mm built of steel with sides formed from 50 mm thick sheets of Perspex.
Model construction
The centrifuge model consisted of a planar 12° slope formed by placing a 70 mm thick layer of the test soil over an inclined sand substrate (Fig. la). The test soil was the same as that used in the Caen full-scale experiment and consisted of a fine sandy silt with plastic limit 18%, liquid limit 31 % and plasticity index 13%. During soil placement, thermocouples and Druck miniature pore-pressure transducers were installed in two strings through the model in the upper and lower mid-slope (Fig. la). At each monitored location, three pore-water transducers and thermocouples were installed at nominal unfrozen depths of 10, 30 and 50 mm, with additional thermocouples at the soil surface and at the base (70 mm depth). Depth values for all transducers are nominal, since frost heaving during freezing resulted in an increase in soil thickness and therefore depth from the surface, while consolidation during thaw progressively reduced soil thickness and transducer depth once again. The sand substrate allowed entry of water from a constant head device to the test soil during freezing, and provided a stable reference surface for measuring frost heave and thaw settlement of the test soil. Following placement, the model container was tilted so that the slope surface was horizontal, and the test soil was saturated from the base and finally consolidated for 24 hours under a stress of 3.8 kN nT2 (Fig. la). This surcharge is equivalent to the self weight of the soil at a model-scale depth of approximately 20 mm (200 mm depth at prototype scale). Following consolidation, the slope profile was measured against a fixed datum along three transect lines.
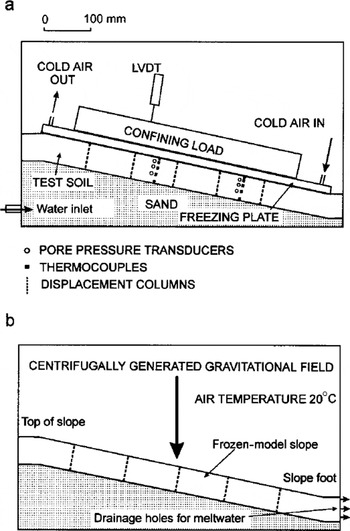
Fig. 1. (a) Freezing the centrifuge model. The polypropylene container was encased in polystyrene insulation during this process. LVDT, linear variable differential transformer, (b) Thawing the model in the centrifuge at ten gravities. For clarity the transducers are not shown in this diagram.
Surface movement was monitored using 10 mm diameter plastic discs placed in four lines across the soil surface. In addition, columns of small plastic cylinders 5 mm long and 5 mm in external diameter were inserted through the soil to record downslope displacement profiles at the end of the test series. Two rows of five columns were installed (Fig. 2). Cylinders were threaded over a rod, and inserted into a previously augered hole perpendicular to the slope surface. The rod was then withdrawn, leaving a column of markers through the soil aligned perpendicular to the slope surface, but free to move downslope with the soil during the succeeding test.

Fig. 2. Configuration of markers used to record surface and subsurface soil movements.
Model freezing
The model slope was covered with a protective plastic sheet, and a steel freezing plate placed on the surface. The plate was hollow and contained copper radiator pipes through which cold compressed air supplied from vortex tubes was passed. In operation, the plate surface temperature was –10°C, so model freezing was from the slope surface downwards. The plate was loaded to apply a vertical stress of 3.8 kN m–26 during freezing, and the phreatic surface was maintained immediately above the sand layer, in the base of the test soil. During freezing, the model base and sides were insulated with polystyrene. Soil freezing took approximately 2 days, and when frozen, the slope profile was remeasured along the three previously measured transects to give frost-heave values across the model.
Model testing
The frozen model was placed in the centrifuge strongbox within an insulated gondola, and thawed under a centrifugal acceleration of ten gravities. A flow of warm air (approximately 20°C) was directed across the surface of the model to promote thawing from the surface downwards. Drainage holes in the footslope end-wall were opened to allow dissipation of water expelled during thaw consolidation (Fig. lb). During centrifuge flight, acceleration is directed perpendicular to the base of the container, i.e. in an identical orientation to gravity in the full-scale prototype (Fig. lb). All sensors were monitored continuously during centrifuge flight, and data recorded at 30 s intervals via a Campbell Logger located in the centrifuge central control box. Data transfer to the centrifuge control room is via slip rings to a personal computer. The top surface and one side of the model (viewed through the Perspex side of the strongbox) were observed during flight by miniature video cameras, and a video record of each test was made from each of these camera feeds. Frame grabbing from the resulting videotapes allows movement of surface markers and thaw settlement to be monitored throughout each test.
The model was frozen on the laboratory floor and then thawed at ten gravities in the centrifuge four times, and surface displacements noted after each thaw cycle. Finally, excavation of the displacement columns revealed the profiles of accumulated soil movement.
Results
Frost heaving
Average heaving ratios (frost heave/frozen thickness) are shown in Table 2 and compared with similar data from the Caen prototype experiment. Heaving ratios were similar, but slightly greater in the centrifuge tests (0.217 vs 0.209). The centrifuge model was, at prototype scale, more than twice the thickness of the Caen model (700 mm vs 300 mm), so there was clearly potential for deeper shear strain and larger surface displacements in the scaled model.
Table 2. Heaving ratios in centrifuge model and Caen full-scale model
Soil temperatures
Thermal data from the fourth thaw cycle are presented in Figure 3, as an example of typical thermal regime during thaw. A prolonged ˚zero curtain" effect can be seen and corresponds to the progressive phase change of soil ice during which heat flux largely supplies latent heat. During this period the pore-pressure transducers recorded strongly negative values (soil water suction), as occurred during the Caen experiment (Reference Harris and DaviesHarris and Davies, 1998). During the four centrifuge thaw periods, with frozen soil thickness of 837–928 mm at prototype scale, the thaw period lasted 7.4–8.7 h, equivalent to 740–870 h at prototype scale (scaling factor 100, equivalent to N 2 where N is the number of gravities). This gives an average thaw penetration rate of 1.06–1.25 mm h"1 at prototype scale (average 1.16 mm IT1). In the Caen full-scale model experiment, soil thawing between the surface and the lowermost temperature sensor in the seven thaw cycles lasted 208–410 h (see Reference Harris, Davies and CoutardHarris and others, 1997, fig. 3). With a frozen-soil thickness of 309–325 mm, this indicates thaw rates of 0.79–1.56 mm IT1 (average 1.08 mm IT1). Thaw penetration rates in the centrifuge model were therefore slightly higher on average than in the Caen full-scale model, but fell within the range of values reported in the Caen experiment.
Fig. 3. Soil temperatures in centrifuge test 2.4.
Pore-water pressures and soil-moisture status
During thaw consolidation of an ice-rich soil, part of the overburden stress may be transferred to the pore water, resulting in raised pore-water pressures. The effective stress within the soil mass is then reduced, leading to a loss of frictional strength. Reference Harris, Davies and CoutardHarris and others (1995) demonstrated that during thaw of the full-scale Caen gelifluction model, pore-water pressures were raised above hydrostatic, though not sufficiently to cause rapid slope failure. Pore-water pressures recorded during the second thaw period of the centrifuge experiment (test 2.2) are presented in Figure 4, together with an example of pressures recorded during thaw cycle 5 of the Caen full-scale experiment.
Fig. 4. Pore-water pressures recorded during thaw: (a) centrifuge test 2.4; (b) Caen full-scale experiment, thaw cycle 5.
The data clearly demonstrate a similar style of pore-water pressure change in both cases, though recorded pore pressures were somewhat higher in the centrifuge model. The negative pressures immediately prior to thaw record suctions developed within the partially frozen soil during phase change (Reference Harris and DaviesHarris and Davies 1998). Following thaw, pore-water pressures rose, then gradually fell during the consolidation period, and were less than hydrostatic by the end of each test.
Soil surface displacements
The displacements of plastic markers following each centrifuge thaw cycle are shown in Table 3. The maximum rate of surface movement occurred in a mid-slope location in the first two thaw cycles, but in the final two tests (2.3 and 2.4) movement rates decreased downslope, probably reflecting a slight reduction in basal slope gradient as sediment accumulated in the footslope zone. A strong relationship between surface movement rates and frost heave has been demonstrated in the full-scale Caen model (Reference Harris, Davies and CoutardHarris and others, 1997). Although only four cycles of freezing and thawing were undertaken in the centrifuge test series, this relationship is apparently maintained when the centrifuge data are scaled to prototype (scaling factor xl0) (Fig. 5)
Table 3. Displacement of surface markers in PACE series 2, tests 1–4
Fig. 5. Relationship between frost heave for each freeZe-thaw cycle and corresponding downslope surface movement, in the scaled centrifuge experiment and the Caen full-scale experiment.
Profiles of soil movement
Field studies have shown that gelifluction is generally associated with shear strain throughout the moving soil layer, the rate of movement increasing towards the surface (e.g. Reference WilliamsWilliams, 1966; Reference BenedictBenedict, 1970; Reference HarrisHarris, 1981; Reference Harris, Davies and CoutardHarris and others 1997; Reference Matsuoka, Hirakawa, Watanabe and MoriwakiMatsuoka and others 1997; Reference MatsuokaMatsuoka, 1998). Excavation of the buried columns following four thaw cycles proved highly effective in determining subsurface profiles of soil movement. One example from the series of five columns installed along the centre line of the model is presented in Figure 6a. The observed profiles were remarkably similar to those reported from field studies and to the profiles observed in the full-scale modelling experiments in Caen (Fig. 6b). However, the 300 mm thick Caen model restricted the depth of gelifluction compared both to field measurements and to the centrifuge model described here.
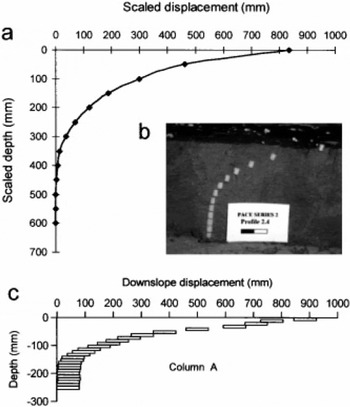
Fig. 6. (a) Scaled profile of soil movement from the mid-slope centre line of the centrifuge model after four cycles of freezing and thawing, (b) Displacement column at model scale from which (a) was drawn. The scale is 20 mm long. Each plastic cylinder is 5 mm long, (c) Profile of soil movement in the Caen full-scale model after seven cycles of freezing and thawing. The column was formed of 80 mm × 40 mm × 10 mm unglazed tiles.
Discussion
Rates of surface gelifluction movement of >200mma –1 have been reported in field studies (e.g. Reference CaineCame 1968), though 5–25 mm a"1 is typical. In the model experiments described here, surface movement averaged 24 mm per thaw cycle, which scales to 240 mm at prototype scale and is more than double the rate observed in the Caen prototype model (average 106 mm per thaw cycle). Clearly the simulated surface movements were at the upper range of annual gelifluction rates observed in the field.
The higher surface-soil displacements observed in the centrifuge model compared to the Caen prototype are probably largely a function of model thickness. The scaled thickness of the frozen-soil profile in the centrifuge model was more than twice that of the Caen prototype, resulting in additional increments of soil displacement at depth. The similarity in relationship between frost heave and surface displacements for the centrifuge model and the Caen prototype shown in Figure 5 suggests that mechanisms of downslope shear strain of the thawing soil were similar in the centrifuge scaled model and in the full-scale prototype. The close correspondence in heaving ratios and rates of thaw penetration should be noted. In the field, unlike both models discussed here, many gelifluction slopes are vegetated, and a vegetation mat is likely to reduce near-surface movement rates (e.g. Reference HarrisHarris, 1981).
Field studies have suggested at least two possible mechanisms of periglacial solifluction: (a) ratchet-like frost creep resulting from heave perpendicular to the slope followed by vertical resettlement (Reference WashburnWashburn, 1967), and (b) water-saturated flow (Canada. National Research Council, 1988). Since frost creep depends purely on frost heave and slope geometry, it will scale correctly in the centrifuge model. Assuming vertical resettlement, this accounts for approximately 20% of observed movement in the centrifuge model. The remainder must be attributed to other processes. If these are dominantly viscous in nature, the similarity in displacement profiles between the centrifuge model and Caen prototype, and generally higher rates of soil movement in the former, is at first sight somewhat surprising. This is because, as noted earlier, viscosity does not scale in centrifuge models (e.g. Reference Ketcham and BlackKetcham and Black, 1995). Time for thaw consolidation is reduced by a factor of 1/N2, so the time available for viscous flow in the model is also reduced by this factor. Therefore, at a given stage in a centrifuge test, observed displacements should be 1/N2 those of the prototype at the same stage. Since this was clearly not the case here, it implies that viscous-flow processes were not dominant in this experiment and that the observed displacements resulted from time-independent frictional flow rather than time-dependent viscosity. Further centrifuge experiments are in progress to investigate whether this counter-intuitive observation is generally valid.
Conclusions
The experiment described here is the first time that thaw-related slope processes have been investigated through scaled centrifuge modelling. The PACE series 2 gelifluction tests, with dimensional scaling 1/10, undertaken in a gravitational field equivalent to ten gravities, have successfully demonstrated the effectiveness of the centrifuge technique, and further tests using different slope geometries, soil types and thaw rates offer the potential for detailed quantitative investigation of the influence of environmental and site-specific variables on gelifluction rates. Similitude in slope-surface geometry and soil properties between the scaled centrifuge model and the earlier Caen full-scale experiment, and scaling of rates of thaw penetration in the centrifuge model, allowed comparisons to be made. The greater thickness of the centrifuge model, however, contributed to higher soil-movement rates compared with the Caen prototype.
A consideration of centrifuge scaling laws indicates a scaling conflict between thaw-consolidation processes and viscosity-controlled flow processes. However, the centrifuge tests reported here successfully reproduced the pre-failure shear strain in thawing soils commonly referred to as gelifluction. It is concluded, therefore, that strain was not caused by viscous fluid flow, but rather by time-independent plastic deformation.
Field validation is currently underway in Finse, Norway, where thermal conditions, pore-water pressures and surface soil displacements are continuously monitored. Further centrifuge experiments to investigate the influence of slope geometry, rates of thaw and soil constitutive properties are also in progress, with the ultimate objective of formulating a predictive model of gelifluction processes.
Acknowledgements
This research was undertaken as part of the EU PACE research project (DG-XII contract ENV4–CT97–0492). Technical assistance from I. Henderson is gratefully acknowledged.


