


Introduction
A comprehensive overview of several methods for measuring snow hardness is given by Reference Pielmeier and SchneebeliPielmeier and Schneebeli (2003a). Snow hardness was first determined using the Swiss rammsonde (Reference Bader, Haefeli, Bucher, Neher, Eckel and ThamsBader and others, 1939). The rammsonde is driven by a mechanical hammer which is dropped by the observer from a previously defined height. Several other measurement techniques, like the snow resistograph (Reference BradleyBradley, 1966), the digital resistograph (Reference Dowd and BrownDowd and Brown, 1986), modified by Reference Brown and BirkelandBrown and Birkeland (1990), and the electric cone penetrometer (Reference Schaap and FöhnSchaap and Föhn, 1987), have also been developed. While the snow resistograph can provide only a graphical plot on paper, the digital resistograph can store 25 profiles. The electric cone penetrometer records data with a battery-powered portable chart recorder. These instruments make it possible to obtain profiles more quickly than with the rammsonde. However, none of these methods were developed further. At the end of the 1990s the Swiss SnowMicroPen (SMP) was introduced by Reference Schneebeli and JohnsonSchneebeli and Johnson (1998). Advantages of the SMP are the high operating speed and the possibility of also detecting very thin layers in the snowpack. Measurements with the rammsonde and in particular with the SMP are used to some extent for operational services.
The hand hardness test, unlike the rammsonde and the SMP, is carried out in a horizontal direction. It was introduced by Reference De Quervainde Quervain (1950), is used regularly by practitioners and can be applied without special equipment. It is a subjective penetration test (Reference Pielmeier, Schneebeli and StevensPielmeier and Schneebeli, 2002) and involves pushing objects of different dimensions into snow. According to the International Classification of Seasonal Snow on the Ground (ICSSG-1990, Reference ColbeckColbeck and others, 1990; ICSSG-2009, Fierz and others, in press), snow hardness is divided into five levels (without ice); the hand hardness test provides only an index value of snow hardness.
Horizontal measurements of snow hardness (by means of a force gauge) were carried out by Reference Takeuchi, Nohguchi, Kawashima and IzumiTakeuchi and others (1998) using a push–pull gauge. They used one attachment with a diameter of 14 mm (which corresponds to the size of a finger). However, their investigations did not include hand hardness tests. Reference Sato, Abe, Kosugi and NoguchiSato and others (2002) investigated snow hardness by using a portable load gauge and compared the results with those gained by the Kinosita-type hardness meter.
The relationship between hand hardness and measurements with penetration instruments (rammsonde, SMP) was analysed by Reference Schneebeli and JohnsonSchneebeli and Johnson (1998) and Pielmeier and Schneebeli (Reference Pielmeier, Schneebeli and Stevens2002, Reference Pielmeier and Schneebeli2003b). These papers show a sufficient correlation between the several test methods. The ICSSG-1990 includes a table which provides ranges for the force of the Swiss rammsonde, the order of magnitude of strength and the corresponding index of the hand hardness. The penetration force in the ICSSG-1990 is stated to be about 50 N. One of the co-authors of the ICSSG-1990 considers a penetration force of 50 N as the upper limit for the hand test (personal communication from H. Gubler 2009); the common force should be 10–20N. Reference McClung and SchaererMcClung and Schaerer (2006) state that 15 N is used in North America. Reference Geldsetzer and JamiesonGeldsetzer and Jamieson (2000) applied an empirical equation to estimate the hardness for the different hand hardness indices. Their tests involved slightly modified objects (greater cross-sectional areas, because gloves were used for the hand hardness test) and a force of 10–15 N. The ICSSG-2009 suggests a penetration force of 10–15 N. However, it would be necessary to use an increasing force (last column of Table 1) to press into the snow a smaller object which would be needed for penetration of a harder layer. The increase in force, which is the product of the cross-sectional area of the objects (column 2) and the magnitude of strength (column 4), is shown in the last column of Table 1; the corresponding force rises from 4 N for hardness index 1 (fist) to 39 N for hardness index 4 (pencil).
Table 1. Size of the applied attachments and corresponding force based on the magnitude of strength given by the ICSSG
Despite having several shortcomings (no definition of the size of the objects, no defined penetration depth), the hand hardness test has never been investigated more precisely. Moreover, it has not been compared with any other objective test procedure in the horizontal direction, even though it is often used in the field. Therefore, the main task of this study was to measure the hardness by means of an objective method which can be applied in the same direction (horizontal) as the hand hardness test, and which is capable of delivering accurate data for the hardness of snow.
Methods and Measurements
The measurements were carried out at the experimental site of the Department for Natural Hazards in the Wattener Lizum (47809’56’’ N, 11838’02’’ E), about 35 km from Innsbruck, Austria. The observation site is situated at about 2000 ma.s.l. and is not affected by skiers. The relevant snow hardness measurements for this study were undertaken in the winters of 2007/08 and 2008/09. A few tens of snow profile tests were carried out; almost all different types of snow were represented (except very low-density snow, ice and firn).
In February 2009 some additional tests were carried out in an oversized snow pit; in particular, hardness profiles were recorded. The snow hardness was determined with the hand hardness test and a digital push–pull gauge; for purposes of comparison the SMP was used. The hand hardness test was carried out according to the ICSSG-2009. The test uses objects of decreasing areas: fist (1), four fingers (2), one finger (3), pencil (4), knife (5). For any single layer of the snowpack, hand hardness index corresponds to the first object that can be pushed gently into the snow, thereby not exceeding a penetration force of 10–15N (ICSSG-2009). The hand hardness indices were subclassified (1, 1–2, 2… 4–5, 5). The subclasses 1–2, 2–3, 3–4 and 4–5 were used when the hand test could not be related to one of the relevant main indices. In order to have a more direct reception the hand hardness test was carried out without gloves. As there is no definition how far an object has to be pushed into the snow, a displacement of 1 cm was assumed. The hand hardness tests were accomplished at intervals of 10 cm vertically.
The push–pull gauge (METRON 322) is an electronic device which measures compressive force and consists of a load cell connected to a bolt; when the bolt is pushed, the force is measured and is shown directly on a display. Five different attachments can be connected to the push–pull gauge. The size and shape of each attachment is shown in Figure 1, which also illustrates how the attachments correspond to the equivalent application of the hand hardness test (fist, four fingers, one finger, pencil, knife). While the shape of the fist attachment and four-finger attachment is rectangular, the shape of the one-finger attachment and pencil attachment is circular. Although the different shapes may have some particular effects (stress peaks at the salient angles of the rectangular objects, different transmission of power), it can be assumed that the influence on the measurements is negligible. The main objective was to apply attachments of similar size and shape to those used for the hand test.
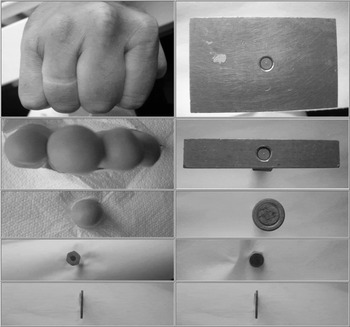
Fig. 1. Objects used for the hand hardness test (fist, four fingers, one finger, pencil, knife) and (right side) corresponding attachments. Attachment size: fist: 80 × 50 mm; four fingers: 50 × 15 mm; one finger: 15 mm diameter; pencil: 7 mm diameter; knife: 1 4 × 1 mm.
Figure 2 shows the push–pull gauge with the largest attachment (fist) during a measurement. The measurements with the push–pull gauge were carried out in the same way as described in the previous paragraph. In each case the maximum value was recorded during penetration. All snow hardness tests were conducted with each attachment.
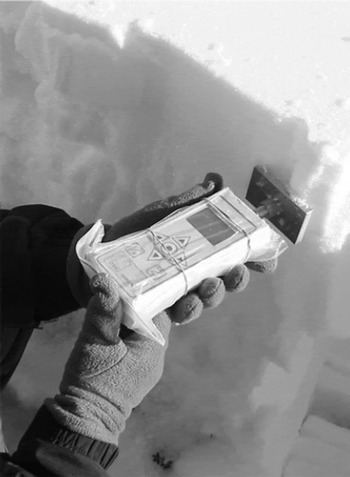
Fig. 2. Push–pull gauge with connected fist attachment.
The SMP consists of a geared drive rod driven by a stepper motor which is used to push a 5 mm diameter cone into the snow (Reference Schneebeli and JohnsonSchneebeli and Johnson, 1998). The instrument records the penetration resistance on a small tip with a vertical resolution of 4 μm and a resolution of 0.005 N and stores the data on a memory card.
For the purpose of comparison the ICSSG-1990 was used. The comprehensive hardness table in the ICSSG-1990 includes ranges for the order of magnitude of strength (compared with the corresponding hand hardness index).
Results
In Figure 3a the force measured with the different attachments of the push–pull gauge is plotted against the hand hardness indices. The grey columns, which are illustrated for the appropriate attachments (e.g. for hand hardness index 2 the grey column is plotted over the four-finger attachment), correspond to the ICSSG-1990 converted into Newtons using the cross-sectional area of the respective attachment shown in column 2 of Table 1.
Fig. 3. (a) Force measured with the different attachments of the push–pull gauge plotted against hand hardness index. Grey columns correspond to the values indicated by the ICSSG-1990 converted into Newtons. (b) Measured force converted to Pascals.
The force needed to push the push–pull gauge 1cm into the snow was dependent on the attachment; considering all retrievals, the average values were about 104 N (26 kPa) for the largest attachment (fist), 66 N (55 kPa) for the four-finger attachment, 43 N (243 kPa) for the one-finger attachment, 25 N (650 kPa) for the pencil attachment and 19N (1353 kPa) for the knife attachment.
A comparison with the values of the ICSSG-1990 (grey columns) shows an acceptable degree of agreement, especially for hand hardness indices 3 and 4. The lower limit of the measurement range of the push–pull gauge is 10 N, so a comparison for indices 1 and 2 is impossible. For hand hardness index 5, only a few measurements are available because of the consistently soft snowpack during the observation period. In Figure 3b the measured force is converted to Pascals.
Figure 4 is based on all the measurements (including all attachments). For each hand hardness index the distribution of the measurements is shown, as well as the respective ranges of the ICSSG-1990 (grey columns); the range of the ICSSG-1990 for hand hardness index 1 is not included because it is below 1 kPa.
Fig. 4. Box plots of the measured force converted to Pascals against hand hardness indices. Grey columns correspond to the values indicated by the ICSSG-1990. The ICSSG-1990 values for hand hardness index 1 are not included because they are below 1 kPa. Boxes span the interquartile range from first to third quartiles, with a horizontal line showing the median. Whiskers show the range of values (min, max).
The median of strength for hand hardness index 1 is approximately 5 kPa and increases to about 1000 kPa (hand hardness index 5). The maxima reach up to 3000 kPa. It must be mentioned that a low force can also cause a high strength, in particular when attachments with a small cross-sectional area (pencil, knife) are used. As shown in Figure 3, the values scatter strongly. The best agreement with the ICSSG-1990 is for hand hardness indices 3, 4 and 5. The increase of the measured strength with increasing hand hardness index is less than proposed by the ICSSG-1990.
The hardness determined by the different measurement methods and the hand test is plotted in Figure 5 for three adjoining profiles (1m apart). The SMP shows the highest vertical resolution and accuracy. Generally the increase of hardness with increasing depth below the surface (in particular down to about 0.6m depth) was detected by all observation techniques, especially in profiles 1 and 2. As a result of the relatively low hardness of the snowpack within the observation period in February 2009, the retrieved force with the pencil attachment and knife attachment was zero.
Fig. 5. Hardness (kPa) determined by the different measurement methods (push–pull gauge and SMP) vs hand hardness test for three adjoining profiles.
Applying the hand hardness test it is possible to describe both the vertical profile and the changes of snow hardness in the horizontal direction (adjoined profiles). For example, at the bottom left of Figure 6 (at about 0.6 m) a harder layer can be seen, which was detected by all methods.
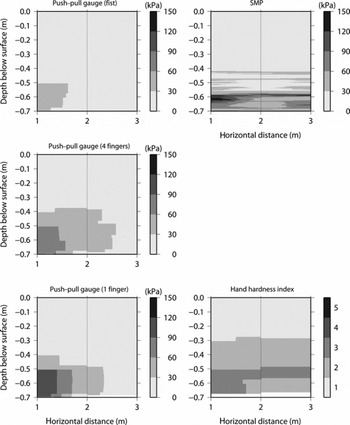
Fig. 6. Two-dimensional illustration of three adjoining profiles. The horizontal interval of the measurements was 1 m.
Discussion and Conclusions
As shown in Figure 3a, the measured values of hardness vary considerably for a given hand hardness index. The range of values was larger for attachments with greater cross-sectional areas. This can be explained by the fact that soft snow (hardness indices 1 and 2) prevailed during the observation period; under these circumstances it was not possible to measure the force with the pencil attachment and knife attachment (measurements below 10 N could not be recorded with the push–pull gauge). On the other hand, measurements with the larger attachments (fist attachment, four-finger attachment) were possible for almost all types of snow (from hardness index 1 to hardness index 4). Moreover it has to be considered that all attachments at a given depth were used for Figure 3a (and not only that attachment which would have been appropriate for the respective layer). Taking into account only the appropriate attachment (e.g. for hand hardness index 2 only the measurements with the four-finger attachment) the variability is clearly less.
Two trends can be identified in Figure 3a. The first is that the higher the index of the hand hardness test the higher is the measured force. This seems to be because the harder the type of snow the higher the force necessary to push an attachment into the snow. The second trend is that within each hand hardness index the measured force decreases with decreasing size of attachment because it needs less power to push an attachment with a smaller cross-sectional area into the snow than a greater attachment.
Considering only the appropriate attachment, there is acceptable agreement with the ICSSG-1990, especially for hand hardness indices 3 and 4 (Fig. 3). The high variability of the values in Figure 4 results from the inclusion of all available measurements (measurements with all attachments).
The ranges of snow hardness (retrieved with all attachments) which are related to the observed hardness indices show some overlap, especially about hand hardness index 2–3. For example, a measured value of 40 kPa indicates a hardness index between 2 and 3 (taking into account only the values within the quartiles). The overlap is smaller for the higher hardness indices. A measured hardness of 200 kPa indicates a hardness index of 3–4 to 4; a measured hardness of 1000 kPa indicates an index of 4–5 to 5. It can be assumed that the estimation of the hardness index is not always appropriate (especially in the lower levels). For example, there is no definition whether the hand test has to be done with or without gloves. Good agreement with the ICSSG-1990 is found for hand hardness indices 3, 4 and 5. For hand hardness index 2 the range indicated by the ICSSG-1990 is below the lower quartile of the measurements; for hand hardness index 1 the ICSSG-1990 values are below the lowest measured value. Because the lower limit of the measurement range of the push–pull gauge is 10 N, retrieved snow hardness of very soft snow was displayed as 0.0 N. Consequently these data were not considered in the study.
In order to obtain comparable data with the hand hardness test, improved instructions for the test would be needed. For example, a specification of the size of the objects and a definition of the penetration depth would be helpful. Some assumptions in this study show possible options.


