


Background
Behavioural activation is a component of cognitive–behavioural therapy that has recently attracted attention for its feasibility and efficacy. Behavioural activation is not only as effective as cognitive–behavioural therapy, but is also less costly.Reference Richards, Ekers, McMillan, Taylor, Byford and Warren1 Specifically, behavioural activation is effective in patients with subthreshold depressionReference Takagaki, Okamoto, Jinnin, Mori, Nishiyama and Yamamura2 and major depressive disorder (MDD),Reference Richards, Ekers, McMillan, Taylor, Byford and Warren1 and can prevent high-risk populations from developing MDD, thus decreasing functional deficits and economic loss due to MDD.
In behavioural activation, individuals repeatedly evaluate their actions and consequences to improve response-contingent positive reinforcement on their own, while being encouraged to increase their engagement in rewarding and pleasurable activities.Reference Takagaki, Okamoto, Jinnin, Mori, Nishiyama and Yamamura2, Reference Lewinsohn, Sullivan and Grosscup3 In our behavioural activation programme, the therapist helps patients to identify activities they can enjoy and that will provide a sense of achievement, and then try these activities as homework in real life, using a workbook. Through these experiments, the therapist teaches patients to pay attention to the results of their actions and they evaluate the consequences of their actions repeatedly. This process helps patients to develop self-monitoring functions and appropriate evaluation of environmental rewards with less biased thoughts. In this manner, patients learn action–outcome contingencies via behavioural activation. Thus, behavioural activation seems to improve motivation because individuals have more opportunities to feel a sense of accomplishment by doing things they hesitated to do because of depression.
Previous neuroscience studies of behavioural activation revealed its influence on extrinsic motivation, which refers to the performance of an activity to attain a desired outcome (e.g. money). Improvement in motivation after behavioural activation is supported by neuroscience studies of MDD and subthreshold depression.Reference Dichter, Felder, Petty, Bizzell, Ernst and Smoski4, Reference Mori, Okamoto, Okada, Takagaki, Jinnin and Takamura5 Dichter et al used a ‘wheel of fortune’ task after behavioural activation in patients with MDD; they reported increased activity in the caudate, middle frontal gyrus (MFG) and superior frontal gyrus (SFG) during reward anticipation and decreased activity in the caudate during win versus control feedback.Reference Dichter, Felder, Petty, Bizzell, Ernst and Smoski4 For subthreshold depression, we reported that the activity of the inferior frontal gyrus (IFG) and angular gyrus during loss anticipation decreased after behavioural activation during a monetary incentive delay task.Reference Mori, Okamoto, Okada, Takagaki, Jinnin and Takamura5 However, behavioural activation should also be considered as an approach to modify intrinsic motivation, which refers to doing something because it is inherently interesting or enjoyable, via psychological mechanisms.Reference Ryan and Deci6
The purpose of this study was to identify the neural correlates of behavioural activation on intrinsic motivation. To verify the influence of behavioural activation on the neural circuit related to intrinsic motivation, we conducted a randomised controlled trial (RCT) on individuals with subthreshold depression, using a stopwatch task.Reference Murayama, Matsumoto, Izuma and Matsumoto7 We focused on the frontostriatal circuit because of its important role in intrinsic motivation.Reference Murayama, Matsumoto, Izuma and Matsumoto7, Reference Marsden, Ma, Deci, Ryan and Chiu8 Previous studies indicated that the following regions are important for intrinsic motivation: the anterior striatum, which is the core of the reward network;Reference Murayama, Matsumoto, Izuma and Matsumoto7 the prefrontal region, including the lateral prefrontal cortex (LPFC),Reference Murayama, Matsumoto, Izuma and Matsumoto7 which is a cognitive/motivational centre involved in the preparation to achieve goals; and the anterior cingulate gyrus,Reference Marsden, Ma, Deci, Ryan and Chiu8 which is a centre involved in post-error processing and behavioural adjustment. Thus, we hypothesised that successful behavioural activation would increase the activity of the anterior striatum, LPFC and anterior cingulate gyrus. Given previous findings that patients with MDD showed abnormal functional connectivity in the frontostriatal circuit,Reference Furman, Hamilton and Gotlib9 we predicted that functional connectivity between the LPFC and anterior striatum would be reduced in participants with subthreshold depression, and that behavioural activation would increase this functional connectivity.
Method
Participants
The participants were recruited over a 2-year period between 2013 and 2014 at Hiroshima University. The ethics committee of Hiroshima University approved the study (Approval number: clinical-408). The trial was registered in the UMIN clinical trials registry (UMIN000011967). Before the study, written informed consent was obtained from all participants. The Beck Depression Inventory II (BDI-II) scores and the Composite International Diagnostic InterviewReference Kessler and Ustun10, Reference Kawakami, Takeshima, Ono, Uda, Hata and Nakane11 were used to recruit freshmen for an RCT of behavioural activation over a 2-year period. The Japanese version of BDI-II is routinely administered yearly to all freshmen, as part of the health check-up conducted by the Health Service Center of Hiroshima University.
The participants that were recruited in the second year participated in this functional magnetic resonance imaging (fMRI) study. A total of 59 individuals were enrolled in the 2014 RCT of behavioural activation. From this group, 29 were allocated to the intervention group and 30 were allocated to the non-intervention group. Participants in the intervention group participated in the RCT of behavioural activation comprising five weekly behavioural activation sessions. The BDI-II score was the main outcome of the RCT. Details of the RCT have been published elsewhere.Reference Takagaki, Okamoto, Jinnin, Mori, Nishiyama and Yamamura2 The intervention group participants were scanned before and after behavioural activation intervention. The non-intervention group participants were scanned twice, with a 5-week interval (i.e. at the same time as the intervention group but without any intervention).
Of the 59 participants, 58 completed 2 days of experiments and had complete fMRI data; one participant in the intervention group failed to complete scanning because of an incidental finding. Of the 58 participants, two were excluded from the analysis: one participant in the non-intervention group initiated psychopharmacological treatment between times 1 and 2, and one participant in the intervention group had missing fMRI data because of scanner problems. Of the 56 remaining participants, two in the intervention group and three in the non-intervention group were excluded from the analysis because of excessive motion (≥4 mm) during scanning. Therefore, data from 25 individuals in the intervention group and 26 individuals in the non-intervention group were analysed.
In addition, the Environmental Reward Observation Scale (EROS) was administered to examine the efficacy of behavioural activation. The EROS is a self-administered questionnaire that subjectively evaluates positive reinforcement associated with an action.Reference Armento and Hopko12 Each questionnaire was completed at baseline (time 1) and after 5 weeks (time 2). The RCT inclusion criteria were 18–19 years of age and a freshman at screening, a BDI-II score of 10 or more according to a previous study,Reference Allart-van Dam, Hosman, Hoogduin and Schaap13 no major depressive episodes within the past year, not undergoing psychopharmacological or psychological treatment and willingness to provide informed consent. Details of the inclusion and exclusion criteria are provided in the Supplementary Methods available at https://doi.org/10.1192/bjo.2018.40.
Clinical measures
Japanese version of the BDI-II
We used the Japanese version of the BDI- II,Reference Kojima, Furukawa, Takahashi, Kawai, Nagaya and Tokudome14 the reliability and validity of which has been confirmed. The original version of the BDI- II, developed by Beck et al,Reference Beck, Steer and Brown15 consists of 21 items on a four-point scale to measure the severity of depression.
Japanese version of the EROS
We used the Japanese version of the EROS, the reliability and validity of which has been confirmed.Reference Kunisato, Takagaki, Okajima, Nakajima, Ishikawa and Kanai16 The original version of the EROS, developed by Armento and Hopko,Reference Armento and Hopko12 consists of ten items on a four-point scale to measure environmental rewards congruent with behavioural theories of depression.
Treatment
The intervention group participated in a treatment programme comprising five weekly behavioural activation sessions conducted by a trained therapist for 60 min per session (Supplementary Methods). The non-intervention group did not receive any treatment, only the pre- and post-assessment. None of the participants received any medication until the study was completed.
Experimental tasks
To explore neural activity associated with intrinsic motivation, the participants performed stopwatch and watch-stop tasks in an fMRI scanner, as described by Murayama et al. Reference Murayama, Matsumoto, Izuma and Matsumoto7 In the stopwatch task, a stopwatch was displayed on a screen. The participants were asked to press a button within 50 ms of the 5 s time point. Responses made within 50 ms of the 5 s were considered a success and a point was added to the total score, which was shown in the upper right corner of the screen. In the watch-stop task, the participants were told to press a button when the stopwatch stopped. In this task, participants did not get any points because success and failure were not distinguished. The tasks were administered once and included 30 stopwatch and 30 watch-stop task trials. The trials were pseudo-randomly intermixed. Before each task, instructions were displayed to indicate which task would be performed next. Directly after the task, the participants were asked to fill out a questionnaire indicating to what extent they enjoyed or felt bored during each task. We used the method given by Elliot et al Reference Elliot and Harackiewicz17 to calculate the Intrinsic Motivation Inventory (IMI) as follows: question 1 (‘I enjoyed the stopwatch task’) score + question 3 (‘The stopwatch task was interesting’) score – question 2 (‘The stopwatch task was boring’) score.
fMRI acquisition
fMRI was performed by a Magnetom Verio 3T (Siemens, Munich, Germany). Details are provided in the Supplementary Methods.
fMRI data preprocessing and statistical analyses
Image processing and statistical analyses were carried out by Statistical Parametric Mapping (SPM12) software (Wellcome Department of Cognitive Neurology, Wellcome Trust Centre, London, UK). Details of the preprocessing steps are provided in the Supplementary Methods. To investigate the cue and feedback effects, two contrasts were calculated: (a) the cue presentation phase (i.e. cue presentation of the stopwatch task versus the watch-stop task); and (b) the feedback phase (i.e. success feedback versus failure feedback of the stopwatch task). The cue presentation phase represents mental preparation and anticipation of the upcoming task. The feedback phase represents the adjusted motivation in response to the former results. The t-maps were transformed into z-scores to create a statistical parametric map for each contrast.
Analysis of neural signals during cue presentation and feedback
We first confirmed brain activation related to stopwatch task feedback and cue presentation versus watch-stop task feedback and cue presentation across all participants at time 1. We then performed a two-sample t-test with the subtraction images (time 2 − time 1) of the first-level contrasts in the cue presentation phase (cue presentation of the stopwatch task versus the watch-stop task) and the feedback phase (success feedback versus failure feedback of the stopwatch task), reflecting the difference between time 2 and time 1 scans to determine whether the behavioural activation intervention resulted in changes to brain activity. The imaging analysis statistical threshold was set at multiple comparisons with a cluster-extent family-wise false positive rate (FWE)–corrected significance threshold of P < 0.05. As we had an a priori hypothesis focused on the anterior striatum, we also performed analysis focused on the anterior striatum region of interest (ROI), which was determined by the bilateral caudate and putamen in the Automated Anatomical Labeling AtlasReference Tzourio-Mazoyer, Landeau, Papathanassiou, Crivello, Etard and Delcroix18 and bounded caudally at y = 0 to include only the anterior parts of the striatum. We report the areas that survived after multiple comparisons at the whole-brain level or ROI analysis.
Individual difference correlation analysis
As a treatment response measure, we calculated BDI-II score change (time 1 – time 2). For the EROS, we calculated the change score as time 2 − time 1. A high score indicated symptom improvement over time.
Changes in activation related to cue presentation, feedback and clinical response were investigated. For each group, we analysed the correlation between the clinical score and the mean values of subtraction images (time 2 – time 1) of the first-level contrasts in each contrast (cue presentation phase and feedback phase); a 6 mm sphere centred on the peak coordinate of the clusters significant at the group level was extracted. Then, Spearman correlation coefficients were calculated within each group, using SPSS statistics 21 software (Chicago, IL, USA), and P < 0.05 was considered statistically significant.
Psychophysiological interaction analysis
We hypothesised that behavioural activation treatment modulates neural circuits; therefore, we used the psychophysiological interaction (PPI) method.Reference Friston, Buechel, Fink, Morris, Rolls and Dolan19 The current PPI analysis was conducted to test behavioural activation-related changes in functional connectivity from the brain region(s) where neural activation was changed after behavioural activation and associated with an improvement of the clinical symptoms. The statistical threshold for the PPI analysis was set at P < 0.05 (cluster-extent FWE-corrected). On the basis of changes in neural activity between times 1 and 2 and correlational analysis, activation of the right MFG changed after behavioural activation, and the changes in the right MFG were associated with an improvement of the clinical symptoms. Thus, we chose the right MFG (peaks at 30, 30 and 36) as a seed region. The seed was set at a 6 mm diameter centred on the peak coordinate. After extracting the time course of the seed region and the psychological vector of interest (weighting stopwatch task cue presentation with 1 and watch-stop task cue presentation with −1), the interaction term was calculated. We included the psychological vector and time course of the seed region as nuisance regressors in the general linear model and calculated the PPI contrast image. For each participant, this procedure generated a functional connectivity map identifying areas where blood-oxygen-level–dependent signal changes were coupled with the seed region as induced by cue presentation. A second-level analysis was then applied to the extracted individual images. To examine the effects of behavioural activation on functional connectivity, we performed a two-sample t-test with the PPI subtraction (time 2 − time 1) contrast between the groups.
Behavioural data analysis
We calculated the response time for the stopwatch task, the success rate of the stopwatch task and IMI score. The response time for the stopwatch task was the time window between cue presentation and button press (approximately 5000 ms). One session consisted of 30 stopwatch and 30 watch-stop trials; therefore, the stopwatch task success rate was the number of successes in the stopwatch task divided by 30. The success rate was not controlled in this task; therefore, the time window for success (5000 ± 50 ms) was determined to be approximately half of the trials in the non-clinical setting sessions to obtain the greatest sense of achievement. Clinical scores were analysed by analysis of variance in SPSS 21, with group (intervention and non-intervention) as the between-participant factor and time (times 1 and 2) as the within-participant factor. A post hoc Bonferroni test was used to examine pairwise differences from the analysis of variance. In all cases, P < 0.05 was considered statistically significant.
Results
Demographic characteristics
Table 1 shows the demographic characteristics of the participants. There were no significant differences in gender or mean age between the intervention and non-intervention groups. All participants were right-handed. There was a significant group × time interaction in the BDI- II scores (F(1, 49) = 11.05, P < 0.002). The mean BDI- II scores of the intervention group at time 2 were significantly lower than those of the non-intervention group. BDI- II scores decreased significantly in the intervention group, whereas there was no significant change in the non-intervention group. For the EROS, there was a significant group × time interaction (F(1, 49) = 6.51, P < 0.014), indicating that the mean EROS scores of the intervention group at time 2 were significantly higher than those of the non-intervention group. Further, the EROS scores increased significantly within the intervention group, whereas there was no significant change within the non-intervention group.
Table 1 Demographic data and symptom profiles

BDI-II, Beck Depression Inventory II; EROS, Environmental Reward Observation Scale; M/F, male/female.
Behavioural results
Supplementary Table 1 shows the behavioural results of the participants. There were no significant main or interaction effects of group (intervention and non-intervention) on response time in the stopwatch task (F(1, 49) = 0.57, P = 0.46), success rate of the stopwatch task (F(1, 49) = 1.75, P = 0.19) or IMI score (F(1, 49) = 0.04, P = 0.84).
Neuroimaging results
Changes in brain activity between time 1 and time 2
We first confirmed brain activation related to stopwatch task feedback and cue presentation versus watch-stop task feedback and cue presentation across all participants at time 1. A one-sample t-test of the cue presentation phase in all participants at time 1 showed activation of a large cluster extending to the bilateral striatum, pallidum and anterior cingulate gyrus brain regions related to motivation. For the feedback phase, the prefrontal region (left IFG, right medial frontal gyrus and left MFG) were activated with a liberal threshold of P < 0.001. We then performed a two-sample t-test with the subtraction (time 2 – time 1) contrast between groups (Fig. 1 and Supplementary Table 2). (Time 2 – time 1) changes in brain activation during cue presentation were significantly different in the right MFG (z = 4.41, P FWE = 0.029), right SFG (z = 4.38, P FWE = 0.01) and anterior cingulate gyrus (z = 4.1, P FWE = 0.044). For the ROI analysis, the left putamen survived (z = 4.02, P FWE = 0.018). The activity of these clusters increased more in the intervention group compared with the non-intervention group between time 1 and time 2 during cue presentation. Of note, the right MFG reportedly closely overlapped with the LPFC in a previous study of intrinsic motivation with the same contrast.Reference Murayama, Matsumoto, Izuma and Matsumoto7 No region survived during the feedback phase in the whole-brain or ROI analyses.

Fig. 1 Functional magnetic resonance imaging results for the cue presentation phase. The activation images (highlighted in yellow) denote voxels with significant group differences (intervention, non-intervention) between time points (time 1, time 2). 1–1. (a) The right middle frontal gyrus (MFG; peaks at 30, 30 and 36; BA8). The red circle denotes MFG. 1–1. (b) Superior frontal gyrus (SFG; peaks at 14, 52 and 34; BA9). 1–1. (c) Anterior cingulate gyrus (peaks at 6, 32 and 24; BA32). The red circle denotes anterior cingulate gyrus. 1–2. ROI analysis of the left putamen (peaks at −20, 14 and 4). The activation increased more in the intervention group than in the non-intervention group. The threshold was set at P < 0.05 at the cluster level for multiple comparisons (1–1). The threshold was set at P < 0.05 at small-volume corrected (1–2). The colour scale represents t-values from 0 to 5. ROI, region of interest; SW-WS, cue presentation phase (cue presentation of the stopwatch task versus the watch-stop task).
Correlational analysis
Fig. 2 shows the significant positive correlations between changes in right MFG activation and the EROS in the intervention group (P = 0.019, ρ = 0.465, 95% CI = 0.086–0.727), whereas the correlation was not significant in the non-intervention group (P = 0.825, ρ = 0.046, 95% CI = −0.348 to 0.426). The positive correlation in the intervention group indicates that the participants with a greater clinical improvement (i.e. activation control after behavioural activation) had more changes in the right MFG. There was no significant correlation between changes in right SFG activation (P = 0.598, ρ = −0.111, 95% CI = −0.485 to 0.2972), anterior cingulate gyrus activation (P = 0.483, ρ = −0.147, 95% CI = −0.512 to 0.2634) and left putamen activation (P = 0.175, ρ = −0.280, 95% CI = −0.608 to 0.1295) and the EROS in the intervention group. There was no significant correlation between changes in these regions and the BDI-II score.

Fig. 2 Relationship between changes in the contrast estimate of the right middle frontal gyrus (MFG; cue presentation phase) between the pre- and post-treatment and changes in the Environmental Reward Observation Scale (EROS) score. There was a significant positive correlation between changes in right MFG activation and the EROS score in the intervention group (P = 0.019, ρ = 0.465, 95% CI = 0.0856–0.7266). The correlation in non-intervention group was not significant (P = 0.825, ρ = 0.046, 95% CI = −0.348 to 0.4258).
Changes in functional connectivity between time 1 and time 2
The results are shown in Fig. 3 and Supplementary Table 3. Whole-brain PPI analyses revealed a single cluster extending to the right posterior cingulate cortex (PCC) that was more functionally connected to the right MFG, in which neural activity increased during stopwatch task cue presentation relative to watch-stop task cue presentation after behavioural activation compared with the non-intervention group (z = 4.5, P FWE = 0.005).
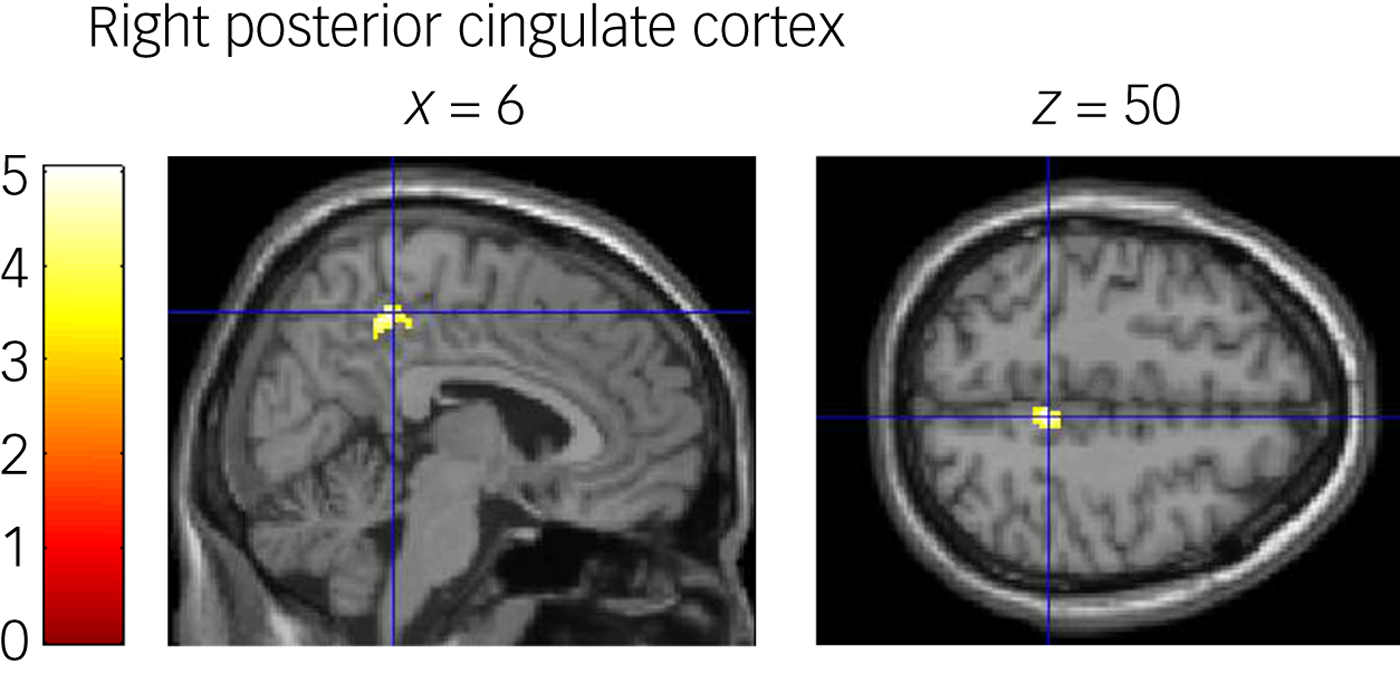
Fig. 3 Psychophysiological interaction (PPI) results for the stopwatch task cue presentation relative to the watch-stop task presentation. The activation images highlighted in yellow denote voxels with significant group differences (intervention, non-intervention) in functional connectivity between time points (time 1, time 2). Functional connectivity from the right middle frontal gyrus to the right posterior cingulate cortex increased in the intervention group compared with the non-intervention group during the cue presentation phase. The colour scale represents t-values from 0 to 5.
Discussion
In this study, we examined neural changes related to successful behavioural activation in individuals with subthreshold depression. We examined people with subthreshold depression in relation to their BDI-II scores (i.e. a BDI-II score of 10 or more).
Our results revealed significant clinical and neural effects of behavioural activation on subthreshold depression. We showed that the activity of the regions related to intrinsic motivation increased during cue presentation in the intervention group compared with the non-intervention group, and that the improvement in subjective sensitivity to environmental rewards was positively correlated with increased right MFG activity. In addition, we observed that functional connectivity between the right MFG and right PCC during cue presentation increased after behavioural activation in the intervention group compared with the non-intervention group. These results indicate that behavioural activation affected intrinsic motivation by increasing functional connectivity between the MFG and PCC in the right hemisphere.
The changes in brain activity between times 1 and 2 support our hypothesis that behavioural activation improves neural intrinsic motivation. The identification of the MFG as an intrinsic motivation-related region in this study is supported by a previous study that used an identical contrast in the same task; the MFG in our study closely overlaps with the LPFC, which was reported as a region for cognitive/motivational preparation for an upcoming task.Reference Murayama, Matsumoto, Izuma and Matsumoto7 The putamen, anterior cingulate gyrus and SFG are parts of the neural reward network.Reference Haber and Knutson20 The putamen has an important role not only in motor planning and execution of movement, but also in non-motor functions such as cognition.Reference Dunlop and Nemeroff21 Because behavioural activation improves cognitive flexibility through behavioural experimentation, it is reasonable that we found a neural change after behavioural activation in the cue presentation phase, which requires cognitive preparation. As our behavioural activation programme was developed as a short-term intervention, cognitive control of an upcoming task, which is a function of the prefrontal region, might have improved initially. We might detect neural changes in the feedback phase if the participants continued behavioural activation independently over a longer period.
Of note, the change in right MFG was activation positively correlated with the EROS after behavioural activation. This might reflect an improvement in cognitive control, (i.e. MFG function); therefore, the participants might have been able to act in a mood-independent manner. Consequently, they might have had more opportunities to receive rewards.
Interestingly, the intervention group exhibited increased connectivity between the right MFG (LPFC) and PCC compared with the non-intervention group, although they did not show changes in connectivity between the LPFC and anterior striatum. The PCC is not only part of the default network, but is also part of the frontoparietal network.Reference Kaiser, Andrews-Hanna, Wager and Pizzagalli22 The cluster detected in our study is located in the dorsal PCC, which is connected with the dorsolateral prefrontal cortex.Reference Margulies, Vincent, Kelly, Lohmann, Uddin and Biswal23 Enhancement of this connectivity after behavioural activation is consistent with the neurocognitive model of depression in which altered communication between a control system (i.e. the frontoparietal network) and the network engaged in internal thought (i.e. the default network) underlies depressive symptoms.Reference Bzdok, Heeger, Langner, Laird, Fox and Palomero-Gallagher24
In addition, the dorsal PCC plays an important role in spatial navigation.Reference Bzdok, Heeger, Langner, Laird, Fox and Palomero-Gallagher24 Behavioural activation intends to increase the likelihood that an individual will engage in pleasurable activities, including going for a walk, exercise and painting, which require spatial navigation. To undertake more of these activities, individuals need to make a precise activity plan of when, how and with whom they will attempt these activities. The connectivity between the PCC and the LPFC might play a role in such cognitive control of spatial information.
Our findings should not be expanded to depression because the focus of our study was subthreshold depression. However, our results were in line with neural changes related to psychotherapy for depression, which suggests an improvement in top–down regulation via the prefrontal region.Reference Linden25 In a systematic review comparing studies on the effects of psychotherapy and drug treatment, IFG and SFG activity increased more with psychotherapy than with antidepressants.Reference Boccia, Piccardi and Guariglia26 Dichter et al reported that MFG activity during a monetary anticipation phase increased more in a behavioural activation group compared with a control group, suggesting behavioural activation-related neural changes in a reward task.Reference Dichter, Felder, Petty, Bizzell, Ernst and Smoski4 We previously reported that IFG activity during loss anticipation increased after behavioural activation.Reference Mori, Okamoto, Okada, Takagaki, Jinnin and Takamura5 Although this study focused on intrinsic motivation, the neural change pattern is in line with previous studies that focused on monetary rewards (i.e. extrinsic motivation).
Several of our findings were contrary to our expectations. We found little evidence of neural change during feedback. This may be explained by several reasons. First, previous studies revealed a dissociation of the mental process during the anticipatory phase from that during the feedback phase in patients with MDD pathophysiology, indicating altered activity that was specific to the anticipatory phase.Reference Stringaris, Belil, Artiges, Lemaitre, Gollier-Briant and Wolke27 If this holds true for subthreshold depression, neural changes after behavioural activation might first appear in the cue presentation phase; the cue presentation phase represents cognitive preparation for an upcoming task, which is equivalent to the anticipatory phase. Second, behavioural activation encourages individuals to select a behaviour of their own preference and to evaluate the consequences of their actions. Repeating this process improves one's ability to predict the results of a chosen action and enhances reward sensitivity.Reference Lewinsohn, Sullivan and Grosscup3 After behavioural activation, the neural changes observed during the cue presentation phase might reflect an improvement in reward anticipation. Finally, contrary to behavioural activation practised in daily life, the tasks were selected for the participants in this fMRI experiment (i.e. forced choice). Murayama et al Reference Murayama, Matsumoto, Izuma, Sugiura, Ryan and Deci28 used a modified stopwatch task to examine whether self-determined choice facilitates prefrontal activation compared with forced choice. Therefore, the participants may not have felt a strong sense of accomplishment during the feedback phase even if they successfully accomplished the task, as the experimental situation was not natural or applicable to their daily lives.
This study had several limitations. First, as we focused on participants with subthreshold depression, we are unable to generalise our findings to patients with MDD. However, neural circuit changes similar to those underlying the efficacy of behavioural activation in patients with subthreshold depression might occur in patients with MDD; the neural circuit changes after behavioural activation observed in our study overlapped with regions related to the intrinsic reward network. Second, we did not include healthy controls in our study; to date, no study specifically focused on intrinsic motivation has investigated neural changes in patients with subthreshold depression versus healthy controls. Further study of healthy controls is required to determine the accuracy of our findings, particularly in individuals without depression.
Although several limitations should be taken into consideration, to the best of our knowledge, this is the first report revealing the neural effects of behavioural activation in terms of intrinsic motivation. These findings provide further understanding of the neural mechanisms underlying the effects of behavioural activation.
Supplementary material
Supplementary material is available online at https://doi.org/10.1192/bjo.2018.40.
Funding
This work was supported by a Grant-in-Aid for Scientific Research on Innovative Areas from Japan Society for the Promotion of Science, JSPS (grants 16H06395 and 16H06399), and grant 23118004 from the Ministry of Education, Culture, Sports, Science and Technology, Japan. This work was partially supported by the programme for Brain Mapping by Integrated Neurotechnologies for Disease Studies (Brain/MINDS) by Japan Agency for Medical Research and Development, AMED (grant 15dm0207012h0002) and Integrated Research on Depression, Dementia and Development Disorders by AMED (grant 16dm0107093h0001).
The funders had no role in the design and conduct of the study; collection, management, analysis and interpretation of the data; preparation or review of the manuscript or decision to submit the manuscript for publication.


 Open access
eLetters
No eLetters have been published for this article.