


INTRODUCTION
Tuberculosis (TB) continues to be one of the major health problems worldwide, especially in low-income countries. Even though TB death rates had dropped dramatically worldwide, further reduction is recommended by the WHO and is one of the millennium goals [1]. Other TB adverse outcomes are of concern as they can aid disease spread and the development of drug resistance. In 2014, the TB incidence rate in Mexico was estimated to be 21 per 100 000 denoting a high burden of the disease nationally [2]. The Mexican state of Tamaulipas has an even higher TB incidence (30 per 100 000) when compared with the national rate [Reference Castellanos3, 4].
There has been an epidemiological transition in the general Mexican population in the last two decades where obesity, metabolic syndrome, and diabetes mellitus (DM) have dominated the country's overall health profile [Reference Barquera5–Reference Stevens9]. According to the International Diabetes Federation, the prevalence rate of DM in Mexico was estimated to be 14·7% in 2015, with Mexico ranking sixth worldwide based on the number of people with diabetes [10]. The growing prevalence of DM poses a challenge for TB control and contributes to a person's risk of developing TB as well as influencing TB treatment outcomes [Reference Leung11–Reference Baker15]. Several studies worldwide show controversial effect of DM on TB adverse outcomes including treatment failure rates and death during the course of treatment [Reference Dooley16–Reference Sulaiman21]. However, prediction of TB adverse outcomes may be imprecise in the context of DM alone. Other factors can individually impact TB outcomes including socio-demographic characteristics. We used predictive modelling to develop a risk score based on risk factors for TB adverse outcomes in the Mexican state of Tamaulipas. Our goal was to develop a simple tool to be used in clinical setting to help identify those at risk of adverse TB outcomes at the time of TB presentation, for a tailored, closer follow-up during their treatment.
The current study utilized TB surveillance data for Tamaulipas between 2006 and 2013 to examine the prediction of TB adverse events (treatment failure, death, and drug resistance) among a large group of TB patients (8431). Given that we recently reported that 25% of the TB patients in Tamaulipas have DM co-morbidity [Reference Abdelbary22], we evaluated the subset of TB–DM patients separately for risk of treatment failure and death (2121). We sought to determine whether an individual risk of TB treatment failure or death could be predicted at the time of TB presentation in a convenient and inexpensive way based on surveillance data from previous TB patients. Moreover, due to limited testing resources for TB drug resistance, we looked at drug resistance prediction models in an effort to determine the risk of drug resistance at time of TB presentation.
METHODS
Study population
We used data collected for TB surveillance purposes by the Health Department (Secretaría de Salud) for the state of Tamaulipas, Mexico between the years of 2006 and 2013. The procedure for selection of 8431 adults (18 years or older) with newly diagnosed TB patients and their characteristics was reported recently [Reference Abdelbary22]. The analysed data included all the TB cases reported to the Tamaulipas health department. TB diagnosis was primarily based on a positive smear from sputum or other specimen for acid-fast bacilli (AFB), but also on mycobacterial culture or histopathology, and in some cases supported by abnormal chest x-ray or PCR (but not including cases diagnosed post-mortem). One-fourth of the study population had DM as co-morbidity. The other frequent co-morbidities were malnutrition (8·3%), alcoholism (5·6%), and HIV (5·3%) [Reference Abdelbary22]. Treatment status for DM or HIV were not included in the dataset, but universal treatment for HIV is available at no cost.
The adverse TB events evaluated in this study included treatment failure, death, and drug resistance (all as binary outcomes). Treatment failure indicated smear-positive persistence at or after 5 months of treatment with first-line anti-TB medications. Death included all causes of death (TB or non-TB related) during the course of TB treatment. Testing for drug resistance is routinely done at the time of TB diagnosis in the sanitary jurisdictions across the US border, but not in non-border regions of Tamaulipas. In the latter case, drug resistance is usually evaluated after treatment failure with first-line medications. Therefore, drug resistance was evaluated as an adverse event and also as a predictor of treatment failure and death. Drug resistance was evaluated for five antibiotics (isoniazid, rifampin, pyrazinamide, streptomycin, and ethambutol) using culture methods and coded as present if resistance to any of the five drugs was detected. Multi-drug resistance (MDR) included resistance to isoniazid and rifampicin. DM diagnosis was based on self-report for all cases, and sometimes complemented with testing for hyperglycaemia at time of TB diagnosis as described previously [Reference Abdelbary22]. HIV diagnosis was based on either self-report or blood testing at the time of TB presentation, but blood testing was not always documented in the database. Malnutrition was determined clinically as being underweight at time of TB diagnosis. TB location was defined as pulmonary vs. all other extra-pulmonary forms. Education was classified as ‘none or up to primary school’ vs. ‘higher than primary school’. Occupation status was coded as unemployed, not-employed (students, inmates, and retirees), and employed based on self-report. Semi-quantitative AFB smear grades were based on the number of AFB per high-power field microscopy in the first smear and included negative (0), rare bacilli (+1), few bacilli (+2), and moderate number of bacilli (+3).
This study was approved by the institutional review board of the University of Texas Health Science Centre at Houston (HSC-SPH-15-0489) and the Research Committee for the Secretaría de Salud de Tamaulipas (Comité de Enseñanza; 076/2015/CEI).
Statistical analysis
Descriptive analyses were performed to characterize the distributions of various variables in our study population with respect to encountered adverse events. Pearson's χ 2 test was used for binary and categorical variables, and Student's t-test for continuous variables to compare differences in the positive and negative outcomes groups. To develop the risk scores and test their validity, subjects from our study population were randomly assigned to either a derivation subset or a validation subset using the proc surveyselect procedure in SAS software v 9.4. Since DM has been reported as a risk factor for TB and adverse TB outcomes in some studies [Reference Jimenez-Corona13–Reference Sulaiman21], we used stratified random sampling with a DM proportion of 25·2% to keep the proportion of DM identical to that in the total sample [Reference Abdelbary22]. The derivation dataset had 4216 observations and the validation dataset had 4215 observations with 0·50 probability of selection.
Univariable (simple) logistic regression was used with the derivation subset to determine the relationship of each independent variable for each of the selected adverse events. For the multiple logistic regression model building, we selected variables with clinical significance and all the predictors with P ⩽ 0·25 at the univariable level. Then we identified the variables with significant independent predictive value (P ⩽ 0·1) in the multiple logistic regression model using Hosmer–Lemeshow model building criteria [Reference Hosmer and Lemeshow23], and checked for linearity in the logit of continuous variables and for significant interaction terms. We also assessed goodness of fit and stability of the model. Then we derived risk scores based on these variables and tested them initially in the derivation subset. The modified risk scores were developed using the sum of the weighted risk factors identified in the final models. Weights were assigned to each positive and negative predictor based on the magnitude of the odds ratio (OR) for each variable for easier interpretation. The β-coefficients (or log of the ORs) were used to develop weighted score for one of our models (details below) where β-coefficients were rounded to the nearest 10th and then multiplied by 10. For categorical variables, a score was assigned to each category and we accounted for that when calculating the range of potential risk scores since patients can fall in only one of the categories. Finally, the precision of the best prediction methods that were developed for each adverse event with data from the derivation subset were tested among subjects in the validation subset. For this, we conducted logistic regression models entering each patient's risk score as the independent variable for each of the adverse events of interest. We also tested if the rate of the adverse events increases with the increasing risk scores. Finally based on sensitivity and specificity analysis, area under the curve (AUROC), and aiming to maximally reach our targeted population, we developed cut-off points for all constructed modified risk scores using the validation dataset. All statistical analyses were conducted using STATA 14 [24] and SAS 9.4 [25].
RESULTS
Characteristics of TB patients with adverse outcomes
Among the 8431 newly diagnosed TB patients between 2006 and 2013 in the state of Tamaulipas, Mexico, we focused on the two most prevalent adverse outcomes during TB treatment: treatment failure (158 patients) and death during treatment irrespective of direct mortality cause (521 deaths; Table 1). We found that TB patients who failed their initial treatment regimen with first-line antibiotics (vs. no treatment failure) were more likely to be male (74% vs. 65%) with no or primary school education (67·5% vs. 57·7%), more likely to present with an initial positive AFB smear (93·6% vs. 85·9%), and 21% had MDR-TB. On the other hand, TB patients who died during treatment (vs. survived) were significantly older (mean age 50 vs. 42), more likely to be male (74·3% vs. 64·9%, with education at or below primary school level (69·3% vs. 57·1%), reporting excessive alcohol use (10% vs. 5·3%), less likely to be BCG vaccinated, and more than 60% were either not employed or unemployed (39·8% and 23%, respectively). On evaluating their clinical profile, TB patients who died were more likely to present with extra-pulmonary TB (14·8% vs. 7·6%), had HIV (19% vs. 4·4%) or malnutrition (17·3% vs. 7·7%), and were less likely to have initial positive AFB smear (77·8% vs. 85·6%) or present with diabetes as a co-morbidity (16·9% vs. 25·7%) (Table 1). Other variables that were evaluated at the univariable level but found to show no significant difference between study groups or to contribute to the multiple logistic regression models were: previous TB infection and sanitary jurisdiction location (border vs. non-border) (data not shown).
Table 1. Demographic features and clinical presentation of 8431 TB patients by adverse outcomes and drug resistance status in Tamaulipas, Mexico, 2006–2013 a

a Analysis done using χ 2 and simple logistic regression. Data expressed as % unless otherwise specified.
b Not employed included students, house wife, inmates, and retirees.
Characteristics of TB patients with drug resistance
Due to limited resources, drug testing in the non-border sanitary jurisdictions of Tamaulipas is only conducted once treatment failure is detected, as opposed to being done at the time of TB diagnosis. Therefore, we identified the characteristics of those at risk for drug resistance a-priori. TB patients showing resistance to any of the five drugs tested were more likely to report BCG vaccination (81·9% vs. 76·1%), present with pulmonary disease (99·2% vs. 91·7%), have an initial positive AFB smear (94·1% vs. 84·8%) with 41·9% of them having +3 bacilli, and have DM (31·3%). There was no significant difference between TB patients with drug resistance and those without regarding age, gender, education level, employment status, and other comorbidities (HIV and malnutrition) (Table 1).
Characteristics of TB patients with adverse outcomes and drug resistance in the derivation dataset
The characteristics of the 4216 TB patients in the derivation dataset with probability of selection of 0·5 were comparable to those previously described for all TB patients (Table S1 and description in online Supplementary material available on the Cambridge Core website).
Characteristics of TB patients with adverse outcomes and drug resistance in the validation dataset
The characteristics of the TB patients in the validation dataset (n = 4215) were comparable to those previously described for all TB patients (Table S2 and description in online Supplementary material available on the Cambridge Core website).
Multiple logistic regression analysis
In order to identify significant socio-demographic and clinical predictors for the outcomes of interest, we used multiple logistic regression models. For this, we used a derivation dataset and then followed the Hosmer–Lemeshow model building criteria [Reference Hosmer and Lemeshow23]. The final logistic regression model for treatment failure had a c-statistic of 0·70 and retained only two predictors for higher risk of treatment failure. The predictors were low or no education (adjusted OR (aOR) = 1·8, 95% confidence interval (CI) (1·0, 3·3)), MDR-TB (aOR 114·2, 95% CI (54·1, 241·1)) (Table 2). There were no significant interaction terms in these models (data not shown).
Table 2. Multivariable logistic regression models and calculation of the simple and modified risk scores for adverse TB events using a derivation subset with 0·5 probability of selection (n = 4216)

NS, not significant.
The final model for all causes of death had a c-statistic of 0·77 and retained six predictors for higher risk of death and two negative predictors. The predictors for higher risk were age (41–64 years old) (aOR 1·7, 95% CI (1·3, 2·4)), or age (⩾65 years old) (aOR 5·4, 95% CI (3·8, 7·7)) compared with referent age category (18–40), male gender (aOR 1·5, 95% CI (1·0, 2·1)), MDR-TB (aOR 3·5, 95% CI (1·2, 9·8)), HIV (aOR 3·0, 95% CI (1·2, 9·8)), malnutrition (aOR 2·5, 95% CI (1·7, 3·5)), and reporting being alcoholic (aOR 2·3, 95% CI (1·4, 3·5)). The negative predictors were DM (aOR 0·4, 95% CI (0·2, 0·9)) and pulmonary TB (aOR 0·4, 95% (0·2, 0·6)). Two interaction terms were found to be significant in this model; being a diabetic male (aOR 2·4, 95% CI (1·0, 5·6)) and having HIV together with pulmonary TB (aOR 2·5, 96% CI (0·9, 6·8)) (Table 2). The final model for drug resistance had a c-statistic of 0·61 and retained two predictors for higher risk and one negative predictor. The predictors for higher risk were pulmonary TB (aOR 5·7, 95% CI (0·8, 42·5)), AFB smear (+1) (aOR 1·3, 95% CI (0·7, 2·7)), or AFB smear of +2 bacilli or more (aOR 2·1, 95% CI (1·1, 4·1)). The negative predictor age (41–64 years old) (aOR 0·9, 95% CI (0·6, 1·2)) or age (⩾65 years old) (aOR 0·5, 95% CI (0·3, 1·0)) and no significant interaction terms (Table 2). It was previously shown that 94% of drug resistance cases were from the border jurisdictions [Reference Abdelbary22], yet a model using subjects from the border jurisdictions only did not demonstrate better predictability (not shown).
Modified risk scores
After developing the final predictor model for each outcome using the derivation subset, we developed a modified risk score and retested the predictability of our model within this same subset. The modified scoring system was constructed based on weighing the predictor variables proportional to their ORs or the β-coefficients in case of the treatment failure model as the model exhibited large magnitude of one of the predictors’ OR. To avoid negative values when adding all risks, a correction factor was added as needed (baseline values in Table 2). To examine the predictability of the constructed scores, logistic regression analyses were then repeated using the derivation dataset with the constructed modified scores (total of the weighted individual predictors) as the independent variable.
Using the derivation subset, the model for treatment failure using the modified risk score showed non-significant results indicating that the score is not a good predictor for treatment failure. Due to the high magnitude of the effect of the MDR-TB in our model, the model building was repeated in a smaller derivation dataset with 0·25 probability of selection (n = 2109). The second model with the smaller dataset yielded a c-statistic of 0·74, retained four predictors of higher treatment failure risk and no predictors for lower risk. The predictors for higher risk were low or no education (aOR = 2·3, 95% CI (0·9, 5·7)), MDR (aOR 54·3, 95% CI (15·7, 187·5)), having +2 bacilli on initial AFB smear (aOR 2·7, 95% CI (0·8, 8·6)), and having +3 bacilli (aOR 4·3, 95% CI (1·5, 12·1)) (Table 3). The model using the modified risk score based on the weighted β (for second model derived from small derivation set) showed a comparable result (c-statistic 0·74) indicating significant strong predictability of this model.
Table 3. Multivariable logistic regression models and calculation of the simple and modified risk scores for adverse TB events using a derivation subset with 0·25 probability of selection (n = 2109)

The logistic regression model for ‘death’ using the modified risk score had a c-statistic of 0·75 indicating strong and significant predictability (P < 0·001). For drug resistance, the logistic regression model using the modified risk score yielded a c-statistic of 0·58 with a P-value 0·0002 indicating a moderately but significant prediction of drug resistance (using the main derivation set (n = 4216)).
Validation of risk scores
To establish the predictability of the models among patients in the validation subset, a logistic regression model and a maximum-likelihood ROC model (The constrained ROC estimator has lower variance) were evaluated for each of the study outcomes by using the modified risk score as independent variable. The c-statistics for the modified risk scores was 0·63 for treatment failure and 0·70 for death, and 0·56 for drug resistance, respectively. All logistic regression models were statistically significant with a P-value < 0·001 for death and treatment failure and P-value of 0·009 for drug resistance. The c-statistics using the maximum-likelihood ROC model was 0·65 for treatment failure, 0·70 for death, and 0·57 for drug resistance, respectively (Tables 2 and 3).
To demonstrate the increase in the proportion of adverse events as the risk scores increase, and to identify the best stratification for risk categories, we examined the observed proportion of each adverse event in the validation subset as a function of incrementally higher modified risk score (Fig. 1). Additionally based on sensitivity and specificity analysis, we developed a cut-off point for all of the risk scores using the Liu method (maximizes the product of the sensitivity and specificity), the Youden method (maximizes the sum of the sensitivity and specificity), and the nearest to (0, 1) method (finds the cut point on the ROC curve closest to (0,1)).

Fig. 1. Rates of adverse events using the modified risk scores. Data from 4215 TB patients in the validation subset were used to assess rates of treatment failure (a), death (b), and drug resistance (c). Data from 2121 TB–DM patients were used to assess rates of death.
For treatment failure, the observed proportions ranged from as low as 3% among patients with modified risk scores between 0 and 23, 58% among patients with risk score of 40–50, to 75% among patients with scores ⩾50. A cut-off point of 15 with a specificity of 66% and sensitivity of 52% was the optimum point for identifying those at higher risk of treatment failure, based on both the Liu and nearest methods (c-statistics of 0·59 and P-value = 0·0092; Table 4). This cut-off would comprise 34·4% of all the TB patients (Table S3).
Table 4. Cut-off points for modified risk scores based on sensitivity and specificity analysis

For death, the observed average proportions were 3·5%, 8%, 14·5%, and 31% among patients with modified risk scores between 0–4, 5–9, 10–12, and ⩾13, respectively (Fig. 1). A cut-off point of 5 can be used to classify those with greater risk for death based on the three methodologies listed above (sensitivity 60% and specificity 71%, c-statistics of 0·65 with P-value 0·0356) (Table 4). This cut-off would comprise 47·6% of all the TB patients (Table S3).
For drug resistance, the observed average proportions were 2·2%, 3·4%, and 4·2%, for patients with observed modified risk scores of 8, 9, and 10, respectively (Fig. 1). A cut-off point of 9 can be used to classify those with greater risk for drug resistance based on the Liu and nearest methods with sensitivity 33% and specificity 74%, c-statistics of 0·54 with P-value 0·0052 (Table 4). This cut-off would comprise 58·4% of all the TB patients (Table S3).
Characteristics of TB patients with adverse outcomes by score cut-off point
We used the whole data for TB patients in Tamaulipas Mexico between 2006 and 2013 to evaluate demographic and clinical characteristics of TB patients with adverse outcomes by score cut-off point utilizing univariate regression analysis (Table S5 and description in online Supplementary material available on the Cambridge Core website).
Risk of treatment failure and death among TB–DM patients
Only some of the published studies show that DM is associated with the adverse TB treatment events that we evaluated in this study [Reference Dooley16–Reference Sulaiman21]. In our recent analysis of the same study sample from Tamaulipas, we found that TB–DM patients were indeed more likely to have drug resistance, but that DM status was not associated with TB treatment failure or higher death rates [Reference Abdelbary22]. In the present study, we aimed to expand on these observations by examining if there were additional or dissimilar predictors of these adverse outcomes within the TB–DM patients only (n = 2121). We ran descriptive and regression models to assign separate risk scores for this particular subgroup, but with no separate validation subsets due to the limited sample size. Otherwise, derivation of the models utilized the same model building methodology described for all TB patients. The descriptive analyses for death, treatment failure, and abandoning of treatment are shown in Table 5.
Table 5. Demographic features and clinical presentation for 2121 TB–DM patients by selected treatment outcomes a

a Data expressed as n (%) unless otherwise specified.
b Not employed included students, house wife, inmates, and retirees.
c Fisher's exact test.
The TB–DM patients who died during their TB treatment period (vs. TB–DM who survived) were older and with a higher likelihood of being male (75% vs. 56·7%), more likely to present with extra-pulmonary TB (7·9% vs. 3·1%), MDR-TB (1·1%vs. 0·9%), and to have additional comorbidities (HIV and malnutrition). They were less likely to have been BCG vaccinated (57·7% vs. 73·8%) or have an initial positive AFB smear (76·3% vs. 89·9%). TB–DM who failed their treatment regimen (vs. TB–DM who did not fail their treatment) were mostly with no or primary school education (78·3% vs. 64·5%), presenting with pulmonary TB (100%) and were more likely to have MDR-TB (25% vs. 0·4%). TB-DM patients who abandoned their treatment (vs. TB-DM who completed treatment) were younger, mostly males (71% vs. 56·3%), and more likely to have HIV as a co-morbidity (2·2% vs. 0·4%) (Table 5).
Regression models for drug resistance and treatment failure in TB–DM patients could not be established given that the final models failed to retain more than one variable. The regression model results for death and abandoning of treatment are shown in Table 6. The logistic regression model for death in TB–DM patients had a c-statistic of 0·68, retained two predictors for higher and two negative predictors. The predictors for higher risk were male gender (aOR = 2·9, 95% CI (1·6, 5·4)), and malnutrition (aOR 3·0, 95% CI (1·3, 7·5)). The predictors for lower risk were BCG vaccine (aOR = 0·4, 95% CI (0·3, 0·7)) and having a positive initial AFB smear (aOR = 0·4, 95% CI (0·2, 0·7)). None of the interaction terms were significant (Table 6). The logistic regression model for death in TB–DM patients using the modified risk score had a c-statistic of 0·68 indicating that the risk score was a strong and significant predictor of death (P < 0·001).
Table 6. Multivariable logistic regression model and calculation of the simple and modified risk score for treatment failure in TB–DM patients (n = 2121)

The model for abandoned treatment in TB–DM patients had a c-statistic of 0·63, retained three predictors of higher risk: age (<40 years old) (aOR = 2·1, 95% CI (1·4, 3·3)), male gender (aOR = 1·9, 95% CI (1·2, 2·9)), and HIV (aOR 4·1, 95% CI (0·9, 19·7)). None of the interaction terms were significant. The logistic regression model for abandoned treatment in TB–DM patients using the modified risk score had a c-statistic of 0·62 and P < 0·001 indicating that the risk score was a moderate but significant predictor of abandoning treatment (Table 6). The observed death rate in TB–DM patients ranged from as low as 2% among patients with modified risk score between 0 and 2, to 50% among patients with the maximum risk score of 8 (Fig. 1).
DISCUSSION
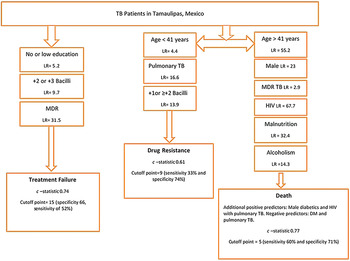
We examined whether the socio-demographic characteristics and clinical presentation of newly diagnosed TB patients can be used to predict the risk of drug resistance at the time of diagnosis and of adverse TB outcomes during treatment. For this, we built several models using TB surveillance data collected between 2006 and 2013 in Tamaulipas, Mexico. Then we developed modified risk scores that were found to provide significant predictability of the outcomes. Computing the sum of the modified scores is simple and we further developed a diagrammatic scheme in Figure 2, as well as complementary tables (Tables S3 and S4) which can be used by physicians and healthcare workers in Tamaulipas as a guide to help predict the risk of adverse events in a given patient. The goal is to identify patients with the highest scores in order to tailor their management to improve their TB treatment outcomes.
The strongest predictor for treatment failure in TB patients was their MDR status, and in the validation dataset, it increased the treatment failure rate per risk score category from 2% to 75%. This emphasizes the importance of drug resistance determination at the start of the treatment regimen in order to avoid treatment failures. All other predictors (low education, +2 or +3 bacilli on AFB smear) had a combined risk score of <40, which yielded a low observed average treatment failure rate (Fig. 1). Having a modified risk score cut-off of 15 or more identified those at higher risk of treatment failure with the most optimal sensitivity and specificity based on the nearest method and AUROC.
Additionally, when predicting death, the modified risk score illustrated the prominent effect of HIV and its synergistic effect when present in pulmonary TB patients on death as an outcome. Older age and MDR-TB also were strongly associated in our model, and even though diabetes was a negative predictor in the model, male diabetics (interaction term) had a strong positive predictability of death as an outcome. Other studies in developing countries worldwide had identified some of our predictors as risk factors for TB adverse outcomes (treatment failure and death) including but not limited to older age, lower education, unemployment, smoking, sputum smear positive, MDR-TB, and HIV infection [Reference Lucenko26–Reference Liew29]. The commonalities in the risk factors for TB adverse outcomes in developing countries render an added importance to our models as they could probably be used to predict TB outcomes in similar regions of the world.
Because of the limited resources for drug testing in the non-border sanitary jurisdictions of Tamaulipas, we developed a score for identifying those TB patients at greater risk for drug resistance based on patients’ profiles. The goal was to determine if risk scores could help stratify the patients with highest need for drug resistance testing at diagnosis. Younger patients (<40 years old), presenting with pulmonary TB and having ⩾+1 or +2 bacilli on initial AFB smear would increase the predictability of drug resistance. Even though the model yielded a moderately significant c-statistic (0·61), the observed drug-resistant rate upon validating the score varied from 2·2% to 4·2% only and validating the model in the validation dataset yielded significant yet lower predictability (0·56). This low rate and low predictability in the validation dataset does not weaken the moderate predictability of the model, but highlights that models with moderate predictability only partially explain the risk of the predicted outcome. More precise prediction for drug resistance status reducing the unexplained residual variation thus requires additional data input regarding patient and disease-specific characteristics identified at TB case presentation. For example, higher number of cavities on chest radiograph, bilateral lung involvement, presence of pleural effusion, or genetic predisposition (e.g. HLA-DRB1*14 allele) have been documented in other studies, but such variables were not available in our dataset [Reference Sharma30, Reference Chuchottaworn31]. Good DM control also would likely be important in explaining the residual variation among the DM patients [Reference Dooley16, Reference Chiang19, Reference Nissapatorn32], given that higher glucose levels were previously shown to affect innate immunity and change specific peptide expression in TB-infected cells leading to a higher bacterial load; but glucose levels were not available in our dataset [Reference Montoya-Rosales33]. Given that drug testing policies differ between the border and non-border sanitary jurisdictions based on available resources, we tried to develop a model using only the data from the border jurisdictions where drug testing is more comprehensive to help improve predictability, but the model yielded a very low c-statistic (c-statistic = 0·52; not shown). This raises a concern regarding drug resistance testing policies in the state of Tamaulipas and requires additional effort to increase drug testing rates at TB presentation and not later during the course of treatment. If funding is not available for comprehensive drug testing, then an observational study in this TB population might help to identify more risk factors for drug resistance that will guide on the contribution of additional variables collected from newly diagnosed TB patients in order to improve the model, we developed using the surveillance data.
There is a worldwide controversy on the relationship between TB–DM and DR, treatment failure, or death [Reference Dooley16–Reference Sulaiman21, Reference Nissapatorn32, Reference Viswanathan34, Reference Kang35]. Given that at least one in four TB patients in Tamaulipas have DM co-morbidity, we evaluated whether the predictability of adverse events would provide stratification of the TB–DM patients that would be helpful for individualized management (e.g. administration of treatment for 9 months vs. the standard 6 months, DR testing at diagnosis, higher stringency in the directly observed therapy) [Reference Abdelbary22]. In the TB–DM subgroup, we found two major positive predictors for death: male gender and malnutrition. Malnutrition was previously found to be highly prevalent in elderly diabetic patients and those with diabetic renal complication [Reference Vischer36–Reference Khan38] and was identified in our model as a strong predictor for death in the TB–DM subgroup. In contrast, it is intriguing that an initial positive AFB smear was identified as a negative predictor for death in TB–DM patients. This may be related to the higher death rate among TB–DM patients with extra-pulmonary TB who are known to be more likely to be smear negative. Extra-pulmonary TB has been associated with compromised immunity (e.g. more prevalent in HIV-positive patients), but not with DM [Reference Leeds39, Reference Jaryal40]. Our findings lead us to speculate that the combination of DM and extra-pulmonary TB reflect the presence of multiple risks that synergize towards higher death risk. These findings point to the added need to investigate TB–DM patients with extra-pulmonary and/or negative AFB smears to identify any other underlying immunological change that can synergize to increase their risk of death. Further stratification of TB–DM patients with clinical history and laboratory findings such as diabetes history or glucose control are likely to refine the predictions further, as suggested previously [Reference Dooley16, Reference Chiang19, Reference Nissapatorn32, Reference Montoya-Rosales33] and further refinement could be achieved by additional measures of immune status, which are under development in research laboratories.
We recognize some study limitations. We used surveillance data from 2006 to 2013 that included a large number of subjects but was limited to the variables included in this dataset. Missing information regarding presenting signs and symptoms, severity of lung involvement, smoking history, genetic factors, diabetes control, HIV treatment status, and/or social support structure would likely improve the accuracy of predicting adverse outcomes or drug resistance. Delayed treatment initiation due to late presentation to the health department was not accounted for; which ultimately can affect TB outcomes. The absence of universal testing for drug resistance might also have led to non-differential misclassification of study subjects and thus affecting our analysis. In addition, our study sample was limited to TB patients presenting to the Tamaulipas health department. Even though caution should be exerted for extrapolation, our results can be useful to other TB patient populations worldwide with similar socio-demographic population structure. Finally, the criticism of the AUC as a measure of classifier performance as discussed by Hand et al. [Reference Hand and Anagnostopoulos41] might be of an issue though we believe that it is not in our study, since the constructed risk scores in the validation dataset yielded nearly similar results. The replication of the results in the validation dataset would debate that the score is a measure of the classifier performance.
In conclusion, the modified scoring system with the cut-off points we developed is simple to use and will help refine the prediction of TB adverse events by differentiating those with low vs. high risk. Though the number needed to treat could not be calculated in this study, we managed to identify those at risk using the cut-off points and also identified an additional score for recommended enhanced case management. If health authorities were to apply the optimal cut-off points of 15, 9, and 5 for reducing treatment failures, drug resistance and death in Tamaulipas, they would need to heighten their diagnosis and treatment follow-up in 34·4%, 58·4%, or 47·6% of the TB patients, respectively (Table S3). We provided additional alternative cut-off points in Figure 1 and Table S4, given that health authorities may not have the resources to enhance management on this high proportion of patients. Alternative suggestions for scaling up their management could include cut-off points include 40 or more for treatment failure, 10 for drug resistance and 10 or more for death, which would require an enhanced management on 0·5%, 25·9%, or 2·9% of all the TB patients, respectively (Table S4). (Further description of the score categories and % of TB patients’ distribution within the score categories can be found in online Supplementary material (Tables S4 and S5) available on the Cambridge Core website.)
In summary, our findings have the potential to improve TB control in Tamaulipas by identifying the TB patients that will require close monitoring of their treatment progress. However, our findings indicate the difficulty in predicting drug resistance with the available surveillance data. There is a need for additional data collection in the TB surveillance platform, or ideally of drug resistance testing at the time of TB diagnosis, in order to achieve better prediction. Our findings show the potential for further stratification of TB–DM patients to identify within this group, those at higher risk for treatment failure and death.
SUPPLEMENTARY MATERIAL
The supplementary material for this article can be found at https://doi.org/10.1017/S0950268817001911.
ACKNOWLEDGEMENTS
This research received no specific grant from any funding agency, commercial or not-for-profit sectors.
The authors thank the personnel from all the sanitary jurisdictions of the Secretaría de Salud de Tamaulipas who contributed to the collection and recording of data from the TB patients, and Dr Santa Elizabeth Ceballos Liceaga who coordinates the Sistema de Vigilancia Epidemiológica de Tuberculosis y Lepra, Dirección General de Epidemiología, Secretaría de Salud de México, for providing the surveillance datasets for the analysis. The authors also acknowledge the support provided by the Biostatistics/Epidemiology/Research Design (BERD) component of the Centre for Clinical and Translational Sciences (CCTS) for this project. CCTS is mainly funded by the NIH Centres for Translational Science Award (NIH CTSA) grant (UL1 RR024148), awarded to the University of Texas Health Science Centre at Houston in 2006 by the National Centre for Research Resources (NCRR) and its renewal (UL1 TR000371) by the National Centre for Advancing Translational Sciences (NCATS). The content is solely the responsibility of the authors and does not necessarily represent the official views of the NCRR or the NCATS.
ETHICAL APPROVAL
This study was approved by the institutional review board committee for the University of Texas Health Science Centre at Houston and the Research Committee for the Secretaria de Salud de Tamaulipas. The authors assert that all procedures contributing to this work comply with the ethical standards of the relevant national and institutional committees on human experimentation and with the Helsinki Declaration of 1975, as revised in 2008.
DECLARATION INTEREST
None.


