


Introductory undergraduate courses in political science often are a gateway to the major by introducing students to political science generally, the major subfields in the discipline, and how political scientists conduct research. Moreover, because the course often fulfills general education requirements or is a prerequisite for other majors, it can be the primary source of political education even for nonmajors. Given the importance of these foundational courses and the incredible impact of basic civic literacy, faculty often find it challenging to balance substantive course material with other foundational skills, particularly information literacy (IL) and visual literacy (VL) (Harden and Harden Reference Harden and Harden2020). Yet, by deemphasizing the teaching of these skill sets early in students’ careers, they are at a disadvantage in conducting their own research or understanding the place of substantive course information within the greater scholarly conversation.
The teaching of substantive knowledge and applied skills in IL and VL often is perceived as one of competing goals; however, by integrating IL and VL as tools to teach substantive material, students can learn both to greater effect. Furthermore, as the use of visual media grows within and beyond the university classroom, a holistic treatment of student literacy should include instruction in the IL and VL frameworks. If faculty want to encourage political science students to become engaged in the discipline as well as educated consumers of political information more broadly, finding strategies for integrating literacy and substantive material is necessary.
If faculty want to encourage political science students to become engaged in the discipline as well as educated consumers of political information more broadly, finding strategies of integrating literacy and substantive material is necessary.
This article discusses how student-created infographics that summarize scholarly work can develop important IL and VL skills, promote the retention and transfer of course knowledge, and engage students within the scholarly research community while reinforcing the substantive course material.
USING IMAGES TO IMPROVE LITERACY SKILLS
In our data-rich world, information literacy (i.e., the ability to successfully and ethically engage with information and understand how it is produced and valued) and visual literacy (i.e., the ability to successfully and ethically engage with visual media and understand how it is produced and valued) are crucial skills for undergraduates to develop. Students who can critically examine sources and images will be better able to evaluate the information they are presented with on a daily basis both within and outside of the classroom.
The Association of College and Research Libraries (ACRL) provides several frameworks and standards for IL and VL for higher education (ACRL 2016, 2022). The IL framework encourages students to see research as inquiry, searching as strategic exploration, authority as constructed and contextual, information creation as a process, scholarship as a conversation, and information as valuable (ACRL 2016). For the VL framework, the ACRL (2022) identifies four themes relevant to literacy: participating in a changing visual-information landscape, perceiving visuals as communicating information, practicing visual discernment and criticality, and pursuing social justice through visual practice. In the political science classroom, approaching IL and VL through these frameworks suggests that students can develop skills to access appropriate sources of information, both written and visual; evaluate what they find; synthesize the material into an existing body of knowledge; and apply the information ethically (Williams and Evans Reference Williams and Evans2008).
Given the emphasis placed on scholarly literature in academic disciplines, the skills in IL and VL are important. Academic research articles illuminate aspects of inquiry that often are not covered in textbooks, discussing an author’s research question, theory, hypotheses, methods, and results. Fostering the development of these key IL skills can be a powerful pedagogical strategy to teach critical-thinking skills and research norms in the discipline. Furthermore, to generate their own research questions, students need an understanding of what the current body of work looks like and how to access, understand, and apply the research. Although studies show that students benefit from reading primary research articles (Wenk and Tronsky Reference Wenk and Tronsky2011), they often are intimidated by the structure, language, and—in political science—heavy emphasis on quantitative methods. At the same time, students can make significant gains in understanding primary literature when exercises to promote understanding are conducted on a regular basis (Wenk and Tronsky Reference Wenk and Tronsky2011). Entry-level courses can use scholarly literature when students are being taught to break down the complex academic structure into more manageable pieces.
Infographics provide one way to integrate the skills promoted in both IL and VL because they are a popular visual approach to delivering abstract, complex, and dense messages (Dunlap and Lowenthal Reference Dunlap and Lowenthal2016). They combine data visualizations, illustrations, written material, and images into a format that tells a complete story (Krum Reference Krum2014). An infographic can be used to convey ideas by quickly introducing a new topic, to provide an overview of a subject, and to be a starting point for more in-depth work. The construction of infographics can be compared to writing a paper, in which the author or designer formulates a specific idea to be conveyed concisely and succinctly (Sudakov et al. Reference Sudakov, Bellsky, Usenyuk and Polyakova2014).
Previous studies connect the creation of infographics to increased student engagement and improvement in critical-thinking skills when compared to students engaging with traditional textbooks. Instructors of English who use infographics to synthesize texts contend that the visual interpretation may give students the ability to understand and communicate ideas that they cannot yet comprehend from the text alone. The combination of images and print provides students greater access to more complex ideas (Lindblom et al. Reference Lindblom, Galante, Grabow and Wilson2016; Wolfe and Kleijwegt Reference Wolfe and Kleijwegt2012). In political science, infographics have been used to incorporate quantitative skills into substantive courses, reinforcing students’ abilities to succinctly summarize material and represent data (Bhasin and Butcher Reference Bhasin and Butcher2021; Henshaw and Meinke Reference Henshaw and Meinke2018). Research in the medical field has shown that infographics improve retention of difficult learning material through the use of visual displays (McCrorie, Donnelly, and McGlade Reference McCrorie, Donnelly and McGlade2016; Murray et al. Reference Murray, Murray, Wordie, Oliver, Murray and Simpson2017). Similarly, healthcare professionals report greater engagement with clinical-trial data presented as an infographic compared to conventional text-only format (Crick and Hartling Reference Crick and Hartling2015). Even when scholarly work is translated to social media, previous research shows an increase in engagement with an infographic that summarizes it when compared to a hyperlink to the peer-reviewed article (Barlow et al. Reference Barlow, Barlow, Webb and Cain2020).
THE INFOGRAPHIC ASSIGNMENT
The goal of the assignment is to develop IL and VL skills to make academic research and substantive course concepts more accessible to undergraduate students through a scaffolded approach. The assignment requires students to identify an academic research article, summarize its key components, and synthesize the material in a visually appealing and engaging format to share with classmates. In doing so, students essentially are tasked with telling a story about research (Lindblom et al. Reference Lindblom, Galante, Grabow and Wilson2016). The infographic authors (in this case, the students) must direct attention toward specific elements in their story by organizing images and the information that accompanies them. This assignment focuses on three aspects of the IL and VL frameworks: (1) research as inquiry, (2) scholarship as conversation, and (3) visuals as communicating information (ACRL 2016, 2022). These frameworks help students to understand research design as an iterative process dependent on asking increasingly complex or new questions (i.e., research as inquiry) resulting in sustained discourse with new insights (i.e., scholarship as conversation) (ACRL 2016). Instruction on how visuals communicate information allows students to develop skills in creating and understanding the aesthetic, evidentiary, and persuasive functions of visual media (ACRL 2022). Taken together, these three frameworks prepare students to understand academic research as dialogue and to think through how the results can best be summarized and presented for different audiences.
The infographic assignment was implemented in an introductory American government course during the Spring 2021 semester (Kalaf-Hughes Reference Kalaf-Hughes2022) (see online appendix A for assignment instructions). Because this assignment was used in an introductory course, it was necessary to devote class time to instruction in the basic components of academic research.Footnote 1 The instructor devoted one initial class period to this information—finding, accessing, and reading scholarly articles—as well as the typical components of political science research, including identifying the research question, literature review, theory, hypotheses, and results. Because these are skills that improve over time, additional instruction was provided throughout the semester in conjunction with the more substantive course material. Students also were connected with a campus research librarian who led an in-class session on how to use library resources to access academic research. Academic librarians are particularly well suited to this task as it relates to the development of IL and VL skills, and they increasingly are incorporating the visual aspects of information into their IL instruction (Hattwig et al. Reference Hattwig, Bussert, Medaille and Burgess2013).Footnote 2
Instructional time also was used to explore the key components of infographics and what comprises a compelling visual narrative. For the purposes of the assignment, it was suggested that students use the Canva program (www.canva.com). Many free and paid tools are available to create infographics; however, Canva provides templates that students can edit and modify as well as various fonts and images in the free version of the website. This allows users flexibility without having to pay for the service. The program also allows students to download their work in jpg or pdf format and to include a website link, making it easy to share their work in the course learning management system (LMS). (Online appendix B includes Canva-specific directions and discusses how this type of program can meet the needs of students at different levels of VL.)
As a teaching tool, a basic sample infographic was presented to students to highlight different components of an article and as a model infographic (see online appendix C).Footnote 3 Students also received a grading rubric used to assess the infographic on the following dimensions: content (i.e., the necessary and correct information from the article is included in the infographic), graphics (i.e., the graphics represent the information appropriately and contribute to the overall message), mechanics and grammar, and citation.
A list of suggested scholarly articles relevant to course material was provided; however, students could choose a different article with the instructor’s approval. After selecting an article, students were asked to read their article and identify the following components to be included in the infographic:
-
• article title
-
• research question
-
• theory
-
• hypothesis
-
• findings
-
• implications
-
• article citation
Next, and consistent with Kothari et al. (Reference Kothari, Hall, Castañeda and McNeil2019), students were encouraged to create an infographic plan to decide which information to include (e.g., which hypothesis and findings were most relevant or interesting); determine how to include it in the infographic (i.e., which visuals and information would be most appropriate or best communicate the information); and effectively summarize the components and synthesize the necessary information. Students then created their infographics from the information collected in their plan.
Students submitted their infographics to the course LMS as a discussion post to enable their work to be visible to their classmates, instructors, and teaching assistants, which allowed students to view and respond to their classmates’ infographics. Because students selected one article from the instructor-provided list, they were able to compare their work to other students who selected the same article as well as those who selected a different article. This approach allows the instructor to draw attention to common themes, frequently identified theories and hypotheses, and any possible overlap or disagreement among the pieces—both the articles and the student-created infographics.
After students submitted their infographics, they participated in a discussion designed to reinforce the connections between the assignment and the IL and VL skills. First, they were asked to identify the contributions of the articles summarized by infographics to disciplinary knowledge (ACRL 2016, 2021). This line of discussion is consistent with the ACRL (2016) general framework, as well as the discipline-specific framework (ACRL 2021), and it helps students to situate the scholarly conversation within their understanding of disciplinary knowledge. The use of infographics as a starting point for discussion allows students to become familiar with one article and to draw on their classmates’ infographics for a broader knowledge of how the field addresses similar questions. This is accomplished without tasking introductory students with a deep read of multiple academic articles—a task that may be challenging for those who are still developing these skills. Moreover, this approach highlights that the article read by each student and used to create their infographic may not represent the only perspective on an issue (ACRL 2016, 2021).
Second, students compared and contrasted all of the articles that they read, as well as the infographics they viewed, which emphasized the conversations among scholars, the iterative nature of the process, and how different articles engage with the larger body of work and generate new questions (ACRL 2021). Students also were asked to compare and contrast the visual representations in each infographic and to discuss their aesthetic, evidentiary, and persuasive functions (ACRL 2022).
Third, using the student-created infographics and other course information, students crafted additional questions for research based on information gaps that they identified or a reexamination of existing or conflicting information. This is consistent with ACRL knowledge practices for students developing their IL skills and the idea of research as an iterative process (ACRL 2016, 18). This activity tasks students to engage with research, develop their own questions and ideas, and synthesize ideas gathered from multiple sources (ACRL 2016, 2021). (See online appendix D for assignment components and suggested discussion prompts as well as how they map onto the specific IL and VL standards included in the assignment.)
Infographics provide students greater access to more complex ideas (Lindblom et al. Reference Lindblom, Galante, Grabow and Wilson2016; Wolfe and Kleijwegt Reference Wolfe and Kleijwegt2012) and reinforce their abilities to succinctly summarize material and represent data (Bhasin and Butcher Reference Bhasin and Butcher2021; Henshaw and Meinke Reference Henshaw and Meinke2018). This encourages students to use their classmates’ infographics as a starting point for discipline research, which should increase accessibility and engagement, particularly in introductory courses.
The process of infographic creation and targeted discussion exposes students to a wider range of scholarship than reading assignments alone, thereby better positioning them to incorporate the material into their own papers, exams, and other assignments in this and other courses.
The process of infographic creation and targeted discussion exposes students to a wider range of scholarship than the reading assignments alone, thereby better positioning them to incorporate the material into their own papers, exams, and other assignments in this and other courses.
STUDENT PERCEPTIONS
To assess student perceptions of infographics as a tool to improve IL and VL skills, a voluntary “pretest” survey instrument was administered that asked questions about their experience with infographics, discussion posts, information-seeking behaviors, VL and IL skills, and relevant student demographics. A similar survey instrument was administered at the end of the semester after the infographic assignments had been completed. Survey respondents represented a wide variety of class ranks, backgrounds, interests, and academic experiences, indicating that the results were generalizable to a larger student population (see online appendix E for information on university and survey demographics).
Students ranked agreement with statements about their experience with infographics and the role they play as a teaching tool on a scale of 1 to 5 (i.e., 1=strongly disagree; 5=strongly agree). Not surprisingly, students reported significantly more experience with infographics at the end of the semester, which indicated that they had internalized their coursework with their overall skill set. As summarized in figure 1, after completing the infographic assignment, students reported significant increases in the belief that infographics improved their critical-thinking skills (at the 0.05 level), helped them to learn new information, improved their presentation skills, and resulted in additional confidence in their own ability to learn overall (at the 0.10 level). These results are consistent with previous studies suggesting that infographics allow for greater access to complex ideas and retention of new information (Lindblom et al. Reference Lindblom, Galante, Grabow and Wilson2016; McCrorie, Donnelly, and McGlade Reference McCrorie, Donnelly and McGlade2016; Murray et al. Reference Murray, Murray, Wordie, Oliver, Murray and Simpson2017; Wolfe and Kleijwegt Reference Wolfe and Kleijwegt2012). Moreover, the results suggest an increased confidence in students’ own presentation abilities and the idea that visuals can contain information.
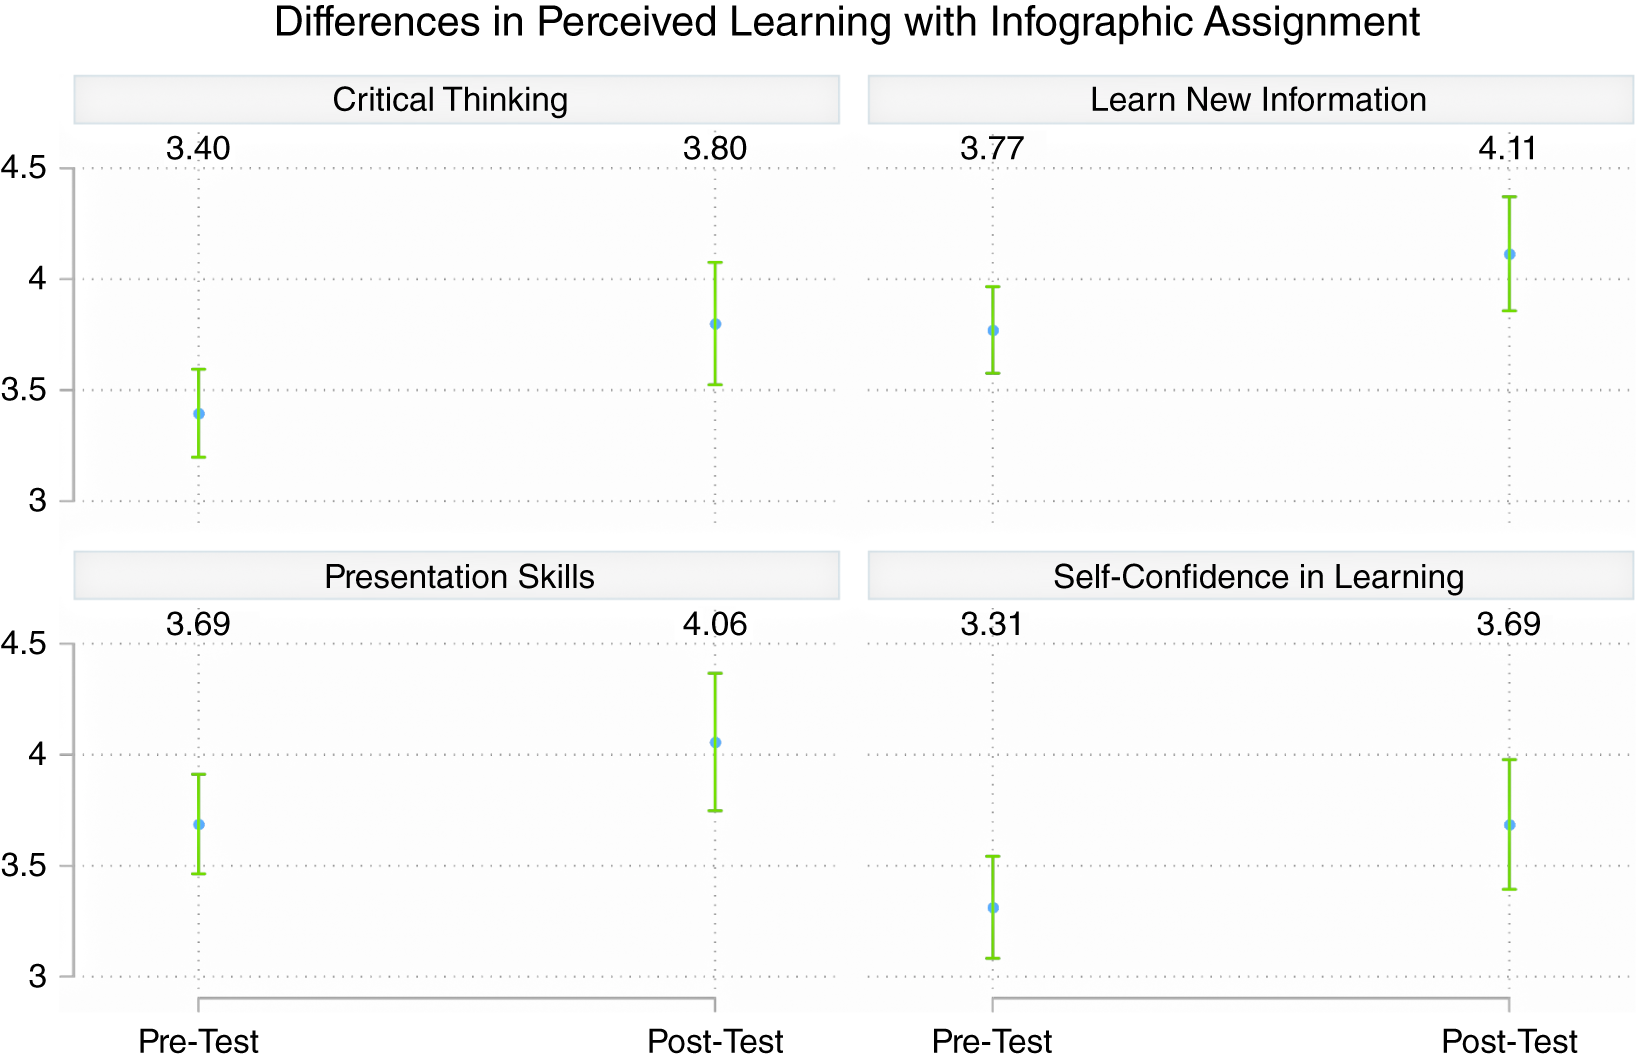
Figure 1 Students were asked to rank their agreement with the role of infographics across different learning areas in a pre- and post-test. Higher values indicate greater agreement with the role of infographics in improving learning.
To assess how students felt about and used the infographics after completion of the course, figure 2 shows that most reported that creating infographics helped them to understand the scholarly literature, used their classmates’ infographics to help them apply scholarly literature to coursework, and found it easier to read their classmates’ infographics than scholarly articles on their own.
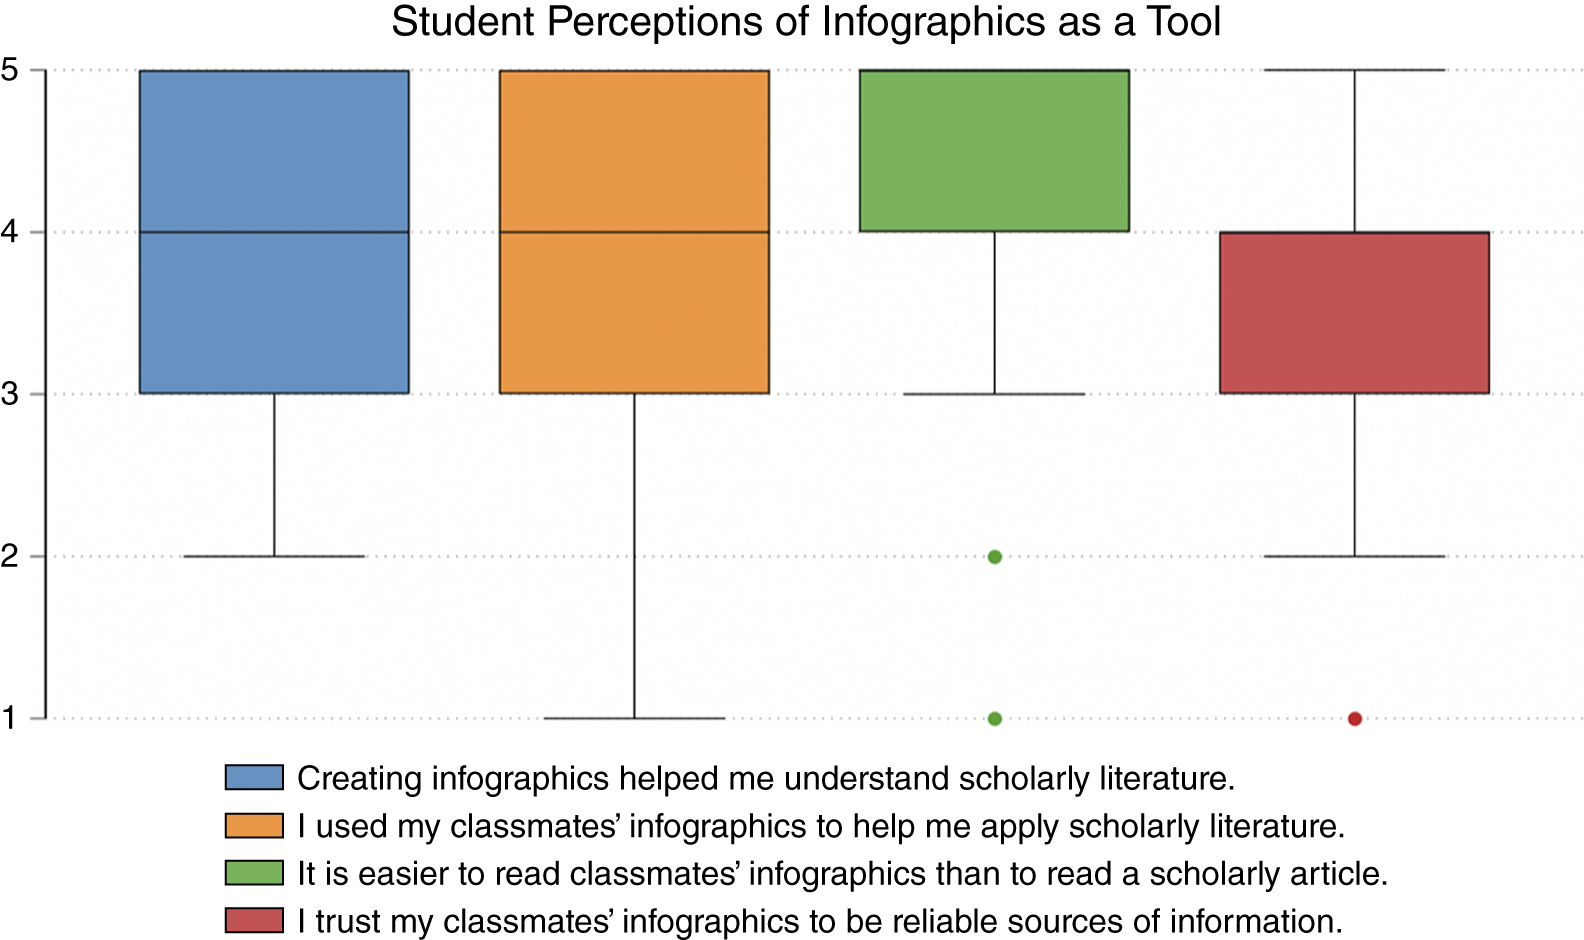
Figure 2 Students reported creating infographics helped them to understand and apply the scholarly information.
The quantitative results are consistent with qualitative student feedback. When asked for feedback about the infographic assignments in the course, one student reported that they “actually enjoyed making the infographics” and another stated that “they were super helpful in understanding topics.” Another student said, “Honestly, I thought they were going to be difficult but when I was creating them, I found myself having fun moving all the different pieces of the infographic around. It brought out the creativity in my brain! I enjoyed them.” It is worth noting that whereas most students reported trusting the information in their classmates’ infographics, there were concerns reflected in the qualitative comments. Some students acknowledged their own difficulty identifying the necessary components of the articles to include in the infographics—noticeable to other students when they reported a lack of faith in the conclusions of their classmates’ work. One way to alleviate these concerns is to provide additional opportunities for student practice and feedback on working with the academic research articles. Another possibility is to target discussion beyond the IL and VL questions discussed previously and to offer additional instructional focus on the suggested articles to build student confidence in their conclusions.
RECOMMENDATIONS FOR IMPROVEMENT
Based on student feedback and instructor observation, the following three key recommendations are made for implementing the infographics assignment as a tool to improve IL and VL:
-
• Recommendation 1: Allocate the appropriate time for direct instruction in key aspects of IL. Student feedback suggested the need for additional instruction in how to approach academic articles, both the contents of the material and the context in which it operates. Although students benefited from the direct instruction of librarians, expanding the direct course instruction to IL (Harden and Harden Reference Harden and Harden2020) will further develop these skills, thereby allowing students to understand the creation of information, the context in which it operates, and how academic scholarship acts as a conversation.
-
• Recommendation 2: Increase opportunities for practice and feedback. Students reported greater confidence in their critical-thinking skills and ability to learn new information, but scaffolding the assignment over a period of weeks would allow them to practice their new skills with additional instructor and peer feedback.
-
• Recommendation 3: Add a round of peer review to address minor errors and provide initial feedback on the infographic. Having students share a draft of their infographic with classmates who have read the same article would provide feedback on the written and visual content of their infographic before sharing it with the larger class, as well as further scaffolding the assignment to provide support (Anderson, Bishop, and Cross Reference Anderson, Bishop and Corss2019).
IMPLICATIONS
IL and VL skills are important to student growth in the scholarly community. However, finding a balance between substantive learning and applied skills remains challenging. Faculty often choose to relegate any IL and VL instruction to librarians. Yet, by integrating applied skills with substantive learning, students are given an advantage when conducting their own research or understanding the place of substantive course information within the greater scholarly conversation. Furthermore, as the use of visual media grows within and beyond the university classroom, a holistic treatment of student literacy should include instruction in the VL framework as a critical skill for professional and civic development. The infographic assignment allows students to engage with and evaluate academic research and to transpose the important features into visual media that can be shared and understood by others. Distilling academic research into an infographic requires students to understand the process of information creation, its value, how visuals can communicate this information, and how scholarship acts as a conversation—all key components of the IL and VL frameworks. This is one of the key aspects of the assignment that sets it apart from the many other excellent examples of IL assignments that exist in political science and other disciplines: it combines the development of both IL and VL skills with the engaging nature of infographics and their ability to improve critical-thinking skills.
Although this infographic assignment was used in an introductory American government course, there are applications for all subfields of political science. Furthermore, as IL and VL skills continue to develop during an academic career, this infographic assignment is well suited for use in all levels of courses because instructors can adjust the assignment by increasing or decreasing the scaffolding or support. This allows students to select their own scholarly articles rather than choose from an instructor-provided list, and—in more advanced courses—it encourages students to make infographics of their own research as a way to share their findings with a broad audience and to improve overall scholarly communication. This flexibility further distinguishes the assignment from other assignments designed to increase IL skills because it allows for differentiation within a course as well as across different courses.
Finally, because questions about the value of higher education and academic research remain a salient part of the political and social conversation, our ability to translate complex academic ideas to the general public becomes increasingly important, within and outside of the classroom. This idea is echoed in the value that employers place on skills relevant to the creation of infographics, including a familiarity with quantitative data, the ability to process information, and the use of graphics software (Henshaw and Meinke Reference Henshaw and Meinke2018). By creating public-facing infographics that distill political science knowledge into visually interesting summaries, students do more than learn the material; they also teach it to others. As such, this project is more than simply an opportunity for students to expand their skill set; it is an opportunity for them to expand citizen knowledge and interest in a time of ever-increasing doubt.Footnote 4
By creating public-facing infographics that distill political science knowledge into visually interesting summaries, students do more than learn the material; they also teach it to others.
DATA AVAILABILITY STATEMENT
Research documentation and data that support the findings of this study are openly available at the PS: Political Science & Politics Harvard Dataverse at https://doi.org/10.7910/DVN/ZEJ7TX.
SUPPLEMENTARY MATERIALS
To view supplementary material for this article, please visit http://doi.org/10.1017/S1049096522001214.
CONFLICTS OF INTEREST
The author declares that there are no ethical issues or conflicts of interest in this research.


 Open access