


Introduction
The domestic dog has been a companion of man for over 10 000 years [Reference Montagu1, Reference Ovodov2]. Dogs perform numerous important roles within communities, including companionship, security, disability assistance services and livestock protection. Dogs also play host to at least 60 zoonotic pathogens, diseases that can spread from dogs to humans, which has resulted in the development of numerous canine health interventions applied for the ultimate objective of reducing dog-mediated human disease [Reference Chomel3]. Interventions that are commonly practiced include surgical sterilisation, routine vaccinations, vector control and vaccinations for zoonotic pathogens.
Delivery of these health interventions has been optimised in many high-income countries through the development of veterinary and public health infrastructure. These efforts have led to the elimination of diseases such as canine-variant rabies virus in many countries and reduction of other zoonoses such as leptospirosis, parvovirus, canine distemper virus and tick-borne diseases. Veterinary and public health infrastructure in many middle- and low-income countries has not been extensively developed and a propensity to allow domestic dogs to roam freely further compounds poor animal health and facilitates transmission of zoonotic pathogens [Reference Fahrion4].
Rabies lyssavirus (RABV) is considered the deadliest of all zoonotic pathogens, responsible for over 2 million human infections and at least 59 000 deaths annually [Reference Hampson5, Reference Coleman, Fèvre and Cleaveland6]. Nearly all human deaths are the result of infection from the bite of a RABV-infected dog [7]. Practical experiences, as well as predictive modeling techniques, have shown that RABV transmission can be interrupted when herd-immunity is maintained above 50% in the susceptible dog population [Reference Tierkel8–Reference Dodet11]. Due to population turnover, annually applied dog vaccination campaigns reaching >70% of the susceptible population have proven adequate to eliminate RABV in dogs [Reference Coleman and Dye12–Reference Borse15].
While the challenge of canine rabies elimination may be more difficult in low and middle-income countries, several programs have shown that successes can be achieved under such conditions [Reference Clavijo16–Reference Lapiz19]. Learning from successful programs and taking advantage of new technology could accelerate time to elimination for countries that are committed to the goal [Reference Wallace20]. Limited understanding of the epidemiology of dog and dog-mediated diseases, lack of community awareness, shortages of trained vaccination personnel and insufficient planning capabilities to project needed resources are among the main barriers to conduct effective animal disease prevention interventions [Reference Dodet11, Reference Clavijo16, Reference Wallace21–Reference Mulipukwa, Mudenda and Mbewe24]. Here, we describe a model to help reduce the period between research and application of successful dog vaccination interventions.
Methods
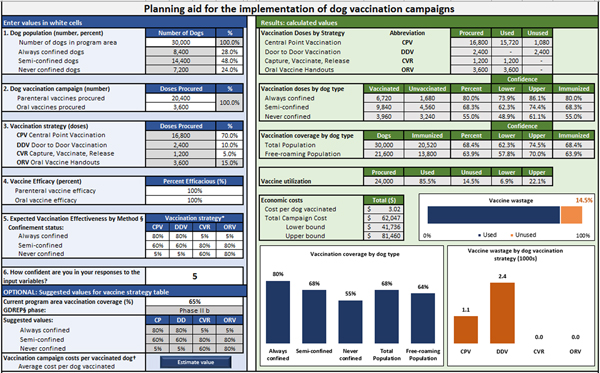
In order to develop a dynamic model to estimate the effectiveness of a health intervention in a dog population, we partitioned the process of canine vaccination into five elements: allocation of vaccines, accessibility of dog populations, vaccine efficacy, vaccination effectiveness and summation of distributed vaccines. A set of equations are used to calculate estimated vaccination coverage according to dog confinement status and vaccination method used. User-defined values include: the total number of dogs in the vaccination area and their proportional makeup by confinement status (Step 1); number of vaccine doses procured and allocated by vaccination method (Steps 2 & 3), efficacy of the vaccines (Step 4) and the effectiveness of vaccination method in reaching target dog populations (Step 5). The user's confidence in their responses is also recorded to develop confidence levels around the model outputs (scale 1–10, higher indicating more confidence) (Fig. 1).

Fig. 1. User-interface for planning dog vaccination campaigns.
Vaccination methods considered in this analysis included central point vaccination (CP), door to door vaccination (DD), capture-vaccinate-release (CVR) and oral rabies vaccination (ORV). Vaccination by the CP method involves prior community awareness of the campaign and notification of the location where it will be held. Vaccinators set up a clinic in a convenient location and wait for dog owners to bring dogs to them. Vaccination by DD involves vaccination teams walking through a community and asking dog owners to present their dogs for vaccination. Vaccination by CVR requires a trained and properly equipped staff to move through a community vaccinating accessible (through owner presentation) and inaccessible (through nets and control poles) dogs. Vaccination by ORV involves the distribution of oral rabies baits to free-roaming dogs (owned or unowned).
Allocation
The model begins by defining the dog population structure.

where D T is the user-defined total dog population and p(C i) is defined as the proportion of the dog population in each confinement status category: always under owner confinement (C), sometimes confined (SC) and never confined (NC).Footnote 1
A similar process is used to allocate the procured vaccine supply to each distribution method used in the campaign.

where S T is the user-defined total number of vaccines doses procured and p(m j) is defined as the proportion of vaccine doses allocated to each distribution method in the campaign: CP, DD, CVR and ORV (see footnote 1).
Accessibility
The next step in the model determines the number of dogs in each confinement category that is accessible by a given vaccination method, using vaccination method efficacy estimates provided by the user. Users are able to directly define the expected proportion of dogs that can be reached in each segment of the population by each distribution method (i.e. accessible). Alternatively, predefined effectiveness matrices are provided based on a country's current vaccination coverage levels and data obtained from the previously published global dog rabies elimination pathway (GDREP) (Box 1) [Reference McNeil25].

where p(i|j) is defined as the probability of vaccinating a dog in confinement category i using method j (see footnote 1).
Box 1. Global dog rabies elimination pathway vaccination effectiveness by strategy and phase

Vaccination
An iterative set of equations are used to define the number of vaccinated dogs in each confinement category by vaccination method, using the number of allotted vaccines for the campaign. A pre-defined rank order is defined to determine which population category would be most accessible for a given vaccination method and allocated vaccines are applied to that population category first, before applying the remainder of vaccines to the next confinement category and so on, until all vaccine is utilised. If the iterative process is complete and vaccines remain, they are classified as wastage (w). If vaccines are depleted before the iterative processes is completed, no vaccines will be allocated to the remaining dog populations.

where x defines the rank order for allotting the vaccine doses as outlined below (see footnote 1).

Summation
A final summation of the number of vaccinated dogs by confinement category is completed and used for calculating all other summary statistics (e.g. vaccination coverage).

To provide an estimated confidence range around each point estimate of the vaccination coverage, users are asked to indicate their confidence in their provided inputs on a scale from one to ten (one being not confident and ten being very confident). The confidence rank (CR) is used to approximate a measure of variance for calculating confidence intervals for results related to vaccination coverage.

where

The CR is a user provided value. A weighted deviation is calculated for the number of dogs vaccinated in each population group according to the proportion of vaccines used by each distribution method. The weighted deviation score was used as a proxy for standard deviation to calculate confidence intervals by the standard method.
Cost estimates
Costs commonly encountered during a rabies vaccination campaign were derived from subject matter experience and published articles [Reference Kayali18, Reference Lapiz19, Reference Kaare26–Reference Tenzin and Ward29]. Costs were validated through international workshops with vaccination program managers. Cost data used for this analysis were provided from the Haiti Ministry of Agriculture and are reflective of true costs incurred by their dog rabies vaccination program during 2015–2017. While these costs were fixed for the analysis, they are user-defined values in the tool to reflect the costs and efficiencies for limitless variations of vaccination campaigns.
Validation
We evaluated the model by comparing real-program field outcomes to model-predicted outputs. We developed a standardised data collection tool which was distributed to vaccination program managers in Haiti, Ethiopia, Malawi, India and Sri Lanka (see Supplemental 1). These programs were selected based on the recent publication of vaccination activities or through collaboration networks [Reference Gibson30, Reference Wallace31]. Up to four respondents familiar with the program were selected from each vaccination campaign. Furthermore, we included publications from 2010–2017 that reported the input data necessary to run the model, as well as post-vaccination evaluation results derived from either dog-marking or household survey methods [Reference Kayali18, Reference Lapiz19, Reference McNeil25–Reference Tenzin and Ward29, Reference Lechenne32, Reference Muthiani33]. Respondents were neither given access to the vaccination tool nor were they allowed to alter input data based on model output. Coverage estimates for each campaign were also modelled using input values derived from the GDREP (Box 1) [Reference Wallace20].
We compared the model-derived vaccination coverage (predicted) to the coverages obtained from field post-vaccination evaluations (observed) and provide the results as the mean and absolute differences in coverage. We calculated the aggregate differences between predicted and observed values and corresponding 95% confidence interval (CI). Predicted vaccination coverage rates were plotted against observed coverages. Correlations were calculated by the Pearson product-moment correlation coefficient (r), coefficient of determination (r 2) and 2-tailed P-value (alpha = 0.05).
Intra-class correlations were used to evaluate consistency in the respondent's input values using a one-way random effects model to measure consistency between raters within a single campaign and consistency in responses between campaigns [Reference Koo and Li34]. The Shrout-Fleiss reliability score was used to calculate correlation scores for dog population groups and vaccine accessibility by distribution methods [Reference Shrout and Fleiss35]. Correlations scores <0.4 were considered poor, between 0.4 and 0.59 fair, between 0.6 and 0.74 good and >0.74 excellent. Only campaigns with three or more respondents were analysed for consistency.
Sensitivity analysis was conducted to explore two primary vaccination outcomes: impact of dog confinement rates on vaccination coverage and impact of vaccination method on campaign cost (see Supplemental 2).
Results
Data derived from four published and nine unpublished dog vaccination campaigns that satisfied the inclusion criteria were used to evaluate the vaccine model (13 total campaigns evaluated) (Table 1). Campaigns used in this analysis were conducted in eight countries located in North America, Central America, East Africa, North Africa and Asia. Eighteen unique respondents completed the data collection tool (Table 1). Of the 67 entries used to evaluate the vaccination model, field-derived (i.e. observed) free-roaming dog vaccination coverage was available for 31 (46.3%) and total dog vaccination coverage was available for 67 (100.0%).
Table 1. Respondent and literature-derived data describing canine rabies vaccination programs across four continents
a Proportion of vaccines allocated to Central Point vaccination method.
b Proportion of vaccines allocated to Door to Door vaccination method.
c Proportion of vaccines allocated to Capture-Vaccinate-Release vaccination method.
d Proportion of vaccines allocated to Oral Rabies vaccination method.
e The user's self-reported confidence in the values provided for the model, with 1 being least confident and 10 most confident.
Columns are merged when all respondents from the same campaign provided the same parameter value. Estimated coverage values in bold are within the confidence limits of the field-measured value.
Respondents reported an average confidence level of 5.9 out of 10, with 10 as the most confident response. The intraclass correlation for dog population distribution and vaccine distribution efficiency reflected some of this uncertainty. Overall, there was poor to fair correlation between users on these values (Table 2). Respondents were fairly consistent when assessing the accessibility of semi-confined dogs. There was generally poor consistency in values provided for the accessibility of all vaccine distribution methods for never-confined dogs.
Table 2. Inter-operator variability for respondent-provided subjective input variablesa

a Intra-class correlations were used to evaluate consistency in the respondent's input values using a one-way random effects model with single rater. The Shrout-Fleiss reliability score was used to calculate correlation scores for dog population groups and vaccine accessibility by distribution methods. Correlations scores <0.4 were considered poor, between 0.4 and 0.59 fair and >0.6 good/excellent.
The mean difference between the estimated and observed free-roaming dog vaccination coverage was 0.5% (95% CI −2.4%, 3.4%) (Table 3). Among the 31 respondent-derived estimates, this mean difference was 0.4% (95% CI −3.3%, 4.1%) and among the eight GDREP-derived estimates the mean difference was 0.7% (95% CI −3.8%, 5.2%). The absolute difference between the estimated and observed free-roaming dog vaccination coverage was 6.7% (95% CI 4.9%, 8.4%). Among the 31 respondent-derived estimates, the mean absolute difference was 6.8% (95% CI 4.4%, 9.2%) and among the eight GDREP-derived estimates the mean difference was 6.2% (95% CI 4.8%, 7.7%). Overall, there was high linear correlation between the observed and predicted free-roaming dog vaccination values (r 2 = 0.84, slope = 1.01, P-value <0.0001) (Fig. 2)
Table 3. Comparison of observed and estimated dog vaccination coverage for free-roaming dogs and the total dog population


Fig. 2. Field-measured vaccination coverage compared to the model-derived estimated coverage among the free-roaming and total dog populations using respondent and GDREP-derived model input values.
The mean difference between the predicted and observed total dog vaccination coverage was −1.7% (95% CI −3.5%, 0.1%) (Table 3). Among the 54 respondent-derived estimates the mean difference was −1.9% and −1.4% among the 13 GDREP-derived estimates. The mean absolute difference was 3.8% (95% CI 2.3%, 5.3%); among respondents, this absolute difference averaged 4.3% and for the GDREP-derived estimates was 2.7%. Overall, there was high linear correlation between the observed and predicted total dog vaccination values (r 2 = 0.96, slope = 1.00, P-value <0.0001) (Fig. 2).
Sensitivity analysis
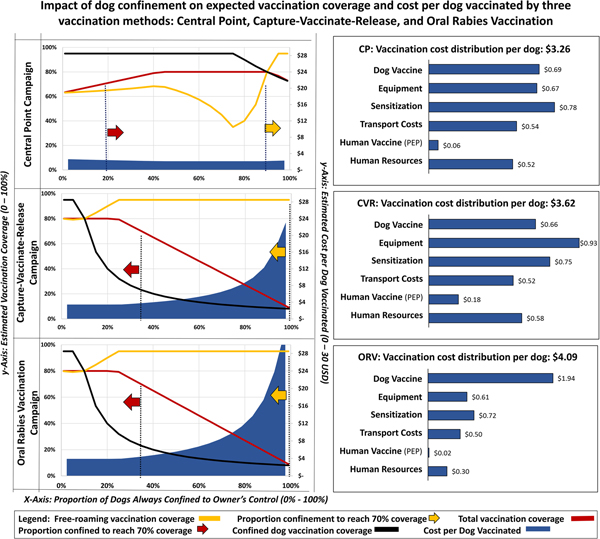
The sensitivity analysis for dog confinement showed that predicted vaccination coverage among the free-roaming dog population is heavily influenced by the vaccination strategy and proportion of dogs that are always under owner confinement. The CP strategy is expected to achieve >70% coverage in free-roaming dogs, but only when the confined dog population exceeded 88% (Fig. 3). Vaccination coverage among the total dog population in the CP strategy is expected to achieve >70% when more than 30% of the dog population is confined. The CVR and ORV strategies are both expected to achieve >70% coverage in the free-roaming dog population regardless of the proportion of confined dogs. Using the respondent-provided mean values for dog confinement (28% confined, 48% semi-confined, 24% never confined), the expected cost-per-dog-vaccinated would be $3.26 for CP campaigns, $3.62 for CVR campaigns and $4.09 for ORV campaigns to achieve 63%, 95% and 95% vaccination coverage in free-roaming dogs, respectively, under the specific parameters used for analysis.

Fig. 3. Sensitivity analysis showing the impact of dog confinement on expected vaccination coverage and cost-per-dog-vaccinated by three vaccination strategies.
Projections from the dog confinement sensitivity analysis suggest that the majority of costs-per-dog-vaccinated under the CP strategy are allocated to campaign awareness ($0.78 USD), followed by vaccines ($0.69 USD) and vaccination equipment ($0.54 USD) (Fig. 3). Under the CVR strategy, the majority of costs-per-dog-vaccinated were allocated to equipment ($0.93 USD), followed by awareness ($0.75 USD) and dog vaccines ($0.66 USD). Under the ORV strategy, the majority of costs-per-dog-vaccinated were allocated to vaccines ($1.94 USD), followed by awareness ($0.72 USD) and equipment ($0.61 USD). The CVR strategy is expected to result in 40 vaccinator bite events per campaign, resulting in an estimated cost to the campaign of $0.18 USD per dog vaccinated, compared to an estimated 12 vaccinator bite events for the CP strategy ($0.06 per dog vaccinated) and three vaccinator bite events for the ORV strategy ($0.01 per dog vaccinated).
Figure 4 shows the results from the ORV and CVR sensitivity analysis. For this analysis, we assumed that GDREP phase I, II and III vaccination strategy effectiveness values were equivalent to programs with poor, moderate and high levels of veterinary capacity. However, since the ORV strategy does not require direct handling of the animal, we fixed the values of ORV strategy effectiveness at GDREP phase III values across the poor, moderate, and high capacity scenarios; this decision was made based on author experience with ORV campaigns in Haiti, Bangladesh and India. This analysis shows that programs with low capacity for handling dogs (GDREP phase I) are unlikely to achieve >70% vaccination coverage in free-roaming dog populations regardless of the number of vaccine doses allocated to the CVR strategy. Conversely, programs with low capacity were able to achieve >70% vaccination coverage when >50% of the vaccination effort was allocated to ORV. The most cost-effective strategy for low-capacity programs, defined as the lowest cost strategy that achieved >70% coverage in the free-roaming dog population, occurred when 70% of the vaccines were distributed by ORV (cost per 1% increase in coverage of $936, free-roaming vaccination coverage of 95%). Adequate coverage (>70%) in moderate animal handling capacity programs (GDREP phase II) was only achieved by the ORV strategy and only when ORV encompassed >40% of the total vaccination effort. Under the high-capacity program setting (GDREP phase III), allocating 10% of vaccines to ORV or 20% to CVR achieved >70% coverage at a cost of $1009 USD and $971 per 1% increase in coverage, respectively.

Fig. 4. Sensitivity analysis showing the impact on cost per marginal increase in vaccination coverage as vaccines are transitioned from CP to CVR and ORV strategies.
Discussion
Campaigns considered in this analysis reflected heterogeneous populations of dogs and campaigns: dog confinement rates varied from 15% to 80%, vaccination strategies included CP, DD, ORV and CVR and programs had varying levels of vaccination experience [Reference Wallace20]. Despite this heterogeneity, the tool gave accurate predictions of dog vaccination coverage, often within 6% of the field-derived vaccination coverage estimates. Prior studies suggest that under ideal circumstances it will take a novice rabies control program approximately 6 years to develop capabilities to reach 70% dog vaccination coverage. Tools that aid vaccination campaign managers to design more cost-effective and efficient campaigns, such as what is described here, can minimise the time and cost to achieve canine rabies elimination [Reference Undurraga23, Reference Tozzi36, Reference Tago37].
This model more accurately estimated vaccination coverage among total dog populations than free-roaming dog populations (Table 3). Population and vaccination coverage estimation methods for free-roaming dogs often have a high degree of error, as the methods are fraught with uncertainty and require a substantial number of assumptions [Reference Belo38]. As a result, post-vaccination coverage estimates in free-roaming dogs can be difficult to assess with any degree of certainty. The reduced accuracy of this tool for free-roaming dogs may be partly due to decreased accuracy in the field-derived vaccination coverages reported from the campaigns in this study. There may also be other variables influencing free-roaming dog population vaccination coverage that are either unaccounted for or inadequately represented in our model assumptions. Despite slightly less accurate predictions, the model was still reasonably accurate at predicting the vaccination coverage in free-roaming dogs and could be useful in planning effective intervention strategies.
When the observed vaccination coverage was outside of the range of the model's predictions, model values more frequently erred on under-estimating field-derived vaccination coverages (Fig. 2). This is reassuring, as the majority of campaigns, had they utilised this tool to plan their campaign, would have achieved greater vaccination coverage than predicted. This tool is intended to aid in more efficient planning of campaigns when limited data are available. However, every dog vaccination program should incorporate routine and representative post-vaccination evaluation to ensure that the anticipated vaccination goals are met [Reference Lapiz19].
Evaluation of respondent-provided input data revealed a large degree of uncertainty and disagreement among respondents regarding their input values for dog confinement and vaccination strategy effectiveness (Table 2). These are characteristics of dog populations and vaccination campaigns that are often difficult to measure, even for experienced vaccination program managers. This may indicate that when the tool is used to strategise new methodologies it may be prone to less accurate user input values and less accurate results. The GDREP-recommended values for vaccination strategy effectiveness resulted in more accurate coverage predictions when compared to respondent-provided values, suggesting that when users lack confidence in their responses GDREP values should be considered (Table 2).
It is well recognised that, where effective, CP vaccination is relatively inexpensive and more easily implemented compared to other vaccination strategies. However, CP vaccination may not be effective for certain dog populations. In this analysis, introducing CVR or ORV into a CP-focused strategy was shown to improve both cost-savings and vaccination coverage, assuming a heterogeneous dog population (Fig. 4). In high-performing, experienced vaccination programs, allocating 10% of vaccines to ORV or 20% to CVR reduced the cost of the campaign by 12% and 8%, respectively, and brought the free-roaming vaccination coverage above 70%. Where vaccinator experience is limited, the only scenario examined in this study that achieved >70% free-roaming dog coverage was when >50% of the vaccines were distributed by ORV. This is largely a reflection of the limited vaccinator training that was assumed to be required for staff distributing oral rabies vaccines. While ORV was found to result in a higher cost-per-dog-vaccinated under the majority of scenarios explored in this study, vaccination program managers should consider the long-term cost of using less-expensive methods that do not achieve effective vaccination levels in the susceptible dog population. The cost analysis in this study is only representative of the specific scenarios used to evaluate this model; any program considering incorporating alternative vaccination methods into their program should use this tool or a similar process to determine the likely cost and effectiveness of the intervention for their unique setting.
Transitioning vaccination strategies from CP towards CVR is expected to increase coverage among the free-roaming dog population, but it comes with additional costs and considerations. The majority of CVR strategy costs comes from the procurement of specialised equipment, such as nets, control-poles and protective gloves (Fig. 3). Additional costs resulted from PEP provided to vaccinators bitten in the line of duty, which was estimated to increase 2.5-fold under the CVR strategy. Transitioning from CP to an ORV strategy had similar benefits for increasing vaccination coverage among free-roaming dogs, but resulted in far fewer vaccinator bite events. The sensitivity analysis conducted in this study supports that the CP strategy should be a primary component of the most-any vaccination program, but also emphasises the importance of utilising a mixed-methods approach to improve coverage among free-roaming dogs when vaccinator experience is limited or when there are numerous free-roaming dogs. This vaccination tool provides a method for vaccination coordinators to devise a tailored mixed-methods vaccination approach while considering costs, effectiveness and the risk of injury and possible rabies exposures to their staff.
Inter-method cost comparisons are limited in this analysis, as very little data exist for CVR and ORV campaigns. For example, WHO and OIE recommend that ORV be used only under settings where the community has been sensitised to the risks and benefits of oral vaccines and where surveillance systems are capable of detecting unintended vaccine exposures and can provide appropriate post-exposure care [Reference Lapiz19]. Costs for these additional requirements were not considered in this study, and may limit where ORV can be appropriately incorporated into a vaccination program. Another limitation of the cost analysis presented here is the lack of analysis around the rate of dogs vaccinated per person (vaccinator capacity). Published data related to vaccinator capacity is uncommon and there are numerous external variables that can influence this value. Users of this tool should carefully consider this input parameter and recognise that it could have significant impacts on campaign costs and the expected duration of the campaign. As with any model, the predictions are only as accurate as the data provided by the user. The vast heterogeneity in dog populations and community acceptance of dog-centred health interventions may lead to scenarios that were not considered in this analysis.
Conclusion
We identified five key steps to successful vaccination of dogs and from this built a dynamic model to estimate the effectiveness of a user-defined vaccination campaign (Fig. 1). The model was validated using data and experience from multiple international vaccination campaign managers and results suggest that the model is highly accurate at estimating vaccination coverage outcomes. The sensitivity analysis highlighted how the inclusion of alternative vaccination methods under most scenarios would result in reduced costs and increased effectiveness. We probed which vaccination methods may be most appropriate under differing dog population dynamics and found that inclusion of ORV strategies into programs with less-developed veterinary infrastructure may improve the likelihood of eliminating canine rabies, but programs with high levels of animal handling experience and communities with high levels of confined dogs can achieve this goal without relying upon ORV. Further studies examining the cost-effectiveness of programs utilizing alternative vaccination methods would allow for additional validations of this model. Optimistically, use of this tool by rabies vaccination coordinators (be they national governments or local non-governmental organisations), may help to conduct more cost-effective, successful campaigns, thereby accelerating canine rabies elimination efforts.
Disclaimer
The findings and conclusions presented here are reflective of the authors and do not necessarily represent the policy of the Centers for Disease Control and Prevention.
Supplementary material
The supplementary material for this article can be found at https://doi.org/10.1017/S0950268819001158
An online version of the vaccination campaign planning tool can be found at: https://rabiestaskforce.com/toolkit/vaxplan/
Acknowledgements
Haiti Ministry of Agriculture and Rural Natural Development: Fleurinord Ludder, Pierre Dilius. Christian Veterinary Mission: Kelly Crowdis
Mission Rabies: Julie Corfmat, Stacy Daniella Sequeira, Gowri Yale, Paul Grossman, Jordana Burdon-Bailey, Samantha Green, Mark Green, Dananjaya Karunaratna, Waruna Hewa Vitharana
Global Alliance for Rabies Control: Daniel Stewart
Centers for Disease Control and Prevention: Sylvia Murphy
Ohio State University: Alexandra Medley


 Open access