


Academic achievement is one of the most important indicators of students’ current learning status, and it predicts students’ future development (Winne & Nesbit, Reference Winne and Nesbit2010). Learning motivation is one of the most important predictors of academic achievement. The relationship between these two concepts has been examined in many studies in this field. Different theories define motivation in different ways (Pritchard, Campbell, & Campbell, Reference Pritchard, Campbell and Campbell1977; Wigfield & Eccles, Reference Wigfield and Eccles1992). In the current study, we explore the relationship between students’ learning motivation and academic achievement using the person-centered approach in self-determination theory (SDT), which is a widely used framework of human development (Ryan & Deci, Reference Ryan and Deci2000).
Learning motivation is defined under SDT as the reason students engage in different school activities (Ryan & Deci, Reference Ryan and Deci2000). SDT distinguishes different types of motivation by the degree of self-determination on a continuum. In this framework, intrinsic motivation refers to engaging in an activity for its own inherent rewards, and for the pleasure and satisfaction derived from participating in it (Ryan & Deci, Reference Ryan and Deci2000). Extrinsic motivation refers to engaging in an activity for instrumental reasons. Extrinsic motivation can also be distinguished as external regulation, introjected regulation, identified regulation, and integrated regulation, from low to high self-determination (Ryan & Deci, Reference Ryan and Deci2000). External regulation refers to behaviors motivated by pressure and demands to produce specific outcomes external to oneself. Introjected regulation refers to behaviors performed in response to internal pressures such as obligation or guilt. These two types of regulation are jointly termed controlled regulation (Shahar, Henrich, Blatt, Ryan, & Little, Reference Shahar, Henrich, Blatt, Ryan and Little2003; Vansteenkiste, Simons, Lens, Sheldon, & Deci, Reference Vansteenkiste, Simons, Lens, Sheldon and Deci2004). Identified regulation refers to behaviors performed when individuals identify with the reasons for the behavior or when they personally find the behavior important. Integrated regulation refers to behaviors performed when individuals feel the action is part of who they are. Identified regulation, integrated regulation, and intrinsic motivation are forms of autonomous motivation.
Two approaches can be used to explore the relationship between learning motivation and academic achievement. The first is the variable-centered approach (e.g., multiple regression or correlational procedures), which focuses on how levels of global learning motivation are associated, on average, with different levels of academic outcomes. Many variable-centered studies have found that autonomous motivation is more beneficial to individuals’ developmental outcomes than more controlled forms of extrinsic motivation (Benware & Deci, Reference Benware and Deci1984; Cerasoli, Nicklin, & Ford, Reference Cerasoli, Nicklin and Ford2014). For example, autonomously motivated individuals have been found to more actively engage in learning activities and to prefer more challenging tasks, while extrinsically motivated individuals are more passive (Benware & Deci, Reference Benware and Deci1984). Autonomously motivated individuals also show higher levels of creativity (Prabhu, Sutton, & Sauser, Reference Prabhu, Sutton and Sauser2008), cognitive flexibility, and deep information processing (Gagné & Deci, Reference Gagné and Deci2005). Many studies have found a positive association between autonomous motivation and academic achievement (see the meta-analysis by Cerasoli, Nicklin, & Ford, Reference Cerasoli, Nicklin and Ford2014). On the other hand, controlled motivation has been found to be associated with the use of maladaptive learning strategies (Vansteenkiste, Zhou, Lens, & Soenens, Reference Vansteenkiste, Zhou, Lens and Soenens2005), a higher rate of dropout (Vallerand, Fortier, & Guay, Reference Vallerand, Fortier and Guay1997), and lower academic achievement (Soenens & Vansteenkiste, Reference Soenens and Vansteenkiste2005).
Variable-centered studies have often considered autonomous and controlled motivation to be mutually exclusive. However, recent studies have suggested that these types of motivation are not necessarily antagonistic and can even work together (Gillet, Vallerand, & Rosnet, Reference Gillet, Vallerand and Rosnet2009; Lepper, Corpus, & Iyengar, Reference Lepper, Corpus and Iyengar2005). To fill this gap, a limited number of studies have used the person-centered approach to explore autonomous and controlled motivation simultaneously. Different from the variable-centered approach, the person-centered approach (e.g., cluster analysis and latent class analysis) focuses on how individuals vary in their multiple motivation profiles and how different profiles are associated with academic outcomes. For example, Hayenga and Corpus (Reference Hayenga and Corpus2010) found four motivation profiles in middle school students: a “high quantity” profile characterized by high levels of both autonomous and controlled motivations, a “high quality” profile characterized by high autonomous but low controlled motivation, a “poor quality” profile characterized by low autonomous but high controlled motivation, and a “low quantity” profile characterized by low levels of both kinds of motivation. The four types of motivation profiles were also found in high school and college students (Vansteenkiste, Sierens, Soenens, Luyckx, & Lens, Reference Vansteenkiste, Sierens, Soenens, Luyckx and Lens2009; Wormington, Corpus, & Anderson, Reference Wormington, Corpus and Anderson2012). However, for elementary students, Corpus and Wormington (Reference Corpus and Wormington2014) found only three types of profiles, and the “low quantity” profile was not detected. Although these studies explored learning motivation via the person-centered approach, three important issues remain unaddressed.
First, cognitive ability or intelligence and motivational factors are the two most commonly mentioned determinants of academic achievement (Gagné & Père, Reference Gagné and St Père2001). To explore only the relationship between the motivation profiles and academic achievement, it is necessary and crucial to control for intelligence. Gagné (Reference Gagné1999) affirmed that intelligence is the basic starting point of any structured learning activity, and general intelligence progressively transforms and adapts to create the skills and competencies for a specific field. In contrast, motivation plays the role of a facilitator or catalyst in the learning process (Gagné & St Père, Reference Gagné and St Père2001). In other words, intelligence is a more direct predictor of academic achievement than motivation. Some studies have found that gifted children also show higher levels of curiosity and intrinsic motivation than other children (Gottfried & Gottfried, Reference Gottfried and Gottfried1996; Lloyd & Barenblatt, Reference Lloyd and Barenblatt1984). Therefore, the effects of motivation and intelligence may overlap, and the effect of motivation may partly reflect an individual’s intelligence if intelligence is not controlled for. A previous study found that the effect of learning motivation (need achievement and intrinsic motivation) was greatly reduced when IQ entered the regression model (Lloyd & Barenblatt, Reference Lloyd and Barenblatt1984). Gagné and St Père (Reference Gagné and St Père2001) even found that the effect of intrinsic and extrinsic motivation among high school students was not significant after controlling for students’ IQ. Therefore, for both theoretical and statistical reasons, it is necessary to explore the unique effect of motivation quality after controlling for intelligence in a person-centered study. However, to our knowledge, no person-centered study has explored the relationship between motivation profiles and academic achievement after controlling for children’s intelligence.
Second, the person-centered studies mentioned above were all conducted in Western cultures. Students’ motivation is influenced by their cultural context through their internalization of cultural values and beliefs. On the one hand, China is influenced by Confucian philosophies, and the ideology of learning is more than simply the pursuit of knowledge and skills, as it is often considered to be in the West (Li, Reference Li2002, Reference Li2005). Effort and persistence in learning are considered a moral endeavor. Many studies have indicated that Chinese children have a higher level of academic motivation than their American counterparts as early as the beginning of elementary school (see Pomerantz, Ng, & Wang, Reference Pomerantz, Ng, Wang, Maehr, Karabenick and Urdan2008). In addition, whereas individualism characterizes Western culture, collectivism is emphasized in China, and individuals are considered to be interdependent (Markus & Kitayama, Reference Markus and Kitayama1991). Thus, student conformity to the expectations of their parents, teachers and other important others is highly valued (Salili, Reference Salili1996). Chinese students’ academic motivation may be both individual and social in this context. A previous cross-culture study found that extrinsic and individualistic achievement goals were highly correlated for Chinese individuals, whereas these two concepts were unrelated for British individuals (Salili, Reference Salili1996). In other words, autonomous and controlled motivation may overlap to some extent for Chinese students. Therefore, the different relational schema of autonomous and controlled motivation may result in different motivation profiles for Chinese and Western students.
Third, most person-centered studies in this field have used the cluster analysis method. Because the variables used in cluster analysis are at the observed level, these data are scale dependent, which means that variables with large mean differences or standard deviations may contribute more to the results of the cluster analysis (Everitt, Reference Everitt1980).
Furthermore, there are no statistical standards for choosing the best model in traditional cluster analysis, so researchers’ subjectivity may bias their choice of a solution, and the results of the cluster analysis may vary depending on the cluster method employed (Aldenderfer & Blashfield, Reference Aldenderfer and Blashfield1984; Mun, von Eye, Bates, & Vaschillo, Reference Mun, von Eye, Bates and Vaschillo2008). Compared with cluster analysis, latent profile analysis (LPA) provides a more flexible framework. Cluster analysis requires clusters to have equivalent variances, but LPA does not have such a restriction (Vermunt & Magidson, Reference Vermunt, Magidson, Hagenaars and McCutcheon2002). This advantage is important because it is often not realistic to assume that variances are equal across classes. LPA is a model-based method that uses an iterative estimation function (e.g., the maximum likelihood method and the maximum-posterior method) to assign cases to categories of an underlying latent variable. Because the variables used in the model are measured at the latent level, measurement error is partitioned and reflected in estimates of within-class residual variance (Muthén & Muthén, Reference Muthén and Muthén2000). Furthermore, LPA provides a series of model fit indicators to help in choosing the best model.
In the current study, we aimed to identify subgroups of Chinese children in Grades 4 to 6 based on the children’s math motivation, using LPA. The age range of 8–11 years is a key period for forming different self-perceptions of school subjects (Harter, Reference Harter1999). Children younger than this age generally believe that they are good at everything or bad at everything (Harter, Reference Harter1999). Therefore, it is necessary to distinguish different motivations across subjects in this period. We chose math motivation because previous studies have found that a gradual decline in intrinsic motivation appears even for 3rd-grade students, and the rate of decline is much larger for math than for reading and for school in general (Gottfried, Fleming, & Gottfried, Reference Gottfried, Fleming and Gottfried2001). Most students feel that math is harder than other subjects (Stodolsky & Grossman, Reference Stodolsky and Grossman1995). We then tested the relationship between motivational profiles and math achievement after controlling for children’s IQ. This issue is particularly important in considering whether motivation profiles can explain additional variance after accounting for IQ. Math motivation has an influence on children’s math achievement that can be subject to modification or intervention. Thus, identifying which types of motivation profiles are beneficial or detrimental to children’s math achievement is of great importance for education.
Method
Participants and procedure
The respondents in this study were 2,289 4th–6th grade students from five elementary schools in Beijing, China. The data were collected using questionnaires that were administered to students from these five schools. We used the data from respondents who participated in all three parts of the survey (motivation, cognitive ability, and math ability), and after we excluded questionnaires with a missing rate >20%, the final sample included 2,137 students from all three elementary grades. Of these students, 1,138 were boys (53.3%), and 999 were girls (46.7%). In addition, 875 (40.9%) were in Grade 4, 629 (29.4%) were in Grade 5, and 633 (29.6%) were in Grade 6. The mean age of the students was 11.22 years (SD = 0.99).
Before the investigation, a combined training of the investigators (psychology and pedagogical postgraduates) was conducted. The students completed the motivation questionnaires, a standardized math test, and Raven’s Standard Progressive Matrices (SPM) independently in class. The parents of all children provided consent for the use of the data from the questionnaire in the current study.
Measures
Math achievement
We tested the students’ mathematics achievement using the standardized Mathematics Achievement Test for elementary school students (Grades 4–6). The Mathematics Achievement Test mainly measures the dimensions of numbers and algebra, space and shapes, and statistics and probability (Dong & Lin, Reference Dong and Lin2011). In Grade 4, there were 32 items. The coefficient of difficulty ranged from .25–.91, and the average coefficient of difficulty was .7. The coefficient of discrimination ranged from .16–.67, and the average coefficient of discrimination was .39. In Grade 5, there were 28 items. The coefficient of difficulty ranged from .14–.95, and the average coefficient of difficulty was .56. The coefficient of discrimination ranged from .08–.82, and the average coefficient of discrimination was .38. In Grade 6, there were 28 items. The coefficient of difficulty ranged from .32–.98, and the average coefficient of difficulty was .77. The coefficient of discrimination ranged from .02–.83, and the average coefficient of discrimination was .34. Students completed this test in class within 45 min. The original scores in the three grades were translated into a range of 0–100. Then, the scores were standardized by grade as the index of students’ math achievement.
Raven’s Progressive Matrices
Raven’s SPM (Chinese version) were utilized to assess the children’s intelligence (Zhang & Wang, Reference Zhang and Wang1989). Following instructions, the items are presented according to their level of difficulty. According to Raven, a standard SPM is estimated to be completed in 45 min. One point is awarded for each correct choice, and the total scores are calculated out of 60 points. The raw scores are converted to standardized scores within ages.
Math motivation
Math motivation was measured by the Elementary School Motivation Scale (ESMS; Guay et al., Reference Guay, Chanal, Ratelle, Marsh, Larose and Boivin2010). This scale was translated into Chinese by two independent graduate students. An expert was consulted when disputes arose. In addition, we asked some elementary students to answer this questionnaire to ensure they could understand the language. This nine-item questionnaire contains the following three dimensions: intrinsic motivation, identified motivation, and controlled motivation. Guay et al. (Reference Guay, Chanal, Ratelle, Marsh, Larose and Boivin2010) assessed introjected and external regulation jointly under the construct of controlled regulation to reduce the number of items for which young children would have to provide responses. Because integrated regulation occurs only in adolescents, this construct is not assessed in this scale. Each dimension contains three items. The children were asked to indicate the extent to which each item applied to them according to the following scale: (1) never, (2) sometimes no, (3) I don’t know, (4) sometimes yes, and (5) always. In the current study, Cronbach’s alpha for the entire questionnaire was .73. Cronbach’s alphas for the intrinsic motivation, identified motivation and controlled motivation subscales were .90, .83 and .73, respectively.
Data analysis strategy
Less than 3% of the data were missing for all variables included in the analysis. The multiple imputation method was used to address missing data. The use of multiple imputation in a variety of missing data situations has been well studied (Schafer & Graham, Reference Schafer and Graham2002), and this method has been shown to be appropriate for different missing patterns.
To determine the optimal number of latent groups that could be identified from the continuous indicator variables in the data, we conducted an LPA using Mplus 7.4. We used several fit statistics to determine which model fit the data best: Akaike’s information criterion (AIC), Bayesian information criterion (BIC), adjusted BIC (ABIC), the Vuong-Lo-Mendell-Rubin likelihood ratio test (VLMRT), and entropy. For the AIC, BIC, and ABIC, lower values indicate a better fitting model (Flaherty & Kiff, Reference Flaherty, Kiff, Cooper, Camic, Long, Panter, Rindskopf and Sher2012). The VLMRT compares models for k and k-1 classes. If the ratio test results in a significant p value, the k class model is a better fit than the k-1 class model (Tofighi & Enders, Reference Tofighi, Enders and Hancock2008). Higher entropy indicates less classification error (Collins & Lanza, Reference Collins and Lanza2010), and we confirmed that the classes were large enough to be meaningful and of practical value (Marsh, Lüdtke, Trautwein, & Morin, Reference Marsh, Lüdtke, Trautwein and Morin2009).
After determining the number of classes that fit the data best, we applied the Bolck-Croon-Hagenaars (BCH; Bolck, Croon, & Hagenaars, Reference Bolck, Croon and Hagenaars2004) method to test the relationship between motivation profile and children’s math academic achievement after controlling for children’s intelligence. The disadvantage of the traditional three-step method is that the estimates obtained in the third step are attenuated because of the classification error introduced when assigning individuals to classes (Bolck et al., Reference Bolck, Croon and Hagenaars2004). The BCH method is recommended for LPAs with continuous distal outcomes (Asparouhov & Muthen, Reference Asparouhov and Muthén2014). The BCH method involved performing a weighted analysis of variance, with posteriori class membership probabilities as weights, similar to the multigroup model in structural equation modeling (SEM; Asparouhov & Muthen, Reference Asparouhov and Muthén2014). Differences in profile-specific means for the outcome variables were then tested using Wald chi-square tests (Bakk & Vermunt, Reference Bakk and Vermunt2016).
In addition, to explore the quality difference of different motivation profiles, we created a score to indicate motivation quality, which was calculated by subtracting the z score for controlled motivation from the z score for autonomous motivation (intrinsic motivation + identified motivation). Because the positive effect of autonomous motivation and the negative effect of controlled motivation have been identified by many previous studies (see the meta-analysis by Cerasoli et al., Reference Cerasoli, Nicklin and Ford2014), a high score can reflect the optimal structure of motivation. This indicator has been used by many previous studies (Sheldon & Kasser, Reference Sheldon and Kasser1995; Vansteenkiste et al., Reference Vansteenkiste, Sierens, Soenens, Luyckx and Lens2009).
Results
Confirmatory factory analyses of Motivation Questionnaire
Confirmatory factory analyses (CFAs) were conducted using SEM in Mplus 7.4. The model fit statistics for the motivation questionnaire were all acceptable: χ2 = 166.14, df = 24, p < .001, χ2/df = 6.92, confirmatory fit index (CFI) = 0.99, Tucker-Lewis index (TLI) = 0.98, root mean square error of approximation (RMSEA) = .05.
Descriptive statistics
Descriptive statistics and correlations for the key study variables are shown in Table 1. Intrinsic motivation and identified motivation were both negatively associated with controlled motivation, but the correlations were small. Intrinsic motivation and identified motivation were positively associated with math achievement, and controlled motivation was negatively associated with math achievement. Furthermore, the correlations between children’s IQ and math achievement were larger than those observed for the different types of motivation.
Table 1. Means, standard deviations, and correlations for the key variables
Note: *p < .05; **p < .01.
Descriptions of the five profiles based on math motivation
To identify the best fitting model, we tested models varying from two- to six-class solutions. Table 2 shows the goodness-of-fit measures that we used to determine the number of classes that provided the best fit for our data. We chose the five-class model because of its significant p value from the VLMRT and its larger entropy value and smaller AIC, BIC and ABIC values relative to the other models.
Table 2. Model fit indices
Note: AIC = Akaike’s information criterion, BIC = Bayesian information criterion.
As shown in Figure 1, the first profile was characterized by high levels of intrinsic motivation and identified motivation and low levels of controlled motivation, so we described it as the “high quality” profile (profile 1). This profile represented 65.2% (n = 1,393) of the sample. The second profile was described as the “high quantity” profile (profile 2) and was characterized by high levels of all three kinds of motivation. This profile represented 6.4% (n = 137) of the sample. The third profile exhibited low levels of all three kinds of motivation. Therefore, we named this profile the “low quantity” profile (profile 3), and it represented 17.5% (n = 375) of the sample. The fourth profile was characterized by low levels of intrinsic motivation and identified motivation and high levels of controlled motivation, so we described it as the “poor quality” profile (profile 4). This profile represented 4.0% (n = 86) of the sample. The fifth profile exhibited an average level of controlled motivation and very low levels of intrinsic motivation and identified motivation. Therefore, we named this profile the “low autonomous motivation” profile (profile 5), and it represented 6.8% (n = 146) of the sample.
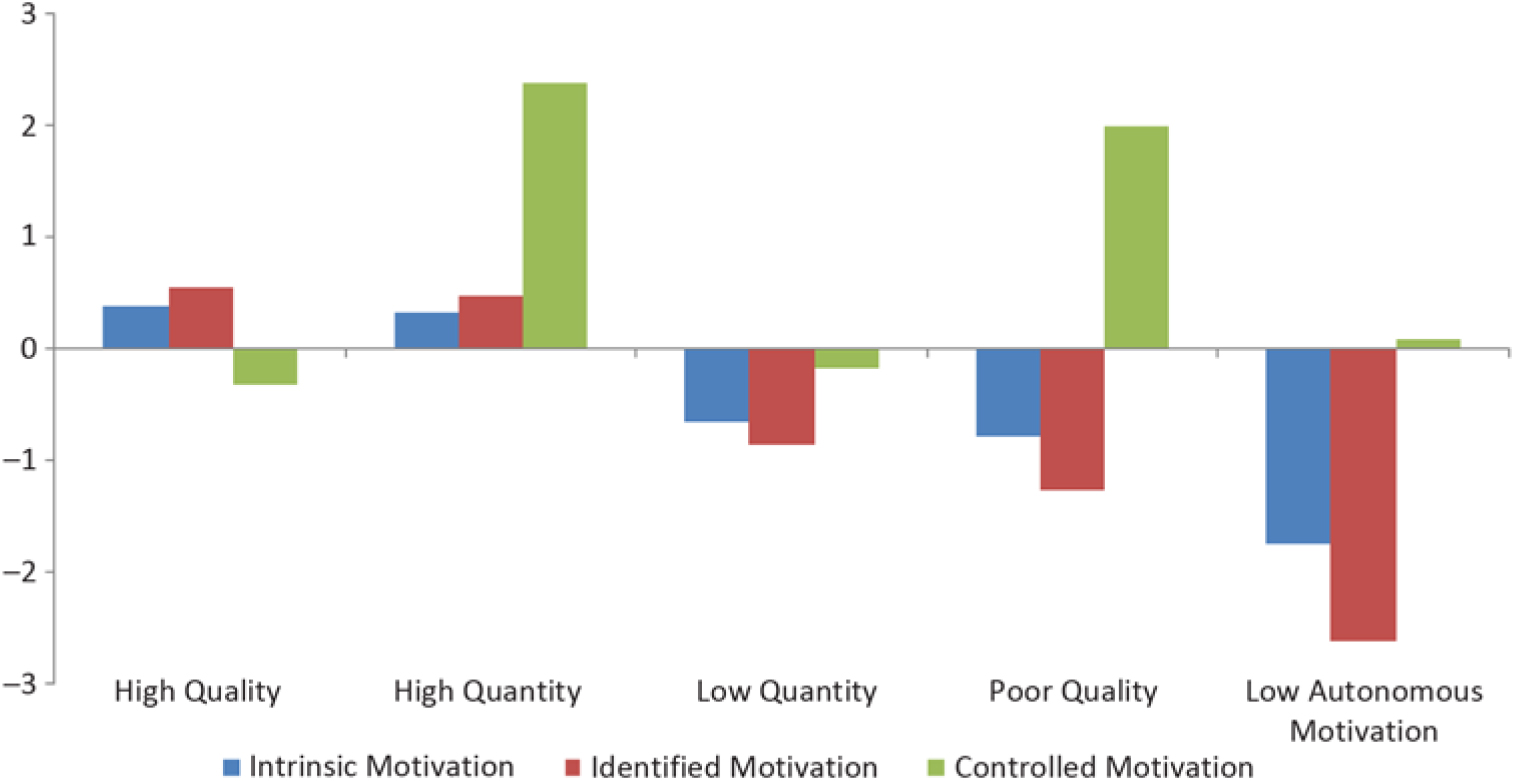
Figure 1. Profiles of math motivation; all variables were standardized.
We created a score that was calculated by subtracting the z score for controlled motivation from the z score for autonomous motivation as the indicator of quality of motivation. These scores were deemed useful because they allowed for a direct examination of whether the retained profiles differed with respect to the quality of motivation. The BCH results showed the following: high quality profile (1.34 ± 0.04) > low quantity profile (−1.43 ± 0.10) > high quantity profile (−1.8 ± 0.17) > low autonomous motivation profile (−4.33 ± 0.17) = poor quality profile (−4.71 ± 0.22). All effects were significant at the 0.01 level according to Wald chi-square tests.
The relationship between motivation profile and math achievement
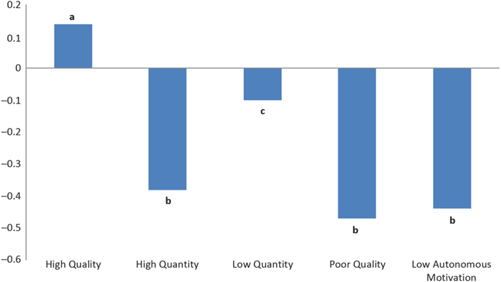
As shown in Figure 2, after we controlled for students’ IQ, students with the high quality profile (0.14 ± 0.03) showed the highest math achievement compared to students in the other profiles. Students with the low quantity profile (−0.01 ± 0.06) showed higher math achievement than those in the high quantity profile (−0.38 ± 0.1), poor quality profile (−0.47 ± 0.13) and low autonomous motivation profile (−0.44 ± 0.09). There were no significant differences between the high quantity profile, the poor quality profile, and the low autonomous motivation profile.
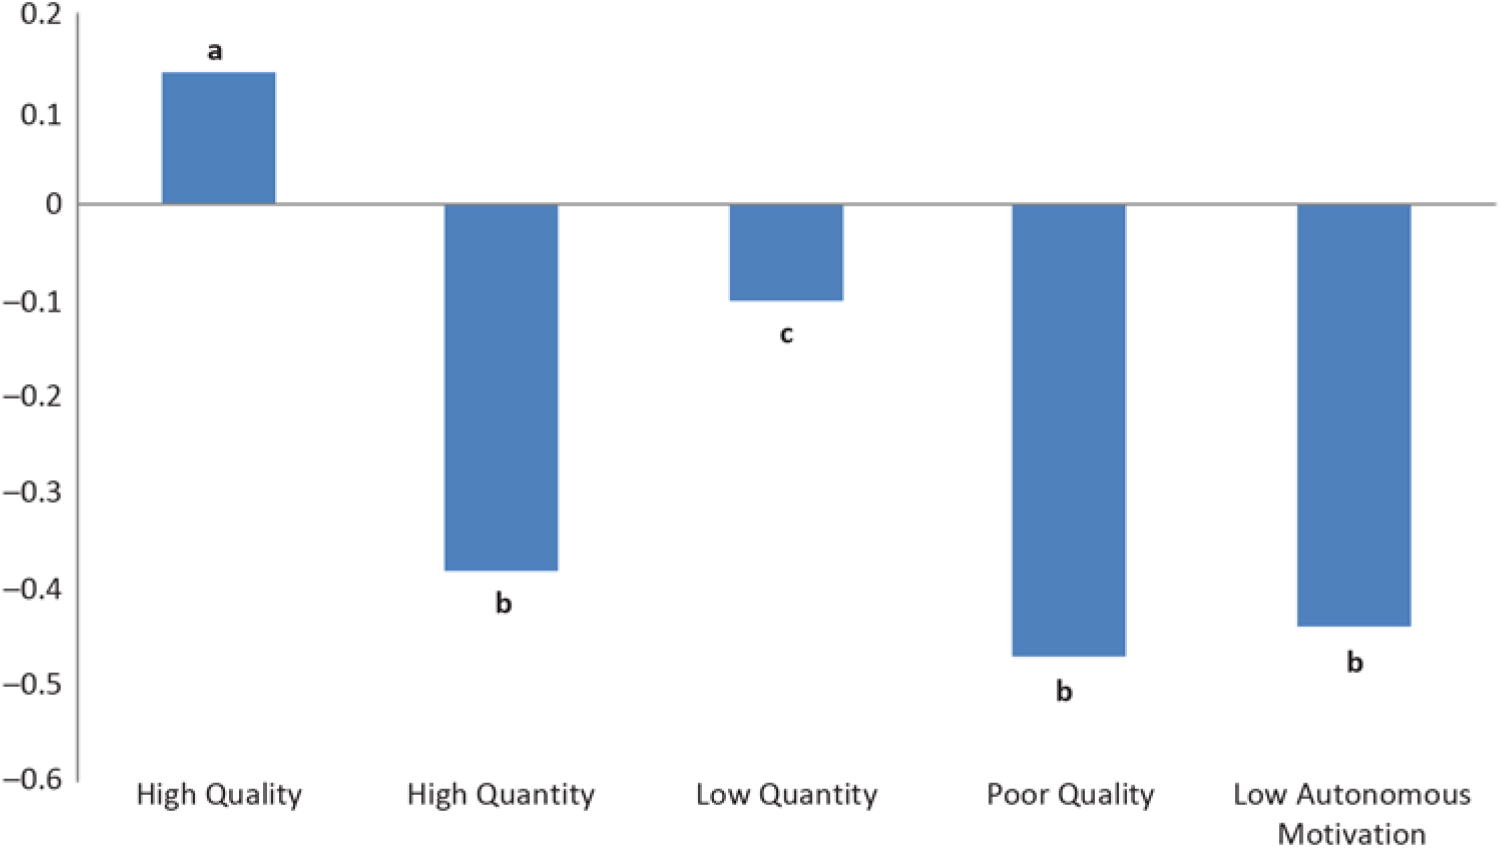
Figure 2. Math achievement by students motivation profiles. Adjusted mean scores for student math achievement. The mean scores were adjusted by controlling for students’ IQ. Math achievement within a row sharing the different superscripts (a, b and c) are significantly different at the p < .05 level.
Discussion
In the present study, intrinsic motivation and identified motivation were both negatively associated with controlled motivation, but the correlations were small. This result is consistent with previous studies indicating that these motivation constructs are relatively orthogonal (Hayenga & Corpus, Reference Hayenga and Corpus2010; Lepper et al., Reference Lepper, Corpus and Iyengar2005; Vansteenkiste et al., Reference Vansteenkiste, Sierens, Soenens, Luyckx and Lens2009; Wormington et al., Reference Wormington, Corpus and Anderson2012). Consistent with previous variable-centered studies, intrinsic motivation and identified motivation were positively associated with math achievement, and controlled motivation was negatively associated with math achievement.
In addition, we used LPA to identify five profiles of children’s math motivation under the SDT framework: a high quality profile (profile 1: 65.2%), a high quantity profile (profile 2: 6.4%), a low quantity profile (profile 3: 17.5%), a poor quality profile (profile 4: 4.0%) and a low autonomous motivation profile (profile 5: 6.8%).
Profiles 1 to 4 were consistent with those observed in most previous studies (Hayenga & Corpus, Reference Hayenga and Corpus2010; Vansteenkiste et al., Reference Vansteenkiste, Sierens, Soenens, Luyckx and Lens2009; Wormington et al., Reference Wormington, Corpus and Anderson2012). The high quality profile in our study represented the majority of the sample, indicating that the development of math motivation was positive for most of the children. The proportion of children in this profile was much higher than the proportion observed in the previous studies mentioned above. For example, in the study by Corpus and Wormington (Reference Corpus and Wormington2014), which also focused on elementary students, the proportion of students in the high quality profile was only 33.67%. This result may reflect cultural differences. Most previous studies were conducted in Western cultures, and a prior study found that Chinese students’ learning motivation was higher than that of their Western peers (Salili, Reference Salili1996; Wang & Pomerantz, Reference Wang and Pomerantz2009).
Unlike Corpus and Wormington (Reference Corpus and Wormington2014), whose study was also conducted on elementary students, we found a low quantity profile that was absent from their study. This result may be due to the different types of motivation examined in these two studies. Our study focused on math motivation, which is different from general learning motivation in school. A previous study found that students generally feel that math is harder than other subjects and are less engaged in math learning from elementary to high school (Stodolsky & Grossman, Reference Stodolsky and Grossman1995). Furthermore, we identified a low autonomous profile that was not discovered by previous studies. This profile showed the lowest levels of intrinsic and identified motivation and a nearly average level of extrinsic motivation. This profile was similar to some extent to the poor quality profile in terms of motivation pattern. Therefore, we also tested a four-profile model to explore whether these two profiles would merge into one profile. However, the results indicated that even in the four-profile model, these two profiles still existed independently. The extremely low levels of intrinsic and identified motivation for math indicated that these students may have shown the lowest interest in math and that they did not realize the importance of learning math. This phenomenon may be attributed to the subject characteristics of math. Compared with other school subjects, students feel that math is harder, and teachers experience less autonomy with regard to teaching math course content (Stodolsky & Grossman, Reference Stodolsky and Grossman1995). Due to the scarcity of empirical evidence regarding these profiles, more studies are needed to explore the underlying reason for the findings.
We also examined the relationship between these profiles and math achievement after controlling for students’ IQ. We created a score by subtracting the z score for controlled motivation from the z score for autonomous motivation, which reflected the quality of motivation (Sheldon & Kasser, Reference Sheldon and Kasser1995; Vansteenkiste et al., Reference Vansteenkiste, Sierens, Soenens, Luyckx and Lens2009). For this indicator, the results showed the following: high quality profile (1.34 ± 0.04) > low quantity profile (−1.43 ± 0.10) > high quantity profile (−1.8 ± 0.17) > low autonomous motivation profile (−4.33 ± 0.17) = poor quality profile (−4.71 ± 0.22). Math achievement in different motivation profiles was almost consistent with this indicator for math achievement: high quality profile (0.14 ± 0.03) > low quantity profile (−0.01 ± 0.06) > high quantity profile (−0.38 ± 0.1) = low autonomous motivation profile (−0.44 ± 0.09) = poor quality profile (−0.47 ± 0.13). This result indicated that quality was more important than quantity. For example, although autonomous motivation in the high quantity profile was higher than that in the low quantity profile, the high controlled motivation in the high quantity profile counteracted the positive effect of autonomous motivation.
It is worth noting that the low autonomous motivation profile was a new finding that was not discovered by previous studies. Although there were no differences between the low autonomous motivation profile, the high quantity profile and the poor quality profile on math achievement, it is necessary to intervene in different ways for different combined types of motivation from an applied perspective. The extremely low levels of math intrinsic and identified motivation in the low autonomous motivation profile indicated that these students may have the lowest interest in math. In Chinese schools, the main subjects such as math are taught from lower to higher grades in a progressive manner with increasing difficulty (Fu, Chen, Wang, & Yang, Reference Fu, Chen, Wang and Yang2016); students who lose interest in math in elementary school may find it very difficult to catch up later.
Cerasoli et al. (Reference Cerasoli, Nicklin and Ford2014) proposed a new theory to explain the combined effect of intrinsic and extrinsic motivation. They distinguished two kinds of extrinsic motivation: direct extrinsic motivation, which provides a clear, proximal link between an incentive and performance, and indirect extrinsic motivation, which still relates to performance, but the link is less clear and direct. Only direct extrinsic motivation can weaken the effect of intrinsic motivation because extrinsic incentives become the more salient factor in performance, and the predictive utility of intrinsic motivation will be weakened because it is no longer the sole salient motivational determinant of performance. This phenomenon can be called the “crowding out” effect (Frey & Osterloh, Reference Frey and Osterloh2005; Gagné & Forest, Reference Gagné and Forest2008). The controlled motivation measured in our study is clearly directly related to academic achievement (e.g., I do math to get a nice reward; I do math to please my parents or my teacher). Thus, extrinsic motivation showed a comparable undermining effect to the promotional effect of autonomous motivation in our study.
This study had certain limitations. First, it was cross-sectional and therefore could not determine causal relationships. The students’ high intrinsic motivation was also possibly due to previous high academic achievement. Thus, more longitudinal studies are needed. Second, only math achievement was included as an outcome variable in the current study. Although math achievement across the high quantity, poor quality and low autonomous motivation profiles was not significant, math-related emotion (e.g., math anxiety) needs to be explored across different profiles. Third, the current study was conducted with a sample from Beijing, a highly developed city in China. Thus, more research is needed to investigate the generalizability of these findings in other places in China and in other countries.
Financial Support
This study was funded by the Major Projects of National Social Science Fund of China (16ZDA229).


 Open access