


1. Introduction
Millions of people worldwide participate in game hunting every year as a part of social tradition and culture that supports livelihoods and contributes to food security (Di Minin et al., Reference Di Minin, Clements, Correia, Cortés-Capano, Fink, Haukka, Hausmann, Kulkarni and Bradshaw2021). Over 11.5 million people in the United States hunted in 2016 and spent over $26.2 billion on hunting trips and equipment (U.S. Department of the Interior et al., 2018). White-tailed deer (Odocoileus virginianus) is the big game hunted most commonly and more than 5.7 million white-tailed deer were harvested annually between 2014 and 2019 in the United States alone (National Deer Association, 2021). Despite such hunting, the populations of many big game species like deer are increasing in the United States. In addition to meeting household protein needs and keeping popular outdoor traditions alive, sport hunting is an effective tool to manage game populations (Vercauteren et al., Reference Vercauteren, Anderson, Van Deelen, Drake, Walter, Vantassel and Hygnstrom2011). In the absence of hunting, there could be significant economic costs with respect to damage from wildlife (e.g., crop damage, wildlife–vehicle collisions) as well as the diversion of public funding on the part of wildlife agencies to control their population.
Typically, hunters consume the game they harvest without having to test for disease. However, that may depend largely upon the health of the herd, and the presence of disease could affect hunters’ behavior. The emergence of chronic wasting disease (CWD) is an example of such a disease, as it has led to reluctance to hunt white-tailed deer and other cervids such as mule deer (Odocoileus hemionus), elk (Cervus canadensis), and moose (Alces alces). CWD is a contagious and fatal neurological disease that affects free-ranging cervids (Edmunds et al., Reference Edmunds, Kauffman, Schumaker, Lindzey, Cook, Kreeger, Grogan and Cornish2016) and has been detected in 26 US states, three Canadian provinces, and many other countries around the world, including South Korea, Norway, Finland, and Sweden (Ableman et al., Reference Ableman, Hynes, Schuler and Martin2019). The U.S. Centers for Disease Control and Prevention (CDC) recommends testing harvested deer and advises people not to consume meat from a CWD-positive deer (U.S. Centers for Disease Control and Prevention, 2021). As the incidence of CWD has grown, CWD testing has also increased over the years in the United States. A total of 32 states reported testing 59,046 samples for CWD in 2008, while in 2018, 41 states reported testing 175,478 samples (QDMA, 2020). Thus, CWD has increased hunters’ concerns about the safety of consuming venison and their intention to hunt deer in infected areas.
Disease in deer populations can lead to hunters’ significant loss of welfare, as deer hunting is a highly popular recreational activity (Erickson, Reeling, and Lee, Reference Erickson, Reeling and Lee2019; Mingie et al., Reference Mingie, Poudyal, Bowker, Mengak and Siry2019). In addition to the effect on hunters themselves, the presence of the disease is also believed to have adverse effects on rural businesses that serve the hunting industry and wildlife management agencies because of the loss of license revenue (Bishop, Reference Bishop2004). The most vulnerable local businesses include lease hunting, sporting goods, food and beverage, and meat processing. A significant proportion of hunters hunt on leased land, and many use local processing facilities to process their harvest; therefore, these businesses could experience an immediate decline because of disease in the region’s deer herds. For example, in New York state, approximately 61% of successful hunters took a harvested deer to a meat processing facility at least once in the past five years (Siemer, Lauber, and Stedman, Reference Siemer, Lauber and Stedman2020). Similarly, the rise of CWD in Wisconsin decreased the demand for deer hunting permits by 5.4% and resulted in a loss of nearly $17 million in permit sale revenues during 2002–2015 (Erickson et al., Reference Erickson, Reeling and Lee2019). These documented declines in hunting and hunting-related businesses show the enormity of the economic ramifications of the disease.
The literature on hunters’ behavior in general suggests that hunting and deer consumption decisions are affected by the perceived risk that disease is present in the game population (Bishop, Reference Bishop2004; Kadohira et al., Reference Kadohira, Phiri, Hill, Yoshizaki and Takai2019). A study of hunters in Canada found that they are willing to pay up to $20 per trip to avoid an increased CWD prevalence because of lack of management or unsuccessful management actions (Zimmer, Boxall, and Adamowicz, Reference Zimmer, Boxall and Adamowicz2012). Studies that have modeled CWD’s effect on hunting site choice found mixed results, particularly when comparing urban and rural hunters (Truong, Adamowicz, and Boxall, Reference Truong, Adamowicz and Boxall2018). While some attitudinal surveys have found that the perception of CWD’s risk declines over time (Holland et al., Reference Holland, Haus, Eyler, Duda and Bowman2020; Vaske and Miller, Reference Vaske and Miller2019), an economic study conducted in Canada found no significant change in the value of the hunting experience over years (Truong et al., Reference Truong, Adamowicz and Boxall2018).
The presence of CWD can have an adverse influence on hunters’ motivation to hunt in affected areas, at least in the initial years. This is also the period when wildlife agencies need to take aggressive actions to control the disease’s spread. Declines in hunting because of diseases such as CWD can increase many social and conservation concerns. First, many families in rural areas depend on game meat in part for an affordable source of animal protein (Gillin et al., Reference Gillin, Cornicelli, Drew, Fischer, Mawdsley, Straka, Wild, Boswell, Munk, Pybus, Fish and Jennifer Ramsey2018). Second, hunting traditions that contribute to family and social cohesion may vanish from society (Needham, Vaske, and Manfredo, Reference Needham, Vaske and Manfredo2006). Third, wildlife agencies face management challenges to achieve the goal of herd reduction, which has been considered effective in preventing the spread of certain diseases like CWD (Vaske, Reference Vaske2010). With fewer hunters hunting in CWD-affected regions, relying on hunter harvests as a strategy to combat CWD may not be a viable management option for these agencies (Holsman, Petchenik, and Cooney, Reference Holsman, Petchenik and Cooney2010).
To achieve the herd reduction goal to control the spread of CWD, it is important for wildlife agencies to encourage continued hunting in areas affected by the disease. This could be accomplished either by offering direct monetary incentives or removing regulatory or market-related barriers (Petchenik, Reference Petchenik2006; Vaske, Reference Vaske2010). However, direct monetary incentives that are funded by taxpayers are neither an effective nor preferred option (Petchenik, Reference Petchenik2006). Thus, removing existing barriers is a more socially acceptable strategy. One of the barriers hunters face in harvesting more deer in CWD-affected regions is the processing cost associated with infected animals. Currently, it takes approximately two weeks for hunters to learn the results of CWD testing, while they have to pay for the processing cost first. If the harvested deer test positive, they lose the processing cost for that deer and have to pay another fee for a new deer, which may also have the risk of testing positive (Vaske, Reference Vaske2010). Currently, deer hunters have to wait a long period of time to learn the outcome of CWD testing. This is because CWD testing is allowed only in a very few accredited national laboratories, and wildlife agencies, rather than the hunters themselves, arrange the testing process. Thus, establishing a market-based scheme rather than indemnity payments from taxpayer money to address this issue can be a useful option to minimize the decline in hunters’ participation in CWD-affected areas.
A market-based scheme to avoid the loss of the deer processing cost reduces the potential economic burden on hunters and may also help sustain the game processing businesses in rural areas. When hunters participate voluntarily in such a cost recovery scheme, they may pay meat processors a nominal fee in addition to the regular processing cost in exchange for free processing of the second deer if the first deer tests positive for CWD. This could be a viable market-based incentive for both hunters and local meat processors. Without any economic incentives, meat processors are also reluctant to process deer harvested from high-risk CWD areas (Beringer et al., Reference Beringer, Hansen, Millspaugh and Meyer2003). Keeping the local game processors in CWD-affected regions in business is critical from the disease surveillance perspective because wildlife agencies rely on the local processors to collect samples for testing. For example, with the help of local processers, the wildlife agency in Tennessee collected more than 17,000 samples for CWD testing in just eight Western counties during the 2018–2020 deer seasons.
Addressing existing barriers, such as avoiding the processing cost burden, can help reverse the decline in hunters’ participation in deer hunting and support CWD management simultaneously (Petchenik, Reference Petchenik2006; Vaske, Reference Vaske2010). However, it is unknown whether hunters will participate in such a cost recovery scheme and how much they may be willing to pay to do so. It may be equally important to provide options for the processors if offering options to their clients is profitable with the current CWD prevalence rates. To fill these gaps in knowledge, this study was conducted to determine the way hunting characteristics, the source of CWD information from wildlife agencies, risk perception, and socioeconomic characteristics affect hunters’ interest in participating in a processing cost recovery scheme and estimate their willingness to pay (WTP) to avoid losing the deer processing cost because of CWD. As far as we are aware, there is no study related to hunters’ demand to avoid the game processing cost burden.
2. Methods
2.1 Conceptual Framework
Assume that a hunter with an annual income of m pays a local processor p for deer processing. The hunter loses the processing cost, p, if the deer tests positive for CWD. If the probability of CWD risk is π, every hunter who is rational, risk-averse and has a strictly concave utility function will pay q to avoid the CWD risk and losing the deer processing fee. Economic theory states that when individuals face uncertain situations, they will act in such a way that they choose the option that maximizes their expected utility (Nicholson and Snyder, Reference Nicholson and Snyder2008). The maximum amount of risk premium (q) can be determined as follows:
 $$E{U_1} = \left( {1 - \pi } \right) \cdot U\left( m \right) + \pi \cdot U\left( {m - p} \right)$$
 $$E{U_2} = U\left( {m - q} \right)$$
 $$E{U_2} \ge E{U_1}$$
in which EU 1 is the expected utility without paying q, EU 2 is the expected utility after choosing to pay q, and U(·) is the von Neumann–Morgenstern utility index. In this circumstance, the decision rule is that a hunter increases payment (q) as long as EU 2 ≥ EU 1 . The expected utility framework has been used extensively to determine the willingness to pay for a risk premium against economic loss because of natural hazard risks (King and Singh, Reference King and Singh2020; Talberth et al., Reference Talberth, Berrens, McKee and Jones2006).
The expected utility theory provided the theoretical basis for this study when estimating hunters’ risk premium against potential loss because of CWD risks. The survey questionnaire framed the scenario below and elicited the maximum amount every hunter was willing to pay (q).
One of the concerns regarding CWD testing is processing cost are incurred before hunters find out CWD test result. Since the testing process can only be done in accredited laboratories which take time, one possible way to avoid wasted processing costs for deer testing positive is to establish a process providing a waiver for the associated costs.
Suppose your deer processor offers a voucher for purchase when you pay for processing. If the deer ends up testing positive for CWD, the voucher will be good for free processing of a second deer. Knowing that the purchase of this voucher is optional, and the cost is additional to the processing fee, would you be willing to acquire this voucher for a fee?
□ Yes, I am willing to pay up to $ ________ per deer □ No
Hunters’ willingness to pay amount to avoid the deer processing cost burden was elicited using an open-ended format because an insurance service against CWD risk is not purely a non-market good and hunters are familiar with the deer processing cost and CWD risk in their hunting sites. Under ideal conditions, an open-ended valuation question contains more information than an incentive-compatible discrete choice question; however, the former format can be unreliable because of respondents’ strategic behaviors, such as providing protest zeros and unrealistically high values (Haab and McConnell, Reference Haab and McConnell2003). Although an open-ended question format lacks an incentive compatibility, it can provide efficient estimates even from smaller sample size compared to other formats, when respondents perceive that it is consequential and the sample has fewer protest zeros (Vossler and Holladay, Reference Vossler and Holladay2018). As the outcome equation was estimated based upon non-zero WTP values only, its parameters may have upward bias, i.e., relatively large average WTP values (Balistreri et al., Reference Balistreri, Mcclelland, Poe and Schulze2001).
2.2 Sample Selection Model
In this study, hunters’ decision to participate in the cost recovery scheme, as well as their decision related to the level they were willing to pay to avoid wasting the deer processing cost were both important, as they may help wildlife agencies establish this type of scheme in new contexts. Typically, censored regression models are employed to analyze data generated with an open-ended question format. Among censored models, the sample selection model is preferred to the corner solution model when models related to participation and intensity decisions must be estimated separately (Greene, Reference Greene2018). Further, the corner solution model can be mis-specified when it includes more limit observations or protest zeros (Greene, Reference Greene2018).
While all respondents were asked if they wanted to buy a voucher, only those who agreed were asked to complete the sub question to indicate the maximum amount they were willing to pay. In this context, identifying the determinants of non-zero payment amounts using the ordinary least squares estimator would be biased and inconsistent if such estimates resulted only from non-randomly “selected” observations or observations in which hunters were interested in paying for a voucher. Among sample selection models, a simple two-stage estimator developed by Heckman (Reference Heckman1979) addresses the selection bias and yields consistent estimators of beta (β) coefficients. However, Heckman’s two-step estimator has been criticized because of an inherent problem of multicollinearity among the regressors that included an adjustment variable (Bockstael et al., Reference Bockstael, Strand, Mcconnell and Arsanjani1990; Nawata and Nagase, Reference Nawata and Nagase1996; Puhani, Reference Puhani2000). In addition, the maximum likelihood estimator is preferred to a two-step estimator or an independent ordinary least squares estimator when the errors of the two models related to ‘participation decisions’ and ‘decisions related to level of payment’ are correlated and considered to impose exclusion restrictions in the model.
An econometric model that addresses the selectivity problem consists of two equations, i.e., the selection and outcome equations. The selection equation’s general form can be expressed as follows (Greene, Reference Greene2018):
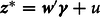 $${{\bf{z}}^{\rm{*}}} = {\bf{w'}}\gamma + u$$
in which latent dependent variable z* depends upon independent variables w . Similarly, γ is the vector of coefficients and u is the error term for the selection model. In this study, z* was represented by a binary variable related to hunters’ WTP for a voucher that would be used for free deer processing. Similarly, w is a vector of the independent variables represented by deer hunting and processing characteristics, awareness and perceived risk of CWD, and socioeconomic characteristics (Table 1). The specific set of independent variables was selected based upon its potential policy implications when wildlife agencies facilitate its implementation at the field level. The equation of main interest, the outcome equation, can be expressed as follows (Greene, Reference Greene2018):
 $$\ln y = {\textbf{x'}\beta} + \varepsilon $$
Table 1. Description of dependent and independent variables used in the sample selection model to quantify hunters’ willingness to pay to avoid the loss of the deer processing cost based on mixed mode survey conducted in the Tennessee in 2019
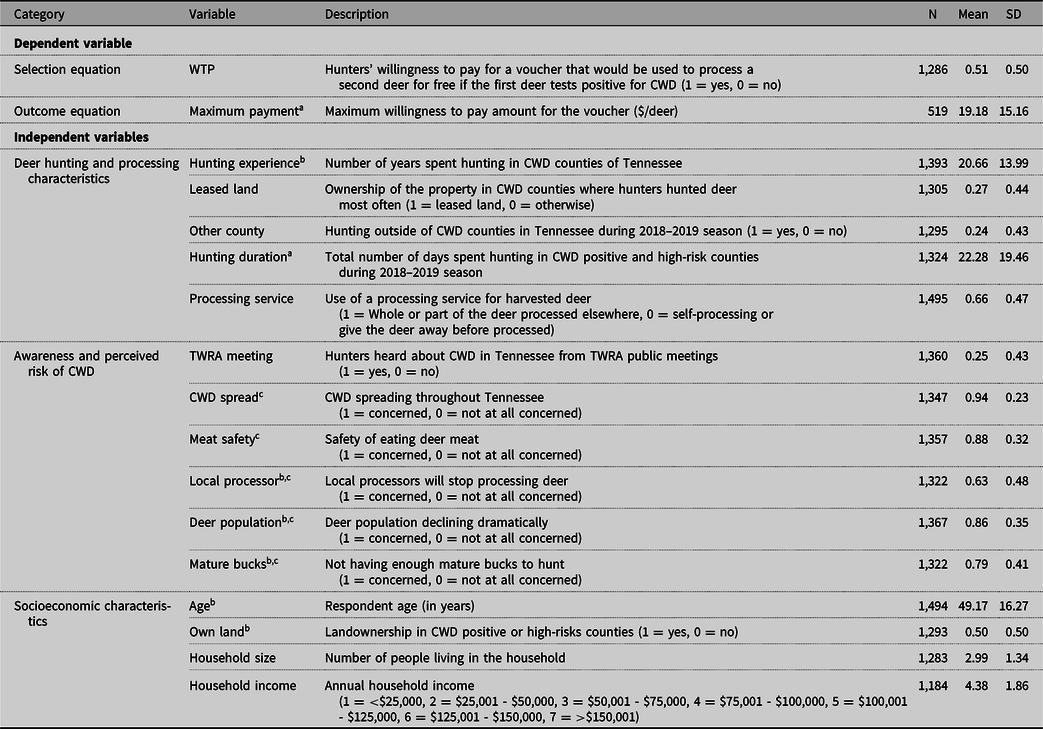
a Used natural logarithm of these variables in regression analysis
b These variables were not used in outcome equation
c These variables were originally measured on a 3-point Likert scale: 1 = not at all concerned, 2 = somewhat concerned, and 3 = very concerned. It was recoded into a binary variable where ‘somewhat concerned’ and ‘very concerned’ were coded as 1 (concerned) and ‘not at all concerned’ coded as 0 (not concerned)
The dependent variable ln y that represents the payment amount for the voucher (after log-transformation) is observed only when z * is greater than zero. In equation 3, x represents another specific set of independent variables listed in Table 1. To improve the identification of the model, particularly the error terms’ correlation coefficient, exclusion restrictions are imposed on the selection equation. Six independent variables that affect hunters’ decision to participate in the scheme, but do not affect their decision related to the level of payment, are used as exclusion restrictions. These six independent variables are hunter age, landownership (own land), hunting experience, perceived risk that local processors will stop processing deer, a decline in deer populations, and not having enough mature bucks to hunt (Table 1). If the errors of equations 2 and 3 are correlated, then the simple linear regression of ln y on x will not estimate consistently because of omitted variables or a sample selection problem and requires the following conditional regression function (Yen and Rosinski, Reference Yen and Rosinski2008):
 $$E\left[ {\left. y \right|{z^*}\,{\rm{ > }}\,0} \right] = exp\left[ {\left. {E({\rm{ln}}\;y} \right|{z^*}{\rm{ > }}0)} \right] = exp\left( {{\bf{x'}}\beta + \sigma _\varepsilon ^2/2} \right)\Phi \left( {{\bf{w'}}\gamma /{\sigma _u} + \rho {\sigma _\varepsilon }} \right)/\Phi \left( {{\bf{w'}}\gamma /{\sigma _u}} \right)$$
in which Φ(·) is the standard normal cumulative density function, ρ is the correlation of the error terms ( u, ϵ ), σ ϵ is the standard deviation of the error ( ϵ ), and σ u is the standard deviation of the error term ( u ). The parameters of the sample selection model specified in equations 2 and 3 were estimated using the full information maximum likelihood (FIML) method. The log likelihood function for both types of observations, i.e., selection (z = 1) and non-selection (z = 0) was as follows (Greene, Reference Greene2018):
 $$\ln L = \sum\limits_{z = 1} l n\left[ {{{exp\left( { - \left( {1/2} \right)\varepsilon _i^2/\sigma _\varepsilon ^2} \right)} \over {{\sigma _\varepsilon }\sqrt {2\pi } }}\Phi \left( {{{\rho {\varepsilon _i}/{\sigma _\varepsilon } + {\rm{ }}{w_i}'\gamma } \over {\sqrt {1 - {\rho ^2}} }}} \right)} \right] + \sum\limits_{z = 0} l n\left[ {1 - \Phi \left( {{w_{i\,}}'\gamma } \right)} \right]$$
In equation 5, ${\varepsilon _i} = {\rm{ln}}\;{y_i} - {\rm{ }}{x_i}{\rm{'}}\beta $
and the parameters of this log likelihood function were estimated explicitly assuming that the error terms have a bivariate normal distribution [0, 0, σ
ϵ
, 1, ρ]. The FIML estimator constrains the error correlation (ρ) to [0, 1], which is not possible in the case of Heckman’s two-step estimator. In addition to the assumption about the stochastic structure (error terms), the model assumes the correct specification of the functional form of the relation implicitly (Van Der Klaauw and Koning, Reference Van Der Klaauw and Koning2003). This log likelihood function was maximized using the STATA command heckman.
${\varepsilon _i} = {\rm{ln}}\;{y_i} - {\rm{ }}{x_i}{\rm{'}}\beta $
and the parameters of this log likelihood function were estimated explicitly assuming that the error terms have a bivariate normal distribution [0, 0, σ
ϵ
, 1, ρ]. The FIML estimator constrains the error correlation (ρ) to [0, 1], which is not possible in the case of Heckman’s two-step estimator. In addition to the assumption about the stochastic structure (error terms), the model assumes the correct specification of the functional form of the relation implicitly (Van Der Klaauw and Koning, Reference Van Der Klaauw and Koning2003). This log likelihood function was maximized using the STATA command heckman.
Parameter estimates (γ) of the selection equation do not represent marginal effects. Thus, the marginal effects for the selection equation, which is a probit equation, can be computed using the following expression (Greene, Reference Greene2018):
 $${{\partial E\left( {\left. {\bf{z}} \right|{\bf{w}}} \right)} \over {\partial {\bf{w}}}} = \phi {\rm{ }}\left( {w'\gamma } \right)\gamma $$
in which z is an indicator variable observed when z* > 0. Similarly, ϕ(·) is a probability density function corresponding to the cumulative density function Φ(·). In the outcome equation, the parameter estimates b also cannot be interpreted as marginal effects because of sample selectivity. Differentiating the conditional regression function (equation 4) gives the marginal effects of each independent variable in the outcome equation as follows (Yen and Rosinski, Reference Yen and Rosinski2008):
 $$\eqalign{ {{\partial E\left[ {\left. y \right|{z^*} > 0} \right]} \over {\partial {x_k}}} = {\left[ {\Phi \left( {{\bf{w'}}\gamma /{\sigma _u}} \right)} \right]^{ - 2}}exp\left( {{\bf{x'}}\beta + \sigma _\varepsilon ^2/2} \right) \times \{ [\Phi \left( {{\bf{w'}}\gamma {\rm{/}}{\sigma _{\rm{u}}}} \right)\phi \left( {{\bf{w'}}\gamma {\rm{/}}{\sigma _{\rm{u}}}{\rm{ + }}\rho {\sigma _\varepsilon }} \right) \cr \,\,\,\,\,\,\,\,{\rm{ - }}\phi \left( {{\bf{w'}}\gamma {\rm{/}}{\sigma _{\rm{u}}}} \right)\Phi \left( {{\bf{w'}}\gamma {\rm{/}}{\sigma _{\rm{u}}}{\rm{ + }}\rho {\sigma _\varepsilon }} \right)]{\mkern 1mu} {\gamma _{\rm{k}}}{\rm{ + }}\Phi \left( {{\bf{w'}}\gamma {\rm{/}}{\sigma _{\rm{u}}}} \right)\Phi \left( {{\bf{w'}}\gamma {\rm{/}}{\sigma _{\rm{u}}}{\rm{ + }}\rho {\sigma _\varepsilon }} \right)\} {\beta _{\rm{k}}} } $$
Equation 7 was used to compute each independent variable’s marginal effects (in terms of dollars). The individual terms in equation 7, such as the probability and cumulative density functions, the error correlation, standard deviation of the error term, and the variable coefficients, were obtained either from the regression results or computed in STATA based upon those results. As the maximum likelihood method was used to estimate the model parameters, the STATA command nlcom (non-linear combination of estimators) was employed to derive point estimates and the standard errors of the marginal effects associated with the outcome equation using equation 7. The command nlcom approximates the standard errors of the marginal effects using the delta method.
2.3 Study Area
The study area for this research was West Tennessee, where CWD was discovered in late 2018 in deer harvested from two counties (Fayette and Hardeman Counties). It has since been detected in eight adjacent counties (Figure 1). The Tennessee Wildlife Resources Agency (TWRA), the state agency responsible for wildlife management in Tennessee, refers to the counties with a confirmed presence of CWD as Positive CWD Counties. An additional four counties have been designated as High Risk CWD Counties because of their proximity to Positive Counties. High Risk CWD Counties currently do not have any known case of CWD, but have a confirmed case within ten miles of the county border. To help contain CWD, TWRA has adopted a variety of approaches, including changing from general surveillance to an intensive monitoring effort to determine CWD’s spatial distribution and prevalence, collecting test samples from local game processors, launching a public information campaign to educate the hunters, changing hunting seasons and bag limits to encourage harvest, placing restrictions on carcass movement/transportation, and enforcing a feeding/mineral ban (TWRA, 2021a). Under these regulations, hunters also receive an unlimited number of replacement antlered deer if they harvest a CWD-positive antlered deer in CWD-affected counties. Similarly, CWD-affected counties have a liberal bag limit for hunting antlerless deer, i.e., 3 deer per day during the hunting season. To help reach the herd reduction goal, TWRA extended the hunting seasons to encourage hunters to harvest more deer from the region and issued landowner CWD management permits to allow the deer on their property to be removed outside of deer hunting season. TWRA is partnering with the US Fish and Wildlife Services to remove deer from private lands in CWD-affected areas with landowner permits. As increased hunting pressure reduced the CWD prevalence level among mule deer herds in Colorado (Miller et al., Reference Miller, Runge, Andrew Holland and Eckert2020), the agency’s recent focus to control CWD is based upon harvesting more deer so that fewer deer can become CWD positive and therefore there is less opportunity for transmission. In many ways, hunter harvesting is likely to be critical in the effectiveness of CWD control programs in Tennessee and neighboring states with confirmed CWD presence (e.g., Arkansas, Mississippi, Missouri, and Virginia).
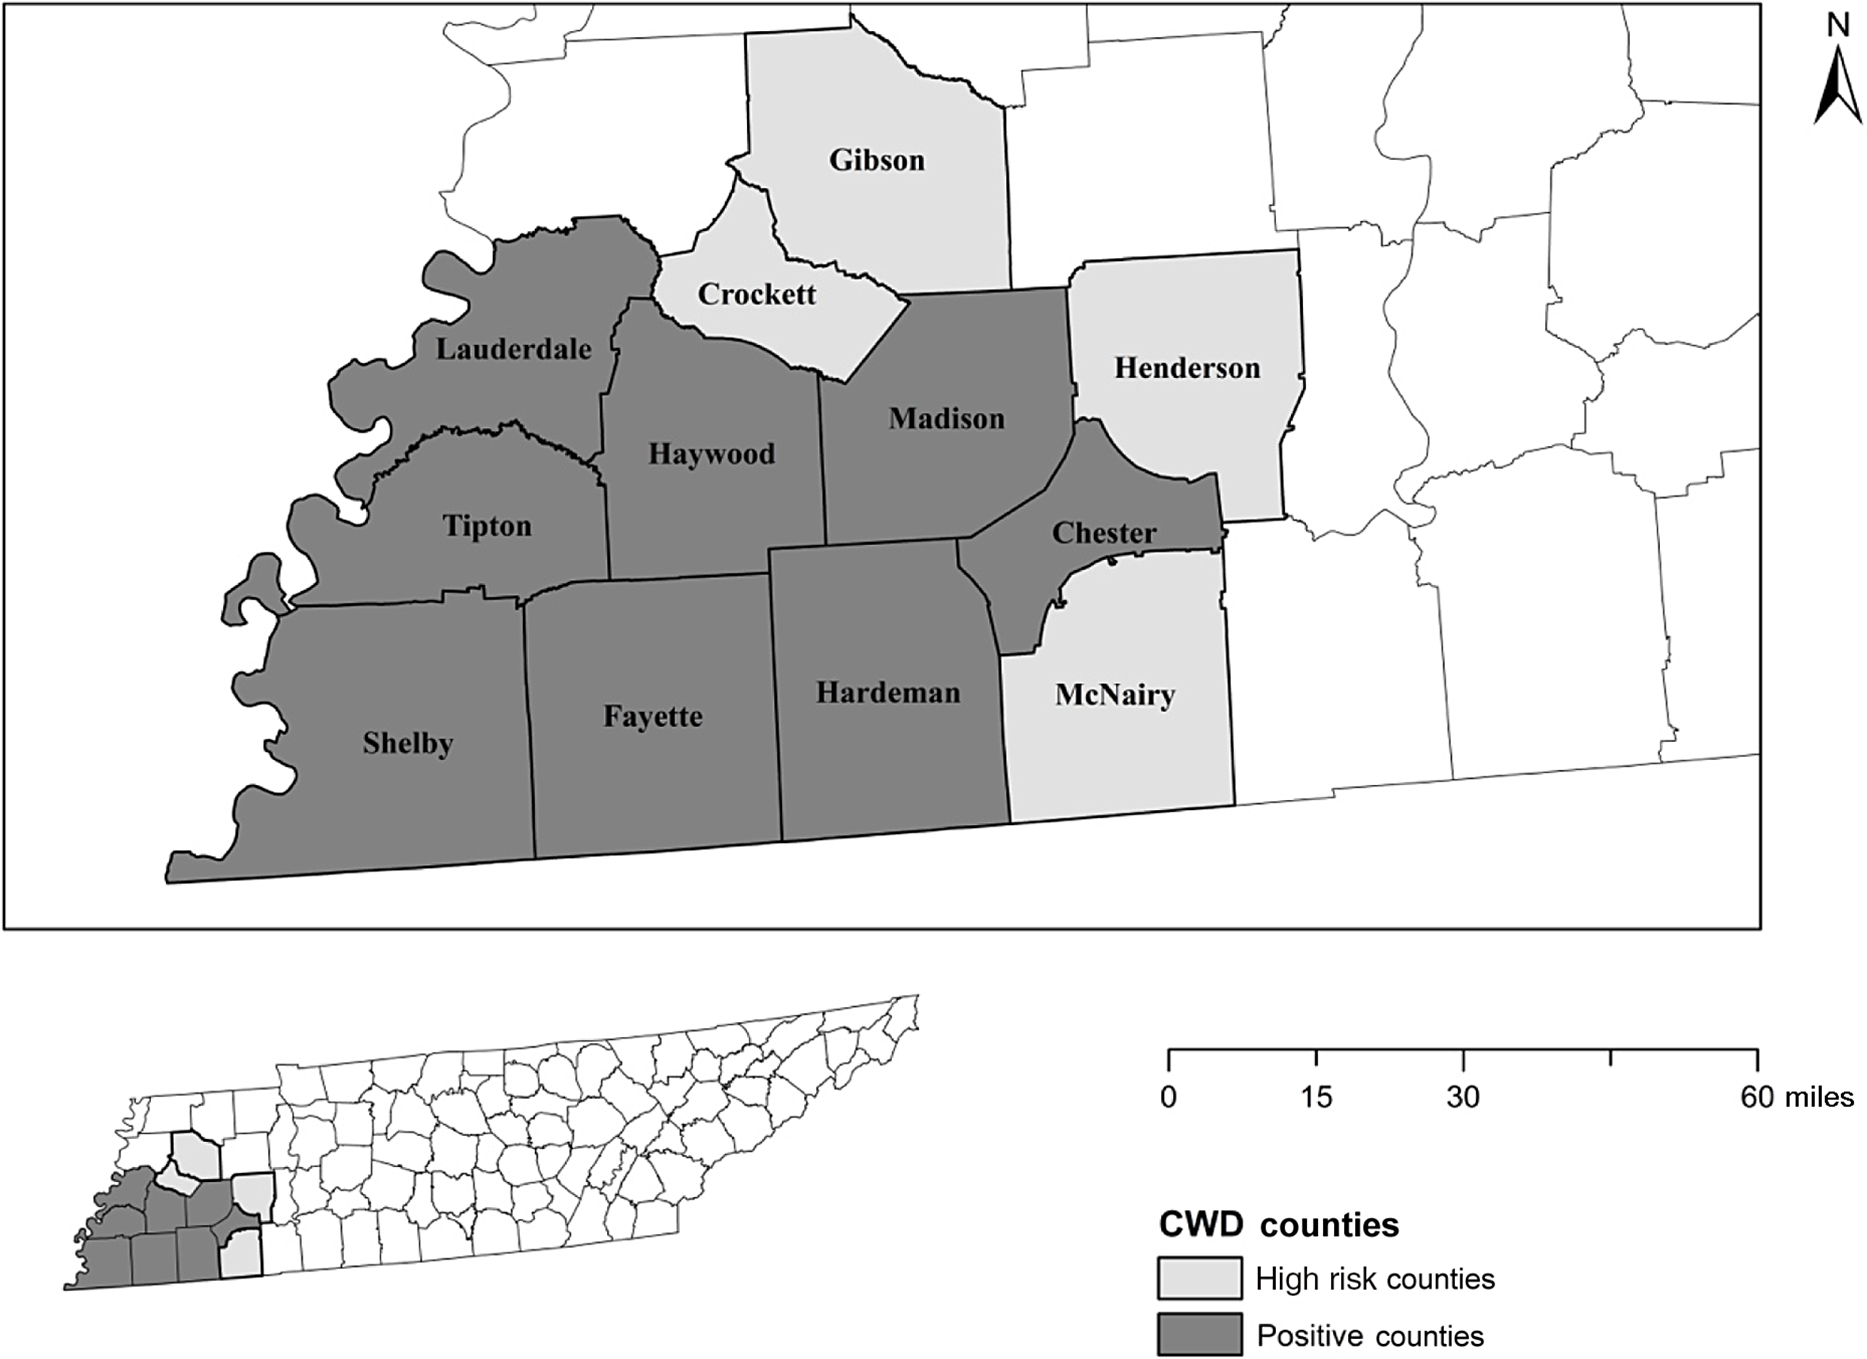
Figure 1. Tennessee counties with the presence of chronic wasting disease as of January 2021.
Big game hunting has a sizable market in Tennessee. In 2011, its total economic contribution was $426 million in output and 2,918 full and part-time jobs (Poudel, Munn, and Henderson, Reference Poudel, Munn and Henderson2016). A total of 106 meat processing facilities serve nearly half a million people who participate in big game hunting in Tennessee (Leffew and Holland, Reference Leffew and Holland2018). Further, there are 27 deer meat processing facilities in the CWD counties alone (Leffew and Holland, Reference Leffew and Holland2018; TWRA, 2021b). Although these facilities slaughter and process other animals throughout the year, processing deer during the hunting season constitutes a sizable proportion of their annual revenues and is critical in sustaining their business.
2.4 Data Collection
A mixed mode survey of 5,000 hunting license holders who reside or hunt in CWD counties (positive and high-risk counties) or those who reported harvesting deer in these counties in the 2018–2019 season was conducted in August-September of 2019. A stratified random sampling method was adopted so that representation was ensured from both positive and high-risk counties. Contact information for these individuals was obtained from the TWRA license database. At the time this survey was implemented, there were three positive counties (Fayette, Hardeman, and Madison) and five high-risk counties (Shelby, Tipton, Haywood, Chester, and McNairy). Following a modified tailored design method (Dillman, Smyth, and Christian, Reference Dillman, Smyth and Christian2014), those with email addresses on file were contacted first by sending a personalized email message with a link to the survey. Those who did not respond to the initial invitation received three follow-up reminder emails. Once the email survey phase ended, the mail survey was administered to those who did not have email addresses on file or did not respond to our email invitations. The mail survey followed a similar process. First, a personalized cover letter that explained the purpose of the survey was mailed together with a copy of the survey questionnaire and a business reply envelope. A week later, a reminder was sent to all of those contacted initially together with a personalized follow-up letter, a copy of the survey questionnaire, and a business reply envelope to encourage participation. No further reminders were sent because many of the questions in the survey were relevant only to preseason assessment and the hunting season had already begun for most hunters.
The survey questionnaire was developed after initial consultation with TWRA staff in the summer of 2019 at TWRA headquarters in Nashville. The draft questionnaire was then shared with TWRA staff, human dimension experts, and a few volunteer hunters to provide feedback. The survey included questions related to their hunting history in the region, annual hunting trips and days, awareness of CWD and perception of its risk, acceptability of various management actions to contain CWD, current practices in processing harvested deer, willingness to participate in a scheme to recover the processing fee for CWD-positive deer, and socioeconomic characteristics. These responses were measured using structured, semi-structured, and open-ended questions.
2.5 Variable Descriptions
The dependent variable for the selection equation was the hunter’s willingness to pay for a voucher that could be used to process a second deer for free if the first deer taken to the processing facility tested positive for CWD (WTP). Similarly, the dependent variable for the outcome equation was the maximum amount a hunter was willing to pay for a voucher (maximum payment). Three categories of independent variables were used in both the selection and outcome equations. Those included deer hunting and processing characteristics, awareness and perceived risk of CWD, and socioeconomic characteristics.
The independent variables related to deer hunting and processing characteristics included years of hunting (hunting experience), ownership type of the hunting property in CWD counties (leased land), hunting outside CWD counties in Tennessee (other county), annual days spent hunting in CWD counties (hunting duration), and use of a processing service for harvested deer (processing service, Table 1). An experience variable was included because hunters with longer hunting experience may be more skilled at processing their own game and have different attitudes regarding the use of processing. In addition, a variable that captured lease hunting was included because lease hunters may differ from those who hunt on their own land or public land with respect to being able to afford the processing cost and having to follow transportation restrictions outside the region because of CWD. The annual number of days of hunting was included to control for avid hunters who spend more time hunting and perhaps have more deer to be processed. Similarly, the use of a processing service was included to analyze whether the demand for such a scheme differs between those who currently do and do not use an outside processor.
Another category of independent variables was represented by the awareness and perceived risk of CWD (Table 1). Those included ‘hunter heard about CWD in Tennessee from recent TWRA public meetings’ (TWRA meeting), and hunter’s risk perception about ‘CWD spreading throughout Tennessee’ (CWD spread), ‘safety of eating deer meat’ (meat safety), ‘local processors will stop processing deer’ (local processors), ‘deer population declining dramatically’ (deer population), and ‘not having enough mature bucks to hunt’ (mature bucks). Finally, hunters’ socioeconomic characteristics, such as age (age), landownership in CWD counties (own land), number of people living in the household (household size), and annual household income (household income) were also used as independent variables (Table 1). Similar to other studies of insurance demand, the inclusion of risk perception is important in this model. The source of information was added to assess whether the wildlife agencies’ recent public campaign was affecting hunters’ intention and behavior. Many hunter studies have indicated that trust in information a wildlife agency provides has a significant effect on hunters’ decision to hunt in CWD areas (Schroeder et al., Reference Schroeder, Landon, Cornicelli, Fulton and McInenly2020). Finally, the socioeconomic variables were included to control for differences in tastes and preferences and income.
3. Results
A total of 1,642 responses were received, for a response rate of 33%. However, the final sample size was limited to 1,495 responses after 147 respondents who indicated that they never hunted in CWD counties were removed. Among the 1,495 responses, a total of 1,091 responses were received through email and 404 responses were received from mailings. Some key variables, such as willingness to participate in the scheme (WTP), maximum payment, age, own land, household size, and household income, were compared using a 2-group t-test between email and mail responses and showed that these two groups did not differ statistically with respect to the key variables, except household income, in which the average household income was higher for email respondents than mail respondents (P < 0.05). Approximately 96% of the respondents were male and the average age was 49 years. Half of the respondents indicated that they own land in CWD counties (Table 1). The respondents’ average household size was 3 and their average annual income was $96,896. The respondents indicated that they have hunted in the region for 21 years on average.
3.1 Deer Hunting and Processing Characteristics
Of the total respondents, 67% went to CWD-positive counties to hunt deer and 52% respondents hunted in high-risk counties over the past two deer hunting seasons. More respondents reported that they hunted most often on non-leased private land (34%) and their own land (33%) then leased (27%) and public land (6%). On average, respondents took 19 deer hunting trips and spent 1.42 days afield per trip during the 2018–2019 season.
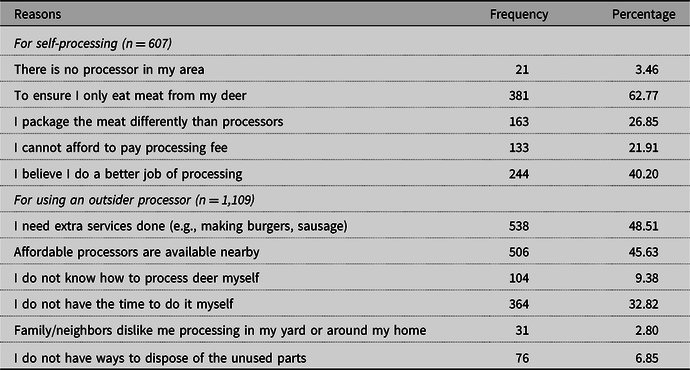
Approximately two-thirds (66%) of the respondents reported that they take all or part of the harvested deer to local processors, while the remaining one-third reported that they process themselves. The major reasons for self-processing were to ensure meat quality (63%) and having better processing skills (40%, Table 2). Similarly, reasons for using local deer processing facilities were the need for extra services (e.g., making burgers, sausage, 49%), affordable processing costs (46%), and lack of time for processing at home (33%, Table 2).
Table 2. Reasons reported for self-processing or using outside processor to process harvested deer based on a survey of Tennessee hunters conducted in 2019
3.2 Decision to Participate in, and Pay for, the Cost Recovery Scheme
Half (51%) of the respondents agreed to participate in the cost recovery scheme to avoid losing the deer processing fee when their deer were found to be CWD positive. Of 650 respondents who were interested, only 519 respondents reported a valid payment level (Figure 2). The distribution of the payment levels the respondents reported was right-skewed. Totally, 76% of the respondents were interested in paying $20 or less per deer. The predicted value of the conditional mean WTP amount was $19.65 per deer with a 95% confidence interval that ranged from $14.94 to $25.85 per deer.
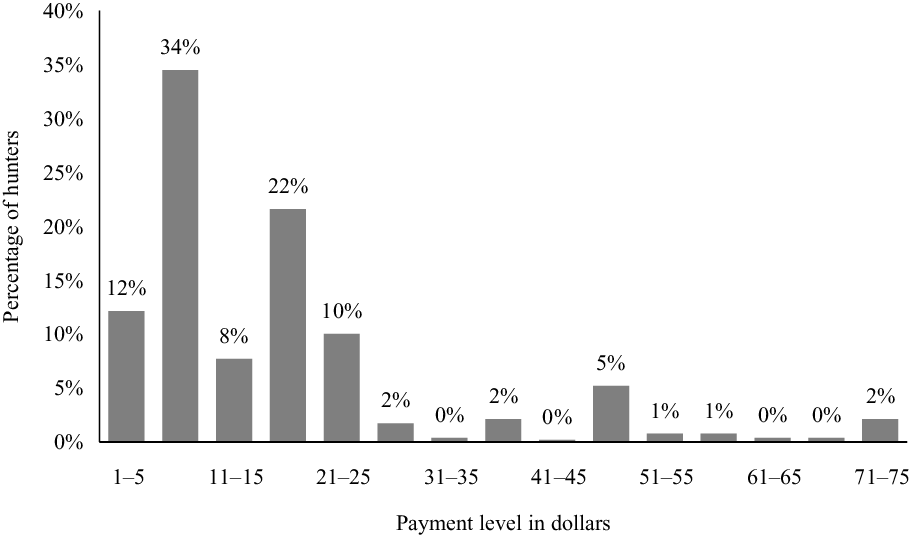
Figure 2. Distribution of hunter willingness to pay amount, which ranged from $1 to $75 to avoid the processing cost burden associated with an infected deer based on a survey of Tennessee hunters conducted in 2019 (n = 519).
3.3 Factors that Influence Participation in the Processing Cost Recovery Scheme
Regression estimates from the sample selection model are presented in Table 3. The total observations used to estimate the selection and outcome regression models were 841 and 404, respectively, because of missing values for different variables of interests that were not imputed. The model fit for the sample selection model was significant at the 1% level. A likelihood ratio test of the independent equations showed that the error terms of the selection and outcome equation were correlated (χ2 = 4.90, P = 0.03), which indicated the presence of selection bias in the least squares results and justified the sample selection model’s use. The error term of the selection equation was correlated negatively with that of the outcome equation. There was no issue of multicollinearity among the independent variables used in the selection (variance inflation factor = 1.25) and outcome equation (variance inflation factor = 1.07). The selection equation was used to quantity factors that affect hunters’ WTP to avoid losing the processing cost associated with CWD-infected deer, while the outcome equation was used to estimate the conditional expected value of hunters’ WTP amount and its determinants.
Table 3. Estimates of Sample Selection Model used to quantify factors that affect hunters’ willingness to pay to avoid losing the deer processing cost because of infection with CWD based on a survey conducted in Tennessee in 2019
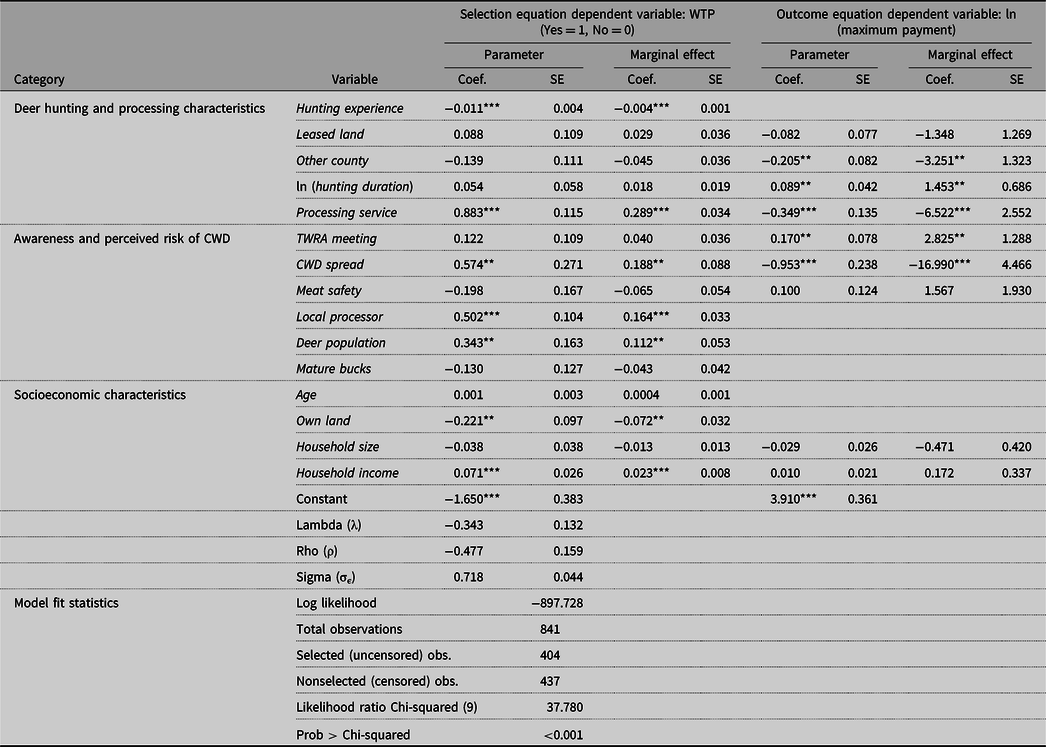
*** P < 0.01, ** P < 0.05.
Among the independent variables examined, the years of hunting experience affected the WTP to avoid the processing cost burden negatively (P < 0.01), while the use of an outside processor for processing services affected hunters’ interest in participating in the scheme positively (P < 0.01). The marginal effects presented for the selection equation (Table 3) suggested that a one-year increase in deer hunting experience in CWD counties led to a 0.4% decrease in the probability of participating in the scheme. Similarly, hunters who used processing services currently were 28.9% more likely to participate than those who processed deer at home or gave the deer away before processing. Other deer hunting characteristics, such as hunting efforts (e.g., hunting duration) and place of hunting (leased land, and other county) had no significant effect on hunters’ decision to participate in the processing cost recovery scheme.
Further, their willingness to participate in the scheme was affected positively by their perception of the risk that CWD will spread throughout Tennessee (P < 0.05), local processors will stop processing deer (P < 0.01), and the deer population will decline (P < 0.05). The marginal effect estimates showed that the probability that hunters would participate in the scheme increased by 18.8 and 16.4% when they were concerned about ‘CWD spreading throughout Tennessee’ and ‘local processors will stop processing deer’, respectively. Similarly, hunters who were concerned about ‘deer population decline’ were 11.2% more likely to participate in the processing cost recovery scheme than those who were not concerned about this CWD-associated risk.
Hunters’ willingness to participate was associated negatively with landownership in CWD counties (P < 0.05) and positively with their household income (P < 0.01). Compared to their counterparts, those who owned land in CWD counties had a 7.2% lower probability of participating in the scheme. However, a change in household income from one category (e.g., <$25,000) to a higher one (e.g., $25,001 - $50,000) was associated with a 2.3% increase in the probability of participating. Hunters’ age and household size did not affect their willingness to participate significantly.
3.4 Factors that Influence the WTP Amount
The outcome equation presented in Table 3 quantified the determinants of the WTP amount for the voucher that could be used to have a second deer processed for free when the first deer was found to be infected with CWD. The WTP amount or risk premium was associated negatively with hunting outside CWD counties in Tennessee (P < 0.05) and using a processing service for harvested deer (P < 0.01). For example, a person who hunted deer outside CWD counties in Tennessee was willing to pay $3.25 less than those who hunted only within these counties. Similarly, the amount they were willing to pay was related positively to the total number of days they spent hunting in CWD counties (P < 0.05).
In addition, the WTP amount was associated positively with a hunter learning about CWD in TWRA public meetings (P < 0.05). If a hunter heard about CWD in a TWRA public meeting, s/he was likely to pay $2.83 more than one who did not. Hunters’ perceived risk related to ‘CWD spreading throughout Tennessee’ was associated negatively with the WTP payment level (P < 0.01). With respect to the marginal effect, the difference between hunters who were concerned about ‘CWD spreading throughout Tennessee’ and those who were not was $16.99 per deer.
4. Discussion
The results of this study indicated that a large majority of deer hunters use local meat processing businesses to process their harvest because of the need for extra services, affordable processing cost, and time constraints. With the CWD risk, it is possible that more hunters in the region may opt to use these businesses to process their deer because of the CDC recommendations to test for CWD and dispose of carcasses properly. Similarly, as the regulations introduced recently restrict the transportation of harvested deer, non-local hunters may use local processors to process their deer more often. Concerns for public health combined with transportation regulations may indicate potential increases in the processing market in the region. Processing deer at local processors may help increase CWD testing and disposing of CWD-positive deer carcasses in landfill sites (Siemer et al., Reference Siemer, Lauber and Stedman2020). During the 2020–2021 hunting season, a total of 15,291 harvested deer was tested for CWD, which was 61% of the total deer harvested in CWD affected counties that hunters reported, as testing harvested deer for CWD is not mandatory for hunters in Tennessee (TWRA, 2021d, 2021c). Thus, the processing cost recovery scheme can help address meat safety concerns and promote meat processors’ businesses as well.
This study found that half of the hunters from Western Tennessee sampled were interested in participating in the processing cost recovery scheme. Thus, a considerable number of hunters indicated that they were unwilling to participate in the scheme, which may be attributable to self-processing practices, the risk of CWD contamination in venison when a deer processing service is used, and an attitude that the wildlife agency should reimburse them for the lost processing cost. The other reason may be uncertainty about the scheme or program characteristics, such as whether or not a voucher purchased would be transferable to another season, year, or even person, and the wildlife agency’s role in implementing such a scheme. The results also indicated that a variety of factors, including the perception of disease risk and information source, hunting behavior, and socioeconomic characteristics, can influence hunters’ decision to participate in a processing cost recovery scheme. Experienced hunters were found to be less interested in such a scheme than novices. The causal explanation for this finding may be that more experienced hunters may have relatively greater confidence in their ability to identify and harvest healthy deer only, which makes them less concerned about the issue. Accordingly, they may be less interested in spending an extra amount for recovery insurance (Needham et al., Reference Needham, Vaske, Donnelly and Manfredo2007). Further, it is possible that experienced hunters may be less concerned about the CWD risk than newcomers to an area. If experienced hunters perceive a greater disease risk in any particular location, they are likely to consider site substitution (Needham et al., Reference Needham, Vaske, Donnelly and Manfredo2007). It is also possible that hunters with more years of hunting experience may also have gained better meat processing skills and may not need outside processors’ services.
Hunters who used local processors to process their deer were more likely to participate in the processing cost recovery scheme, but likely to offer a lower premium to do so. This contrasting result suggests that those who use processors at present are interested in the scheme, but value it less than their counterparts. Nonetheless, our finding that up to 63% of hunters who use outside processors and additional hunters who self-process their deer currently would be interested in participating in the scheme implies that such a scheme could be attractive to a large proportion of local processors’ customers.
Previous studies have documented the effect of CWD risk on hunting and meat consumption behavior, such as reduced participation in hunting (time spent and harvest level) in infected areas, change in hunting location, and reduced venison consumption on the part of the general public (Haus et al., Reference Haus, Eyler, Duda and Bowman2017; Holland et al., Reference Holland, Haus, Eyler, Duda and Bowman2020; Myae and Goddard, Reference Myae and Goddard2020; Vaske et al., Reference Vaske, Miller, Ashbrook and Needham2018). Hunters with a higher perception of CWD risk were found to agree that wildlife agencies should reimburse the relevant costs, such as the license fee, and processing and testing costs, if any, when harvested deer tested positive for CWD (Vaske, Reference Vaske2010). Our study indicated that specific risks associated with CWD were related strongly to hunters’ intention to participate in a processing cost recovery scheme. Greater concerns about CWD risks (e.g., disease spreading, decline in meat processors) that increase hunters’ likelihood to participate in the cost recovery scheme imply that risk-averse hunters support establishing a scheme that helps recover the lost processing cost. Human dimensions studies have found that hunters’ perceptions of CWD risk change over time, but if the public concern over CWD continues to increase as the disease spreads in the region, it is possible that more hunters will be willing to participate in the cost recovery scheme in the future.
Our findings with respect to socioeconomic characteristics have intuitive explanations. Hunters who owned land in CWD counties were less likely to participate in the cost recovery scheme. In contrast to non-landowners, those who have their own property in the CWD counties may have a personal, safe space or facility to process harvested deer. In addition, those who own their own land may hunt on that land and feel more confident about the health of the deer herd on their personal property. In addition, the positive effect of household income on hunters’ decision to participate in the scheme suggests that their decisions are sensitive to income, which is consistent with many studies in insurance demand that have shown income’s positive effect (Bekkerman et al., Reference Bekkerman, Belasco, Smith and McIntosh2019; Santeramo et al., Reference Santeramo, Goodwin, Adinolfi and Capitanio2016). However, the demand for such a scheme appears to be relatively inelastic in income. It should be noted also that income did not affect the WTP amount, in that income is important in hunters’ decision to participate in the cost recovery scheme, but once they decide to do so, income has no effect on the premium they are willing to pay. Although hunting itself is considered an inferior good, the demand for recreational hunting may differ from that of hunting for food (Erickson et al., Reference Erickson, Reeling and Lee2019; Needham et al., Reference Needham, Vaske and Manfredo2006).
Our estimation of WTP has important implications in analyzing the feasibility of, and establishing, a processing cost recovery program in CWD-affected regions. We found that hunters may pay up to $19.65 per deer on average in addition to the regular processing cost to avoid losing the processing fee if the deer tests positive for CWD. Among total hunters who were interested to participate in the scheme, only 45.66% hunters were willing to pay $20 or more per deer to avoid losing the processing fee (Figure 2). During the 2020–2021 hunting season, hunters in the CWD counties in our study area, where the average prevalence rate was 4.22%, reported harvesting 24,941 deer (TWRA, 2021c, 2021d). Assuming a similar deer harvest level, willingness to participate rate (50.5%), and percentage of hunters who pay $20 or more (45.66%), local processors in these counties may be able to generate $113,007 (i.e., 24,941* 50.5% * 45.66%*$19.65) from selling the cost recovery voucher at $19.65 per deer. Assuming a similar CWD prevalence rate (4.22%) and a basic processing cost of $100Footnote 1 per deer, the expected cost for local processors to provide the free processing service (if the first deer tests positive for CWD) may be only $24,269 (i.e., 24,941* 50.5% * 45.66%*4.22% * $100). The actual cost/benefit ratio may vary among processors depending upon their share of the processing market in the region, but it appears that offering such a scheme to the local processors would be profitable because it generates more than four times the revenue than without the scheme scenario. In addition, the risk premium rate of $19.65 per deer is sufficient to cover up to 20% of the CWD prevalence rate in CWD counties. If local processors’ basic deer processing costs are less than $100, then this scheme is more profitable to them. This analysis does not account for the additional cost (e.g., time, labor) that will be incurred in implementing the scheme, but that amount may be minimal and could be absorbed easily by the processors’ existing administration and accounting resources. Thus, this processing cost recovery scheme is a financially viable option and provides an incentive for local processors to collect samples and process deer from CWD-affected areas.
Previous studies have indicated that hunters trust wildlife agencies’ CWD information and management actions in general (Needham and Vaske, Reference Needham and Vaske2008; Vaske et al., Reference Vaske, Miller, Ashbrook and Needham2018; Zimmer et al., Reference Zimmer, Boxall and Adamowicz2012). Although awareness of CWD acquired in TWRA public meetings did not influence hunters’ willingness to participate in a processing cost recovery scheme significantly, it had a positive effect on the level of their payment to avoid the processing cost burden. This finding implies that an outreach program that targets new hunters can encourage them to participate in the scheme and pay a market rate for this additional service from local processors.
A few caveats in this study should be noted. The study was conducted in only 12 CWD counties in Western Tennessee, so the findings may not be applicable in other contexts in which the meat processing market and CWD prevalence rate differ. Assuming that the regional meat processing market was not diverse, hunters were not asked about the basic deer processing fee they are paying. However, these fees may have had significant effects on the level of the WTP they offered. This study used an open-ended question format, which was not incentive-compatible to elicit hunters’ WTP and may have inflated some WTP values. This format was used in part because there was no preceding literature specific to deer processing or an insurance scheme associated with game to guide a bid design in the dichotomous choice questions. In addition, this survey was a comprehensive study to assess hunters’ perceptions and intentions before the first deer season started since the discovery of CWD, and the researchers did not have sufficient time to accommodate a focus group before the hunting season began. Future studies should address these caveats when determining WTP to avoid the cost burden of processing infected animals.
5. Conclusion
Because there is no literature on game processing demand, particularly in areas that are experiencing disease in the game population, this study is the first of its kind to assess hunters’ demand for a scheme to recover the cost of processing a diseased game animal. By focusing on the particular case of CWD in white-tailed deer, our study evaluated factors that influence hunters’ interest in participating in, and willingness to pay for, a scheme to recover the cost of processing infected game. The findings from this study contribute to the literature on the economics of sports hunting and wildlife management and also offer important management implications for sustaining the struggling processing industry and maintaining hunters’ participation in areas that face disease.
First, the results shed light on characterizing the extent of the hunter population that uses outside facilities to process their deer and show the demand for processing services. Many state wildlife agencies that are exploring options to enhance disease surveillance currently will benefit from this information. In particular, it provides information on the proportion of the harvest that could be reached through local processors and evaluates processors’ ability to help collect deer samples for disease testing.
Second, it appears that there is a sizable demand for a scheme to help hunters recover the cost of processing a diseased game animal and hunters are willing to pay a significant premium to avoid the cost burden. Given the average price of processing in the region ($100), the average premium (one-time payment) hunters are willing to pay is as high as 20%. Hence, establishing such a market-based mechanism is feasible for local businesses in the processing industry, as the revenue generated from the premium collected exceeds the expected cost of providing the service greatly. Further, it is possible that this cost may increase with increases in the disease’s prevalence rate, but our results also indicate that the demand for this scheme will increase with increased public concern over the risk of CWD.
Although this study focused on the case of deer hunting in Tennessee, the findings offer valuable insights for hunters around the world where big game hunting faces health issues in game populations. In particular, estimates of WTP may be useful in a “benefit transfer” approach to help promote a market mechanism in many other states around our study area (e.g., Arkansas, Mississippi, Missouri, and Virginia) that are facing CWD currently. Local game processors and hunters can play important roles in containing game disease. Hence, their engagement could be critical, particularly when agencies have no other options to combat the disease other than relying on hunters to reduce herds to slow disease transmission, and processors to collect samples for disease testing. As the loss of processing fees for diseased animals could be a major barrier for hunters to harvest game in affected areas, promoting a user-paid scheme may facilitate a self-sustaining incentive mechanism. The findings from this study should be useful in aiding a preliminary discussion in that direction.
Acknowledgments
The authors are thankful to Abigail Meeks, Roger Applegate, Daniel Grove, and James Kelly for their input and assistance during various stages of the project. Funding for open access to this research was provided by University of Tennessee’s Open Publishing Support Fund.
Data availability statement
Survey data supporting the findings of this study were collected following the privacy and data security protocols for human subjects’ research as approved by the University of Tennessee’s Institutional Review Board (IRB) and is not publicly available.
Financial Support
The authors acknowledge Tennessee Wildlife Resources Agency and USDA NIFA McIntire Stennis Grant (Accession # 1023957) for funding support.
Conflict of Interest
None.


 Open access