


Introduction
Investigations of such structures as crevasses and foliations have been made in conjunction with studies of the stress and velocity fields in valley glaciers. Elongated bubbles are linear structures within glacier ice and their orientations have been used to indicate the flow direction in regions where differential movement is intense (Reference KizakiKizaki, 1969). Only a few studies, however, have provided detailed areal coverage of bubble distribution because air bubbles on a glacier surface are generally not elongated.
Elongated bubbles have been found to be dispersed over wide areas on ice surfaces covered by supraglacial debris (Reference Nakawo [i.e. Nakao]Nakawo, 1976). In the present study, the primary emphasis is on the relationship between the strain and velocity field and the distribution of elongated bubbles. Field work was carried out during the monsoon season of 1974 on G2 Glacier in Hidden Valley, Mukut Himal, Nepal, as part of the glaciological expedition to Nepal supervised by Professor K. Higuchi of Nagoya University (Reference HiguchiHiguchi, 1976). Laboratory experiments were carried out subsequently at the Institute of Low Temperature Science, Hokkaido University (Reference Nakawo [i.e. Nakao]Nakawo, 1977), to evaluate the field data collected.
Distribution of Elongated Bubbles
G2 Glacier (Fig. 1) is located on the northern side of the Dhaulagiri Himal, the main range of the Great Himalayas. It is 4 km long, 0.5 km wide, and its apparent terminus is 5043 m in elevation. An ice fall separates the ablation area of the glacier from its accumulation basin.

Fig. 1. G2 Glacier, and Tukche Peak (6915 m).
The ablation area is mostly covered by supraglacial debris, and the boundary between the debris-covered area and the debris-free area is near the ice fall. Reference Nakawo [i.e. Nakao]Nakawo (1977) estimated that the active terminus was located about one kilometre up-stream from the apparent terminus (near the 5220 m contour line), i.e. the ice body between the two termini may be stagnant (Fig. 2).

Fig. 2. Distribution of air bubbles. Thick segments of lines indicate elongated bubbles; downward side is shown with arrow. Solid circles represent spherical bubbles.
Bubbles were spherical in shape in the surface ice of the debris-free and stagnant areas (solid circles in Fig. 2), but throughout the active areas covered by debris they were spheroidal. Their lengths ranged from 4–10 mm and the cross-section normal to the elongated direction was a circle of diameter 0.4–0.7 mm. Bubble orientations were always parallel in any one area, but the orientation varied from one location to another. The distribution in strike of the bubbles is shown by the thick segments of lines in Figure 2; the arrows indicate the downward-plunge side. The thin, segmented lines indicate the strike of the bubbles as determined from the orientation of the thick segmented lines.
Most of the elongated bubbles were inclined up-glacier. Along a medial strip their plunge decreased progressively down-glacier from about 80° near the 5300 m contour line to about 10° near the 5220 m contour line. Their strike, on the other hand, showed a slight deviation from the direction of flow: in the south-western part of the glacier it appeared to point toward the medial line down-glacier. Both the plunge and strike features will be explained in terms of induced strains in the ice.
Laboratory Experiments on Rotation of Elongated Bubbles
In order to interpret the distribution of elongated bubbles in G2 Glacier, ice specimens containing elongated bubbles were subjected to simple shear. Three kinds of ice samples were used: One was a single crystal taken from lake ice (Reference OnoOno, 1976) in which the bubbles were elongated normal to the basal plane of the crystal. The second, a polycrystalline ice sample, was taken from Heitō Glacier, East Antarctica (Reference Nakawo [i.e. Nakao], Tanaka and KuroiwaNakawo and Tanaka, 1974). A preferred c-axis distribution was observed for this glacier ice; the fabric maximum was orthogonal to the direction of elongation of the bubbles. The third sample, from McCall Glacier, Alaska (Reference Nakawo [i.e. Nakao], Wakahama and KuroiwaNakawo and Wakahama, 1974) had a random c-axis distribution.
Figure 3 shows the simple shear apparatus. An ice specimen (4–5 cm long, 1–3 cm wide, and 0.4–0.5 cm thick) was frozen to special holders in such a way that the direction of elongation of the bubbles was normal to the shear plane, the holders could move in the direction of the arrows. A constant load was applied at a temperature of about –1°C. As the ice specimen was deformed, the elongated bubbles gradually changed their orientation (Fig. 4), and this change and the induced strain in the ice were measured separately.

Fig. 3. A schematic diagram of the experimental apparatus.

Fig. 4. Elongated bubbles contained in an ice specimen: A, before, and B, after deformation
If an elongated bubble is assumed to deform passively within the ice, as shown schematically in Figure 5, the rotation angle α can be easily estimated from the shear strain of the ice tan ø by the following equations

Fig. 5. Simple-shear deformation. Solid lines and broken lines indicate a specimen before and after deformation, respectively.
and
where θ 0 and, θ are the orientations of the elongated bubble before and after deformation, respectively. This passive deformation, at least in orientation, will be termed geometrical deformation in this paper.
The estimated rotation angle from strain is compared with the measured rotation angle in Figure 6. It may be seen that there is good agreement between the estimations and the measurements. These results are quite acceptable for a single crystal because geometrical deformation proceeds by sliding on the basal planes, and these planes coincided in orientation with the experimental shear plane. When the glacier-ice specimens were tested, recrystalliza-tion took place during the experiment (Reference Nakawo [i.e. Nakao]Nakawo, 1977), but, even so, the observed rotation of the bubbles due to strain was still in good agreement with calculated values. Thus, the experiments showed that, during straining, elongated bubbles in glacier ice undergo a geometric deformation which may be calculated. It should be possible, therefore, to determine the strain induced in a glacier within a given distance by measuring the change in orientation of the elongated bubbles.

Fig. 6. Comparison of estimated and measured rotation angle.
Changes in Plunge of Elongated Bubble Caused by Flow
Bubbles which are elongated almost vertically are developed at the base of an ice fall by strong longitudinal compression (Reference Nakawo [i.e. Nakao]Nakawo, 1977). Any decrease in plunge down-glacier along the medial strip must be attributable to simple shear along planes parallel to the bed. The total strain η which exposed ice has experienced in travelling from the ice fall to its present position is easily estimated from the plunge of the elongated bubbles contained in it by using Equation (2). Results, shown as solid circles in Figure 7, were collected along a longitudinal line connecting elongated bubbles whose strike was parallel to the glacier margins. This direction is assumed to be a flow line and is taken to be x-axis positive down-glacier in the surface.

Fig. 7. Total strain along a flow line. Solid circles are estimated from changes in plunge of the bubbles
As the shear strain across planes parallel to the bed was unfortunately not measured in G2 Glacier, the flow law of Reference NyeNye (1957) was used to compare the strain estimated from the elongated bubbles:
where ![]() is shear strain-rate, τ is shear stress, and A and n are constants. The value of τ is given by
is shear strain-rate, τ is shear stress, and A and n are constants. The value of τ is given by
where F is a shape factor, taken to be I (Reference Nakawo [i.e. Nakao]Nakawo, 1977), ρ is density of ice, g is gravitational acceleration, y is depth perpendicular to the surface, and β is surface slope, which has a constant value of about 7°.
The depth y(x) of an ice layer which comes to the surface at some particular location can be obtained by assuming steady flow and plane strain and by using the continuity equation (Reference Allen, Allen, Kamb, Meier and SharpAllen and others, 1960)

where v is the surface velocity down-glacier and a is the ablation-rate. Velocity v is estimated as shown in the next section and a is assumed to have a constant value of 0.7 m/year estimated from the observed values near G2 Glacier (Reference Fujii, Fujii, Nakawo [i.e. Nakao] and ShresthaFujii and others, 1976; Reference FujiiFujii, 1977). For the depths of interest here, the second term on the right-hand side of Equation (5) can be neglected.
Using the values of A and n obtained on Blue Glacier (Reference Shreve and SharpShreve and Sharp, 1970), Equations (3), (4), and (5) also give the total shear strain η that the ice has experienced in travelling from the ice fall to its present position. The results are shown by the solid line in Figure 7. The agreement of this line with the solid circles estimated from the change in plunge of the elongated bubbles indicates that the correct magnitude of total strain can easily be obtained by measuring the plunge of elongated bubbles.
Strain and Velocity Field on the Surface of G2 Glacier
Changes in the strike of elongated bubbles are also related to the strain field at the glacier surface. The buttress-shaped rock ridges extending underneath the glacier (Fig. 1) might cause the strain to be complex at the eastern side of the glacier, while it is possible that the surface strain at the western side if the result only of friction at the margin, judging from the external features of the glacier. The variation in strike at the western side can be explained, therefore, in terms of the shear strain across vertical planes parallel to the flow line. The amount of induced shear strain in the ice while it travels a distance ∆x is [∂γ /∂x) ∆x, where

in which δ is the angle between the flow line and the strike of an elongated bubble.
The z-axis is assumed to be positive westward; this is approximately normal to the x- and y-axes. The z ordinate is normalized so as to be±1 at the margin (z' ordinate). As the morphology of the glacier is simple, the flow line can be assumed to coincide with a line having a constant value of z'; the x-axis is coincident with the line on which the z' value is equal to 0.
The distribution of ∂γ/∂x, obtained in the area where change in strike of the bubbles is attributed only to marginal friction by the use of Equation (2), is shown in Figure 8. The values of ∂γ /∂x are largest near the margin where the induced shear strain is intensive. A peak near the centre shifts towards the margin as the distance down-glacier increases. This peak is explained by the difference in slope between the western and eastern sides; the surface gradient is small in the western area after the abrupt decrease in slope at the base of the ice fall, but it has a comparatively larger value in the eastern area because of the absence of an ice fall. The surface inclination difference becomes small down-glacier so that the glacier tends to flow as a single stream of ice. Extraordinarily large values of ∂γ/∂x arc found in the lower area. It seems probable that this is due to the influence of the bedrock since it is near the active terminus (Reference Nakawo [i.e. Nakao]Nakawo, 1977).

Fig. 8. Distribution of “strain gradient”".
The basic equation of fluid dynamics is introduced for γ

where D/Dt is Lagrangian derivative and t is time. It should be noted that the rotation of the bubbles is due only to marginal friction in the area now under consideration. Hence, the equation

holds because the z-axis remains approximately orthogonal to the flow direction down the glacier.
Assuming that the glacier is in a steady state of flow, Equations (7) and (8) yield
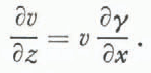
Equation (9) can easily be integrated as

where v0 is a constant of integration. As the value of ∂γ/∂x is known at every point, as shown in Figure 7, v can be estimated if v0 is given.
Measured flow velocities (Reference Nakawo [i.e. Nakao], Nakawo [i.e. Nakao], Fujii and ShresthaNakawo and others, 1976) are shown with hollow arrows in Figure 9. Substituting the measured value at I3 into v₀ in Equation (10), flow velocities along a line at x = 0 are estimated. Similarly, velocities on a line at x ═ 100 m are obtained by the use of the measured value at I1. The results are shown with black arrows in Figure 9, from which the velocity at position I2 is, by interpolation, 32 cm/month; this agrees well with the observed value of 38 cm/month.

Fig. 9. Distribution of flow velocity. Hollow and solid arrows are measured and estimated velocities, respectively.
Velocities could not be obtained at positions other than on lines at x = 0 and x = 100 m because no boundary condition (integration constant) was available. Values for the velocity are estimated, therefore, by assuming that the velocity along the x-axis (z' = 0) decreases exponentially down-glacier. The results are shown with solid arrows, also in Figure 9.
This assumption of exponential decrease involves a longitudinal compression which was neglected when the values ∂γ/∂x of were estimated. No experimental investigations into the reorientation of elongated bubbles subjected to longitudinal compression were performed, but it is possible that the elongated bubbles are also deformed geometrically when compressive stresses are applied. Taking the longitudinal strain into account, the strain gradient would have slightly smaller values in most areas, making the estimated flow velocity closer to that measured at I2. The longitudinal-strain effect is more substantial near the terminus where the reorientation of the bubbles cannot be attributed to shear strain alone.
Bubble Foliation
Air bubbles in the ice surface of G2 Glacier tended to occur in planes as a kind of foliation structure (Reference Nakawo [i.e. Nakao], Nakawo [i.e. Nakao], Fujii and ShresthaNakawo, 1976). Figure 10 shows a histogram of the angle between the direction of the bubble elongation and that of the foliation at various positions on the surface. The elongated bubbles lie in the plane of the foliation throughout, except for several areas where they intersect at an angle of about 55°.

Fig. 10. Relation between the orientation of lineation and foliation.
Elongated bubbles are deformed geometrically during flow, as shown above. The foliation plane containing the bubbles must therefore deform in the same manner, but no experiment was carried out to confirm this behaviour, instead, the change in strike of the foliation was investigated, assuming that the strike did not depend on its depth.
A line denoting zero time was drawn on the map shown in Figure 11 consistent with observed data, shown by symbols for strike and dip. Past and future configurations of the line were estimated using the velocities obtained in the previous section, these configurations are labelled with the value of the year they represent, e.g. the lines with +20 and —30 correspond to lines of 20 years after and 30 years before. These lines give a reasonable explanation of the observed distribution of foliation. The bubble foliation is interpreted, therefore, as not having formed at the place where it is observed but rather at a position up-glacier, and subsequently to have deformed progressively during flow. This idea agrees with the suggestions of Reference Allen, Allen, Kamb, Meier and SharpAllen and others (1960).

Fig. 11. Bubble foliation and its change in configuration.
The unusual relationship of a roughly 55° angle between foliation and lineation orientations was found only in the dotted area in Figure 2, suggesting that the hypothesis cannot be applied to this area—the area where the active terminus is located (Reference Nakawo [i.e. Nakao]Nakawo, 1977). It may be concluded that the bubble foliation, once formed, behaves passively, and is deformed geometrically during flow unless an additional stress is applied, as occurs in the terminal and marginal areas.
Because bubble foliation is also a good indicator of ice strain, the strain and the velocity field may be calculated from its distribution in the same way as from the distribution of elongated bubbles, but measurements of the orientation of such a planar feature as foliation would be less accurate than those for the linear structure.
Concluding Remarks
The orientation of elongated bubbles found on G2 Glacier does not indicate flow direction but corresponds to induced strain in the ice. A reasonable estimate of the strain and velocity field at the glacier surface has been made by studying the deformation and distribution of the bubbles, assuming simple shear and steady flow. This method could be extended by analysing core samples in order to estimate the interior velocity field.
The method, however, should be adjusted when applied to a glacier in which the state of stress is more complex, since the assumption of simple shear does not hold. Neither is the assumption of steady flow applicable when there are large deviations from steady-state conditions, or when the deviations themselves are under study. Most glaciers are not, in a strict sense, in a steady state. It is recommended, therefore, that a series of observations of the distribution of elongated bubbles be combined with direct measurements of strain-rate and velocity field. Further development of the method, in which structural elements are taken to be indicators of glacier flow, will make it possible to estimate past flow conditions.
Acknowledgements
The author would like to express his sincere gratitude to Professor G. Wakahama for many valuable suggestions and encouragement, and to Dr Y. Suzuki for helpful discussions and comments. Thanks are extended to the members of the glaciological expedition to Nepal, 1974; to H.M. Government of Nepal, and to the many Himalayan people who helped the author and enabled him to carry out the investigations. He is also indebted to Professor A. Higashi for making the experimental apparatus available, and to Dr N. Ono for providing some precious ice samples.


