


Introduction
Phases of aeolian deposition and soil formation during the Late Weichselian have been associated with climate and climate change (Van der Hammen & Wijmstra, Reference Van der Hammen and Wijmstra1971). Cold conditions and sand deposition occurred during the Late Pleniglacial, Older Dryas and Younger Dryas periods, while warmer conditions during the Bølling, Allerød and Holocene resulted in soil formation. However, a strict correlation between climate change and aeolian activity has been questioned, as aeolian deposition seems to continue over the Late Pleniglacial to Late Glacial boundary (Kasse, Reference Kasse1997, Reference Kasse2002; Vandenberghe et al., Reference Vandenberghe, Derese, Kasse and Van den haute2013). The classic aeolian record of the Late Weichselian in the Netherlands (Older Coversand I, Beuningen Gravel Bed, Older Coversand II, Lower Loamy Bed, Younger Coversand I, Usselo Soil, Younger Coversand II) (Van der Hammen Reference Van der Hammen1951, Reference Van der Hammen, Van der Hammen and Wijmstra1971; Vandenberghe et al., Reference Vandenberghe, Derese, Kasse and Van den haute2013 and references therein) has been recognised in large parts of northwest, central and southwestern Europe (e.g. Kolstrup, Reference Kolstrup1980; Kolstrup et al., Reference Kolstrup, Grün, Mejdahl, Packman and Wintle1990; Kozarski & Nowaczyk, Reference Kozarski and Nowaczyk1991; Bateman, Reference Bateman1995; Janotta et al., Reference Janotta, Radtke, Czwielung and Heidger1997; Koster, Reference Koster2005; Kasse et al., Reference Kasse, Vandenberghe, De Corte and Van den haute2007, Reference Kasse, Tebbens, Tump, Deeben, Derese, De Grave and Vandenberghe2018; Derese, Reference Derese2011; Costas et al., Reference Costas, Jerez, Trigo, Goble and Rebêlo2012; Sitzia et al., Reference Sitzia, Bertran, Bahain, Bateman, Hernandez, Garon, de Lafontaine, Mercier, Leroyer, Queffelec and Voinchet2015, Reference Sitzia, Bertran, Sima, Chery, Queffelec and Rousseau2017).
Widespread aeolian activity probably stopped or sharply decreased during the onset of the Holocene because of the rapid expansion of a protective vegetation cover (Hoek, Reference Hoek1997, Reference Hoek2001; Vandenberghe et al., Reference Vandenberghe, Derese, Kasse and Van den haute2013; Kasse et al., Reference Kasse, Tebbens, Tump, Deeben, Derese, De Grave and Vandenberghe2018). In the Early Holocene, Mesolithic hunter-gatherer activity, intentional forest fires and habitation resulted in early heathland development, soil acidification, podzolisation and local drift-sand formation (Van Geel et al., Reference Van Geel, Brinkkemper, Weeda and Sevink2017; Sevink et al., Reference Sevink, Van Geel, Jansen and Wallinga2018).
Middle Holocene drift-sand phases (c.9–3 ka cal. BP) were reported, although not frequently, from the Netherlands and Germany (Van Mourik et al., Reference Van Mourik, Wartenbergh, Mook and Streurman1995, Reference Van Mourik, Nierop and Vandenberghe2010, Reference Van Mourik, Seijmonsbergen, Slotboom and Wallinga2012; Tolksdorf & Kaiser, Reference Tolksdorf and Kaiser2012; Sevink et al., Reference Sevink, Koster, Van Geel and Wallinga2013, Reference Sevink, Van Geel, Jansen and Wallinga2018; Koster, Reference Koster2017). The cause for these earlier drift-sand phases, whether climate or man, is still debated (Clemmensen et al., Reference Clemmensen, Murray, Bech and Clausen2001; Tolksdorf & Kaiser, Reference Tolksdorf and Kaiser2012; Sevink et al, Reference Sevink, Koster, Van Geel and Wallinga2013, Reference Sevink, Van Geel, Jansen and Wallinga2018; Koster, Reference Koster2017; Pierik et al., Reference Pierik, Van Lanen, Gouw-Bouman, Groenewoudt, Wallinga and Hoek2018). The Holocene is regarded as a climatically fairly stable period; however, climatic oscillations (e.g. 8.2 ka, 2.8 ka) are reported (Van Geel et al., Reference Van Geel, Buurman and Waterbolk1996; Davis et al., Reference Davis, Brewer, Stevenson and Guiot2003; Blaauw et al., Reference Blaauw, Van Geel and Van der Plicht2004; Wiersma & Renssen, Reference Wiersma and Renssen2006; Hoek & Bos, Reference Hoek and Bos2007). Whether these oscillations and related changes in vegetation were strong enough to cause landscape degradation to initiate drift-sand formation is questionable (Pierik et al., Reference Pierik, Van Lanen, Gouw-Bouman, Groenewoudt, Wallinga and Hoek2018). On the other hand, the impact of man on the landscape during the Holocene increased, especially from the Neolithic period onwards when the start of agriculture resulted in local deforestation and expansion of heathlands (Janssen, Reference Janssen1972; Van Geel et al., Reference Van Geel, Brinkkemper, Weeda and Sevink2017). In the loess region of Limburg the start of the Neolithic occurred at c.7300 cal. BP, while in the coversand regions of the southern Netherlands it occurred later (Verhart & Arts, Reference Verhart, Arts, Deeben, Drenth, Van Oorsouw and Verhart2005: 244–5). Neolithic occupation in the Maas valley in the southeastern Netherlands was reported from c.6400 cal. BP (4365 BC; Bos & Zuidhoff, Reference Bos and Zuidhoff2015). During the Bronze Age, Iron Age and Roman period, population density increased, deforestation and agriculture further increased and the expansion of heather fields is reported (Groenewoudt et al., Reference Groenewoudt, Van Haaster, Van Beek and Brinkkemper2007; Bos & Zuidhoff, Reference Bos and Zuidhoff2015; Van Beek et al., Reference Van Beek, Gouw-Bouman and Bos2015). Following the Roman period, population decreased and reforestation occurred, especially in the southern Netherlands (Roymans & Gerritsen, Reference Roymans and Gerritsen2002).
From the Middle Ages onwards, after AD 950–1150, aeolian activity resumed and culminated in extensive aeolian drift-sand areas at the end of the 18th century (Koster, Reference Koster1978, Reference Koster2009, Reference Koster, Fanta and Siepel2010, Reference Koster2017; Castel et al., Reference Castel, Koster and Slotboom1989; Koster et al., Reference Koster, Castel, Nap and Pye1993; Van Mourik et al., Reference Van Mourik, Wartenbergh, Mook and Streurman1995, Reference Van Mourik, Nierop and Vandenberghe2010; Janotta et al., Reference Janotta, Radtke, Czwielung and Heidger1997; Derese et al., Reference Derese, Vandenberghe, Eggermont, Bastiaens, Annaert and Van den haute2010a; Jungerius & Riksen, Reference Jungerius and Riksen2010; Pierik et al., Reference Pierik, Van Lanen, Gouw-Bouman, Groenewoudt, Wallinga and Hoek2018). Although a climatic cause for drift-sand formation, due to drier conditions during the ‘climatic optimum’ of the Middle Ages or because of increased storminess during the Little Ice Age (Cunningham et al., Reference Cunningham, Bakker, Van Heteren, Van der Valk, Van der Spek, Schaart and Wallinga2011), has been suggested (e.g. Heidinga, Reference Heidinga1984, Reference Heidinga, Fanta and Siepel2010; Jungerius & Riksen, Reference Jungerius and Riksen2010), this drift-sand phase is generally ascribed to an increase of population density and pressure on the landscape (De Keyzer Reference De Keyzer2016; De Keyzer and Bateman Reference De Keyzer and Bateman2018; Pierik et al., Reference Pierik, Van Lanen, Gouw-Bouman, Groenewoudt, Wallinga and Hoek2018). Deforestation and expansion of agriculture, grazing and burning practices, formation of roads and cattle/sheep drifts, and the use of plaggen as fertiliser led to the remobilisation of the Late Weichselian aeolian sands (Koster, Reference Koster2009, Reference Koster, Fanta and Siepel2010; Pierik et al., Reference Pierik, Van Lanen, Gouw-Bouman, Groenewoudt, Wallinga and Hoek2018). This classic view on drift-sand formation was recently modified by De Keyzer (Reference De Keyzer2016) and De Keyzer and Bateman (Reference De Keyzer and Bateman2018), who stress the importance of socio-economic causes and the distribution of power of stakeholders in the use of the commons and measures to cope with drift-sand development.
The time control of coversand and drift-sand units was previously based on pollen analysis (biostratigraphy) and radiocarbon dates of intercalated Late Glacial and Holocene soils and peat (Van der Hammen Reference Van der Hammen1951, Reference Van der Hammen, Van der Hammen and Wijmstra1971; Van der Hammen et al., Reference Van der Hammen, Maarleveld, Vogel and Zagwijn1967; Zagwijn, Reference Zagwijn1974; Castel et al., Reference Castel, Koster and Slotboom1989; Van Geel et al., Reference Van Geel, Coope and Van der Hammen1989; Van Mourik et al., Reference Van Mourik, Wartenbergh, Mook and Streurman1995; Hoek, Reference Hoek1997). In this way, aeolian sand deposits were dated indirectly by dating of soils, assuming a minimal hiatus between the end of organic accumulation in the soil and the onset of sand deposition. However, radiocarbon dating of soils, to date the end or onset of underlying or overlying aeolian sand units, has given unsatisfactory results (Van Mourik et al., Reference Van Mourik, Wartenbergh, Mook and Streurman1995, Reference Van Mourik, Nierop and Vandenberghe2010, Reference Van Mourik, Slotboom and Wallinga2011; Koster, Reference Koster2009; Wallinga et al., Reference Wallinga, Van Mourik and Schilder2013; Pierik et al., Reference Pierik, Van Lanen, Gouw-Bouman, Groenewoudt, Wallinga and Hoek2018). Soil organic material is the cumulative product of the soil formation period, and the obtained ages are different in relation to the organic fraction used (Van Mourik et al., Reference Van Mourik, Wartenbergh, Mook and Streurman1995). Therefore, radiocarbon dating of a buried soil does not necessarily represent the start of sand deposition and can yield too old ages for the overlying drift-sand activity. In the type locality of the Lutterzand area, the top of the Holocene podzol was radiocarbon-dated at 1550 ± 43 BP while deposition of the overlying drift sands started at 350 ± 30 years ago based on optically stimulated luminescence (OSL) dating, implying a hiatus of c.1200 years (Vandenberghe et al., Reference Vandenberghe, Derese, Kasse and Van den haute2013). Furthermore, shorter and longer hiatuses may be present at the base, the top or within the sand units, since it is difficult to estimate the duration of sedimentary boundaries or erosional contacts. It has been stated that the so-called Younger Coversand II coincides with the Younger Dryas period (Van der Hammen, Reference Van der Hammen1951; Vandenberghe, Reference Vandenberghe1991; Isarin et al., Reference Isarin, Renssen and Koster1997) as it overlies the Usselo Soil of Allerød age (Hoek, Reference Hoek1997: 43) and is covered by the Holocene podzol soil. However, time lags or delayed responses to climate change may be present at the base and top of Younger Dryas aeolian deposits, related to a gradual vegetational cover decline at the Allerød – Younger Dryas transition or vegetation increase at the Younger Dryas to Holocene boundary.
Direct dating of the sand units by OSL circumvents the problem of indirect dating based on radiocarbon dates of soils. Luminescence dating enables direct dating of aeolian sediments and phases of landscape instability. OSL dating of quartz has provided reliable ages for Late Weichselian and Holocene aeolian sediments in the northwest European lowlands (Stokes, Reference Stokes1991; Bateman, Reference Bateman1995, Reference Bateman1998; Janotta et al., Reference Janotta, Radtke, Czwielung and Heidger1997; Radtke & Janotta, Reference Radtke and Janotta1998; Bateman and Van Huissteden Reference Bateman and Van Huissteden1999; Bateman et al., Reference Bateman, Murton and Crowe2000; Vandenberghe et al., Reference Vandenberghe, Kasse, Hossain, De Corte, Van den haute, Fuchs and Murray2004, Reference Vandenberghe, Vanneste, Verbeeck, Paulissen, Buylaert, De Corte and Van den haute2009, Reference Vandenberghe, Derese, Kasse and Van den haute2013; Kasse et al., Reference Kasse, Vandenberghe, De Corte and Van den haute2007, Reference Kasse, Tebbens, Tump, Deeben, Derese, De Grave and Vandenberghe2018; Wallinga et al., Reference Wallinga, Davids and Dijkmans2007; Buylaert et al., Reference Buylaert, Ghysels, Murray, Thomsen, Vandenberghe, De Corte, Heyse and Van den haute2009; Derese et al., Reference Derese, Vandenberghe, Paulissen and Van den haute2009, Reference Derese, Vandenberghe, Eggermont, Bastiaens, Annaert and Van den haute2010a, Reference Derese, Vandenberghe, Zwertvaegher, Court-Picon, Crombé, Verniers and Van den haute2010b, Reference Derese, Vandenberghe, Van Gils, Mees, Paulissen and Van den haute2012; Van Mourik et al., Reference Van Mourik, Nierop and Vandenberghe2010; Bogemans & Vandenberghe, Reference Bogemans and Vandenberghe2011; Sevink et al., Reference Sevink, Koster, Van Geel and Wallinga2013, Reference Sevink, Van Geel, Jansen and Wallinga2018; Beerten et al., Reference Beerten, Vandersmissen, Deforce and Vandenberghe2014).
Although aeolian deposits have been investigated frequently in the Netherlands, they often represent only a few phases. Stacked aeolian and soil sequences covering most of the Late Weichselian and Holocene periods, in which both luminescence and radiocarbon dating techniques have been applied (e.g. by Vandenberghe et al., Reference Vandenberghe, Kasse, Hossain, De Corte, Van den haute, Fuchs and Murray2004, Reference Vandenberghe, Derese, Kasse and Van den haute2013; Van Mourik et al., Reference Van Mourik, Nierop and Vandenberghe2010; Wallinga et al., Reference Wallinga, Van Mourik and Schilder2013), are still rare in the Netherlands and in western Noord Brabant. Multi-proxy studies of aeolian sand deposits in the Netherlands, in which lithological and palynological dating are integrated (e.g. by Sevink et al., Reference Sevink, Koster, Van Geel and Wallinga2013, Reference Sevink, Van Geel, Jansen and Wallinga2018), are even more scarce up to date.
Exposure Boudewijn near Ossendrecht in the southern Netherlands represents a long record of Late Weichselian and Holocene aeolian activity and soil formation. Therefore this paper aims: (i) to reconstruct the sedimentary environments and their changes over time based on the geometry, sedimentary structures and grain size of the aeolian units; (ii) to explore the suitability of radiocarbon dating of soils by combination with the previously established OSL dating results (Fink, Reference Fink2000; Vandenberghe et al., Reference Vandenberghe, Kasse, Hossain, De Corte, Van den haute, Fuchs and Murray2004) and to establish a reliable chronological framework of phases of aeolian activity and landscape instability; (iii) to reconstruct vegetation changes during the landscape stability phases by pollen analysis of intercalated soils; and (iv) to explore the role of climate and man in vegetation and landscape development and possible leads or lags to external forcings.
Geological and geomorphological setting
The investigated Boudewijn sand pit is located in the southwestern Netherlands, province Noord Brabant, east of the village of Ossendrecht (Fig. 1A). This region is situated on the uplifting Campine block that is separated from the Roer Valley Graben by the Feldbiss Fault zone and its northwestern continuation into the Gilze–Rijen fault zone (Van Balen et al., Reference Van Balen, Houtgast, Van der Wateren, Vandenberghe and Bogaart2000, Reference Van Balen, Houtgast and Cloetingh2005).
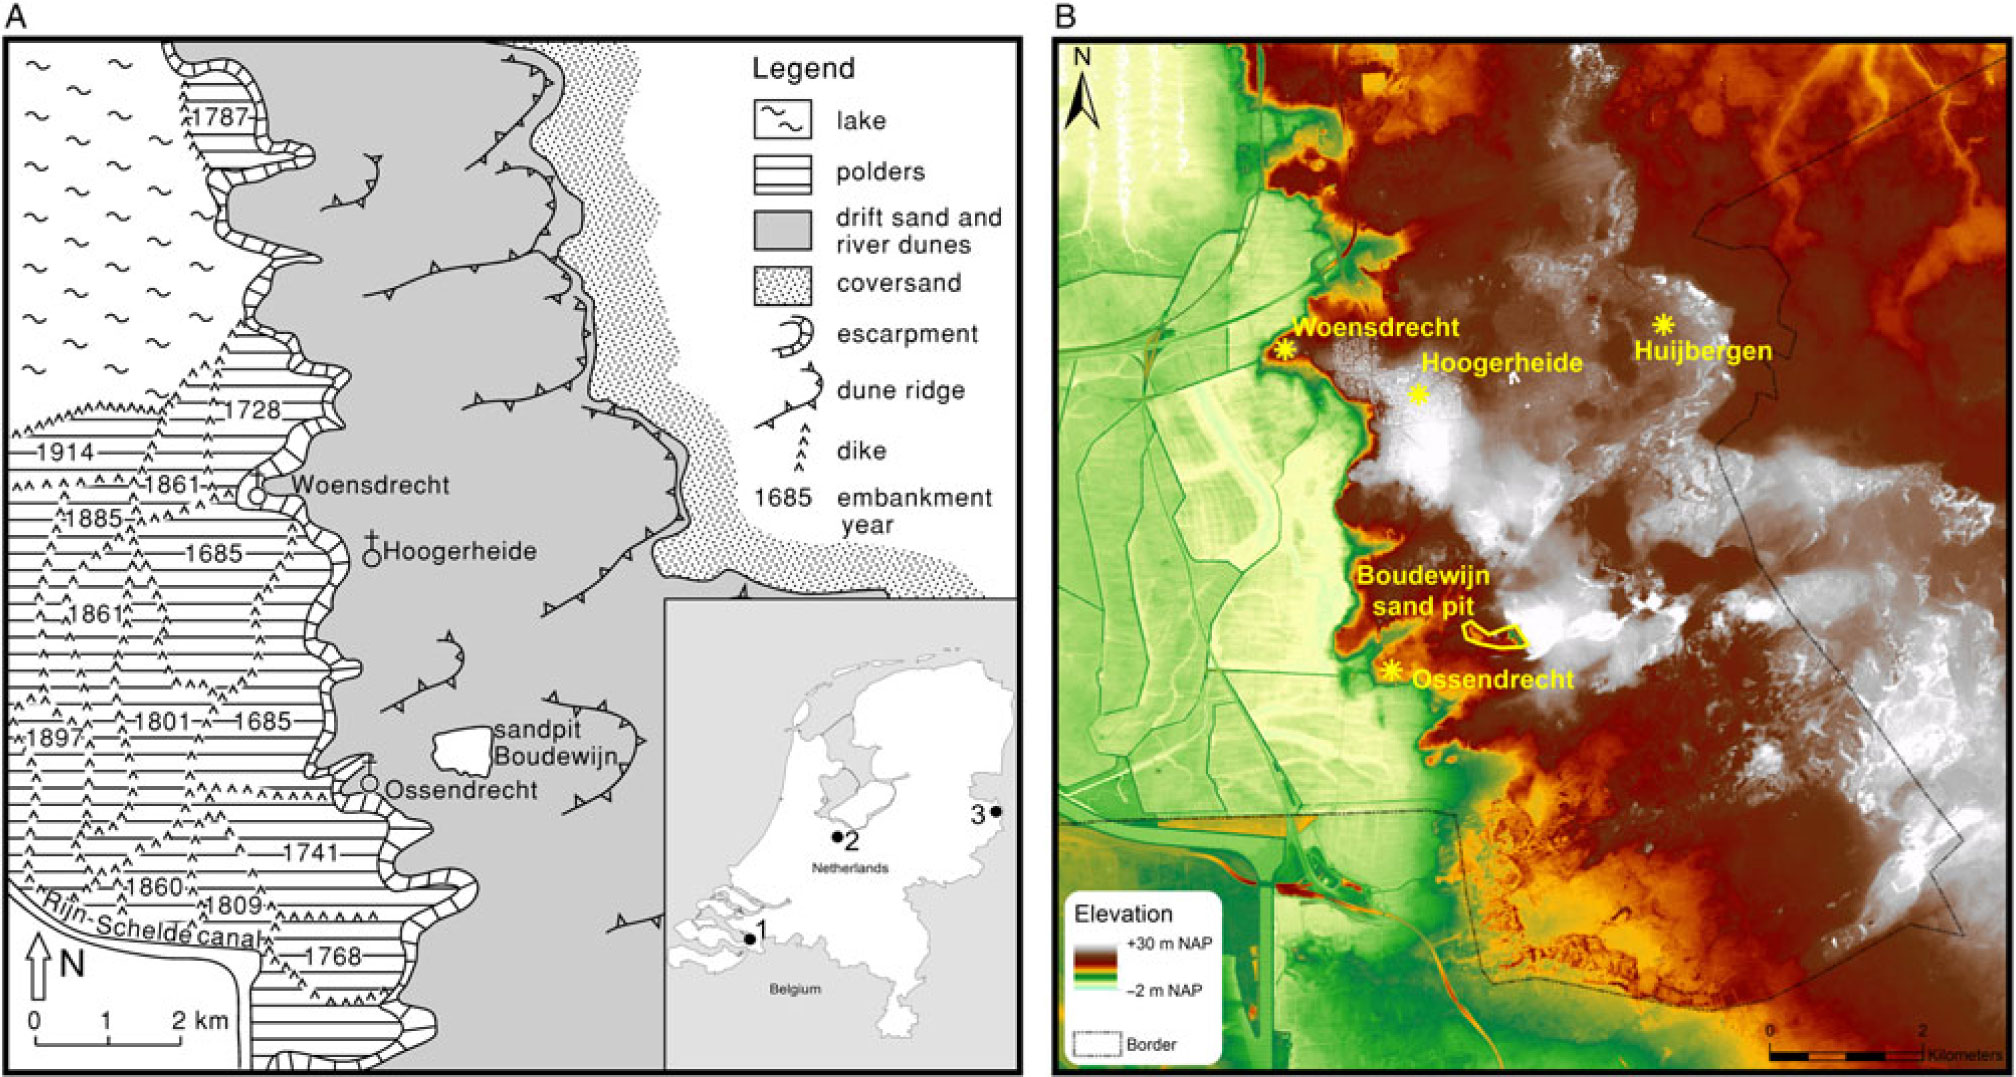
Fig. 1. (A) Location map and geomorphological setting of the investigated exposure Boudewijn near Ossendrecht in western Noord Brabant. Inset map of the Netherlands: 1. Ossendrecht, 2. Laarder Wasmeren (Sevink et al., Reference Sevink, Koster, Van Geel and Wallinga2013, Reference Sevink, Van Geel, Jansen and Wallinga2018), 3. Lutterzand (Vandenberghe et al., Reference Vandenberghe, Derese, Kasse and Van den haute2013). (B) Digital elevation model of the study area showing the aeolian parabolic dune morphology east of Boudewijn and the escarpment towards the polder area in the west.
Western Noord Brabant is characterised by two regions with strongly contrasting geomorphology separated by a sharp transition (Fig. 1B). The eastern part is c.15–25 m above sea level and characterised by Late Pleistocene and Holocene dunes covered with pine forest (Brabantse Wal). The western part is around sea level and is characterised by polders with Late Holocene tidal flat and marsh deposits that have been reclaimed during the last centuries. The transition between the two landscapes is an almost 30 km long north–south-oriented escarpment between Antwerp in Belgium and Bergen op Zoom in the Netherlands. The scarp has been formed by Middle and Late Pleistocene fluvial erosion by the Scheldt river. In addition, concentrated ground-water seepage and associated transport of sand at the foot of the escarpment promoted erosion of the escarpment (Kasse, Reference Kasse1988; Westerhoff & Dobma, Reference Westerhoff and Dobma1995). Faults, as a possible explanation of the scarp, have not been reported from the area, since subsurface Neogene units (e.g. the Oligocene Boom Clay) do not show an offset below the scarp (Zagwijn and Van Staalduinen Reference Zagwijn and Van Staalduinen1975, geologisch overzichtsprofiel CC′).
The Quaternary geology of western Noord Brabant and northern Belgium is characterised by Early Pleistocene tidal estuarine sediments (Fig. 2: unit 1) that are overlain by Late Pleistocene and Holocene mostly aeolian deposits (Fig. 2: units 2–5). The Early Pleistocene deposits dip in a northerly direction towards the subsiding North Sea basin (Kasse, Reference Kasse1988, Reference Kasse1990, Reference Kasse1993). They belong to the Waalre Formation of late Tiglian age (c.1.7–2.0 million years) (Westerhoff et al., Reference Westerhoff, Kemna and Boenigk2008). The sediments were deposited at the southern margin of the North Sea basin in the confluence area of the Rhine and Scheldt rivers. The Waalre Formation (c.50 m thickness) consists of fine to medium white sands with thin discontinuous clay layers (flaser and wavy bedding), overlain by a 1–5 m thick clay bed (Fig. 2). The formation was previously interpreted as fluvial braided deposits (Van Dorsser, Reference Van Dorsser1956; Damoiseaux, Reference Damoiseaux1982). However, the sedimentary bedding points to tidal depositional environments (Kasse Reference Kasse1986) in accordance with conclusions by Dricot (Reference Dricot1961) for the equivalent Campine/Weelde Formation in Belgium. An estuarine environment with laterally migrating tidal channels in a warm-temperate climate during a sea-level high stand has been proposed (Kasse, Reference Kasse1988; Kasse & Bohncke, Reference Kasse, Bohncke, Maddy, Macklin and Woodward2001). The bluish-grey clay layer at the top of the formation was formed in a tidal marsh, changing upward into a freshwater swamp with local alder peat formation (Fig. 2).

Fig. 2. Litho- and chronostratigraphy of the Boudewijn sand pit (after Vandenberghe et al., Reference Vandenberghe, Kasse, Hossain, De Corte, Van den haute, Fuchs and Murray2004). Numbers are lithological units and capital letters are soils. Clay beds in unit 1 are discontinuous lenses. Soils B and C locally merge in a single podzol soil or a peat bed.
The Early Pleistocene Waalre Formation is separated from the overlying Late Pleistocene Boxtel Formation by an unconformity characterised by a thin gravel bed (Fig. 2). The gravel (2 mm to 5 cm) is partly broken by frost shattering and consists predominantly of well-rounded quartz and flint (Scheldt gravel association) (Zandstra, Reference Zandstra1969). The gravel, derived from Tertiary marine deposits south of the study area in Belgium, was deposited by the northward-flowing, ancestral Scheldt system in the Stramproy Formation during the Early Pleistocene (Kasse, Reference Kasse1988; Westerhoff et al., Reference Westerhoff, Kemna and Boenigk2008). Middle and Late Pleistocene uplift of the study area resulted in a northern shift of the North Sea basin hinge line. Subsequent erosion under periglacial climate conditions has eroded most of the Stramproy Formation, and the gravel was concentrated in an erosional residue on top of the Waalre Formation. In addition, the opening of the Dover Strait and the rearrangement of the drainage systems in the southern North Sea basin may have contributed to the Scheldt escarpment formation and deep erosion of the Flemish Valley west of the study area (Kasse, Reference Kasse1988; Gibbard, Reference Gibbard and Preece1995; Cohen et al., Reference Cohen, Gibbard and Weerts2014).
Previous research and age control of the site
Sand pit Boudewijn was investigated for more than 20 years (1984–2004) (Fig. 3A, B, C). In 2005 the exploitation of sand for the production of carbonate sandstone bricks stopped and pit faces degraded. The lithostratigraphy of the Early and Late Pleistocene sediments was studied by Kasse (Reference Kasse1988). Later Schwan (Reference Schwan1991) studied the sedimentology and sedimentary facies of the Weichselian Late Glacial to Holocene aeolian succession. He presented an uncalibrated radiocarbon age for the Late Glacial Usselo Soil (11,240 ± 50 BP) and two dates for the Holocene peat, which is time-equivalent with the Holocene podzol soil (9050 ± 45 BP for the base of the peat; 3000 ± 30 BP for the top of the peat) (Table 1). Fink (Reference Fink2000) and Vandenberghe et al. (Reference Vandenberghe, Kasse, Hossain, De Corte, Van den haute, Fuchs and Murray2004) dated the Late Weichselian and Holocene aeolian sediments by OSL dating. Older OSL dates may be less reliable and less precise (larger standard deviation); however, they are incorporated in Figure 9 further below, in which the dating information is combined, as there are no systematic outliers related to a certain method. Georadar investigations of the aeolian deposits have been performed by Van Dam and Schlager (Reference Van Dam and Schlager2000). Radiocarbon ages are presented in years BP, calibrated radiocarbon ages in cal. BP and OSL ages in ka.
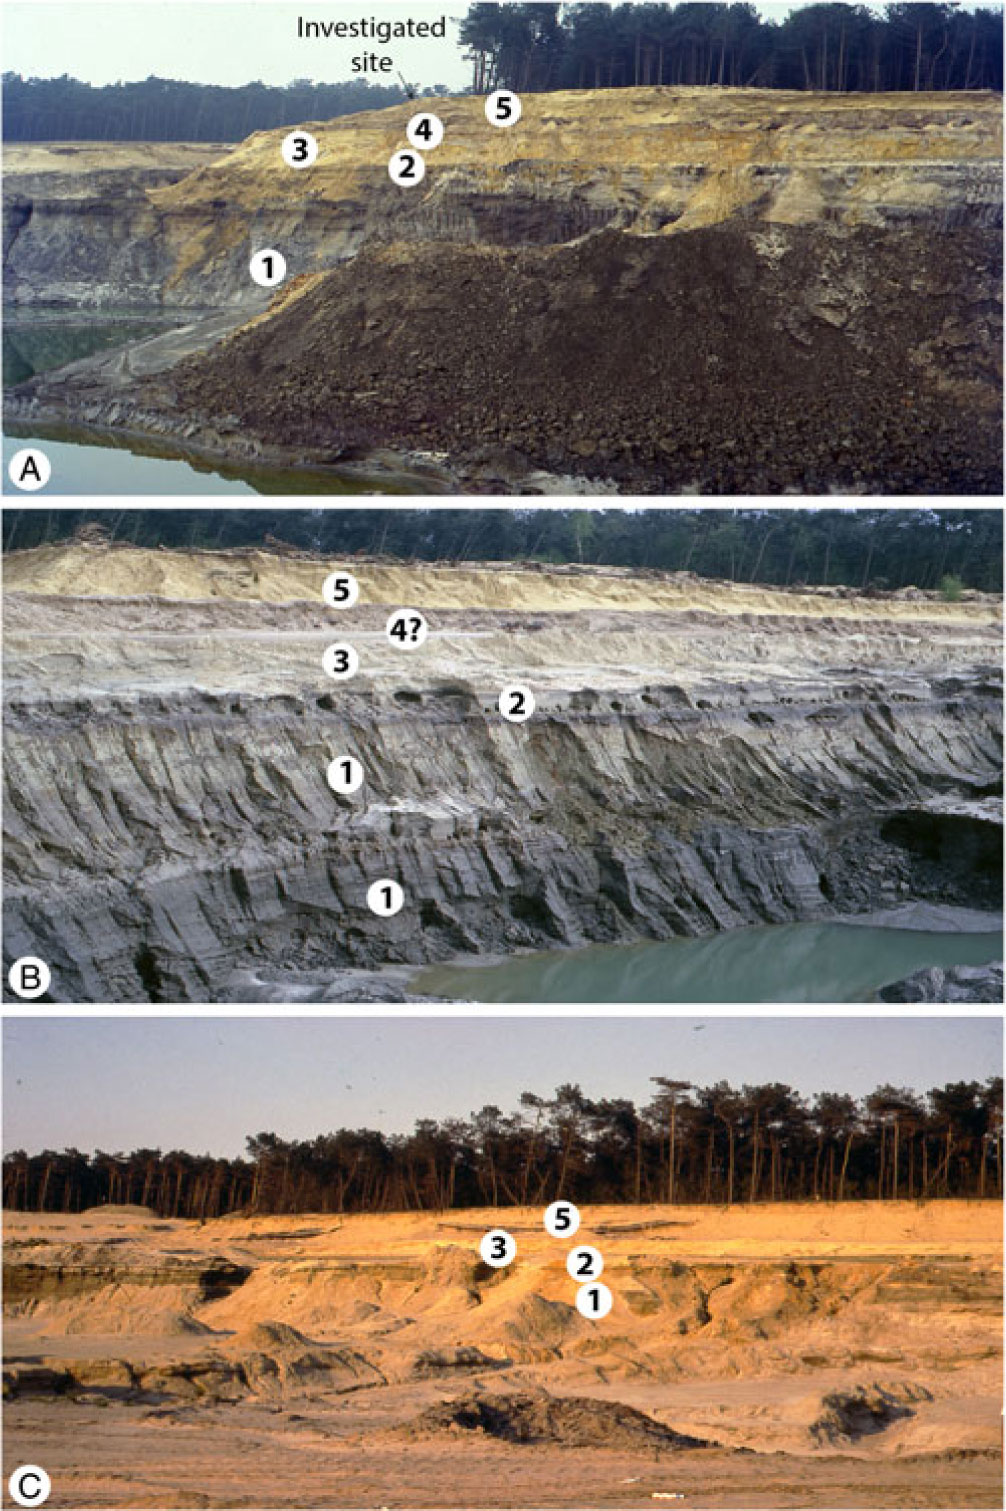
Fig. 3. Overview of the lithological succession in exposure Boudewijn during the exploitation period. (A) 1997 view to the north, section c.15 m high; (B) 1999 view to the northeast, section c.15 m high; (C) 1990 view to the east, section c.8 m high. Unit 1 = Waalre Formation; Unit 2 = Older Coversand II / Younger Coversand I and Usselo Soil; Unit 3 = Younger Coversand II; Unit 4 = older Drift Sand and podzol soils; 5 = Drift Sands.
Table 1. Radiocarbon dates of the organic units and soils in the Late Weichselian and Holocene aeolian succession. Radiocarbon dates mentioned in the text were calibrated to calendar years before AD 2000 using Oxcal 4.3 (Bronk Ramsey, Reference Bronk Ramsey2009; Reimer et al., Reference Reimer, Bard, Bayliss, Beck, Blackwell, Bronk Ramsey, Grootes, Guilderson, Haflidason, Hajdas, Hattž, Heaton, Hoffmann, Hogg, Hughen, Kaiser, Kromer, Manning, Niu, Reimer, Richards, Scott, Southon, Staff, Turney and Van der Plicht2013) cf is coarse fraction; ff is fine fraction

a Normal Amsterdam Level.
b Labcode of radiocarbon dating facility of Groningen University.
Methods
Grain-size analyses were performed following the method described by Konert and Vandenberghe (Reference Konert and Vandenberghe1997). Samples were pre-treated with H2O2 and HCl to remove organic matter and calcium carbonates. Grain-size distributions ranging from 0.1 to 2000 µm were measured with a Fritsch laser-diffraction instrument at the VU University Amsterdam.
Late Glacial Soil A and the two Holocene podzol soils B and C were sampled for pollen analysis and radiocarbon dating to reconstruct temporal vegetation changes that can be linked to climate change or human activity (Fig. 2). Local pollen assemblage zones are defined based on changes in species composition. They are correlated with the biochronostratigraphic zonation for the Late Glacial and Holocene in the Netherlands (Janssen, Reference Janssen1974; Van Geel et al., Reference Van Geel, Bohncke and Dee1981; Hoek, Reference Hoek1997; Bos et al., Reference Bos, Bohncke and Janssen2006), which provides indirect dating for deposition of the aeolian units. The soils (A–E–B–C horizons) were sampled in the field in metal boxes (40 × 10 × 10 cm) and described in detail in the laboratory. Sample location was based on lithology and lithological transitions. The pollen samples were prepared following standard procedures (Faegri & Iversen, Reference Faegri and Iversen1989). The pollen slides were examined using a Zeiss Axioskop 50 light microscope with a magnification of 630× with and without phase contrast. Pollen was determined using the pollen key of Moore et al. (Reference Moore, Webb and Collinson1991). The pollen sum includes tree taxa, shrubs and upland herbs. Wetland herbs, aquatics and Cyperaceae are excluded from the pollen sum. Pollen diagrams are constructed using TILIA software in which taxa are arranged in ecological groups (Grimm, Reference Grimm1992).
Despite the known problems related to radiocarbon dating of soils (Van Mourik et al., Reference Van Mourik, Wartenbergh, Mook and Streurman1995; Pierik et al., Reference Pierik, Van Lanen, Gouw-Bouman, Groenewoudt, Wallinga and Hoek2018), samples were taken at selected sites to investigate the reliability of soil dates in comparison with OSL dates of the overlying sand units. The aim of radiocarbon dating is to date the final moment of soil formation in order to establish the (maximum) age of the onset of aeolian deposition. The dates are based on bulk and macro remains samples (Table 1). Because dating of soils is often problematic due to old carbon in the soils, sampling locations were carefully selected in the field in plastic bags. Wood remains and peat were sampled from the top of the Usselo Soil. Humic, loamy fine sand with many macro remains (twigs) was sampled from the base of the Younger Coversand II unit. The podzols show lateral variability with humic-iron podzols on the higher locations and peaty podzols in palaeo-depressions. The uppermost top of the peaty podzols was selected for dating as the organic material accumulated on the wet surface and was less affected by bioturbation and incorporation of older carbon from below. The top of podzol B at site OSD99-4 consisted of well-preserved sandy sedge peat indicating the onset of aeolian deposition of unit 4. Radiocarbon dates mentioned in the text are calibrated using Oxcal 4.3 (Bronk Ramsey, Reference Bronk Ramsey2009; Reimer et al., Reference Reimer, Bard, Bayliss, Beck, Blackwell, Bronk Ramsey, Grootes, Guilderson, Haflidason, Hajdas, Hattž, Heaton, Hoffmann, Hogg, Hughen, Kaiser, Kromer, Manning, Niu, Reimer, Richards, Scott, Southon, Staff, Turney and Van der Plicht2013).
Results
Description of the Late Weichselian and Holocene units
The upper 8 m of the exposure (units 2, 3, 4, 5) consist of grey and yellow, fine (63–250 µm) to medium (250–500 µm) aeolian sands with intercalated soils that belong to the Boxtel Formation (Wierden Member, Delwijnen Member, Kootwijk Member) of late Weichselian and Holocene age (Fig. 2).
The areal distribution of the units and soils was established by yearly visits over the exploitation period. Units 2, 3 and 5 and Soil A (Usselo Soil) were always observed and extend over several hundred metres or more (Figs 2 and 3). Generally one podzol soil was found separating units 3 and 5, except where the podzol was deflated prior to the deposition of unit 5. Unit 4 and podzol soils B and C were observed locally over c.100 m. Outside the distribution area of unit 4, podzol soils B and C merge into one podzol.
Unit 2 (Older Coversand II / Younger Coversand I)
Unit 2 is an extensive, 0.2–1 m thick, unit that overlies the clay of the Waalre Formation. The lower boundary is sharp with some fine gravel, and locally periglacial structures (wedge cast) were observed (Fig. 4A).
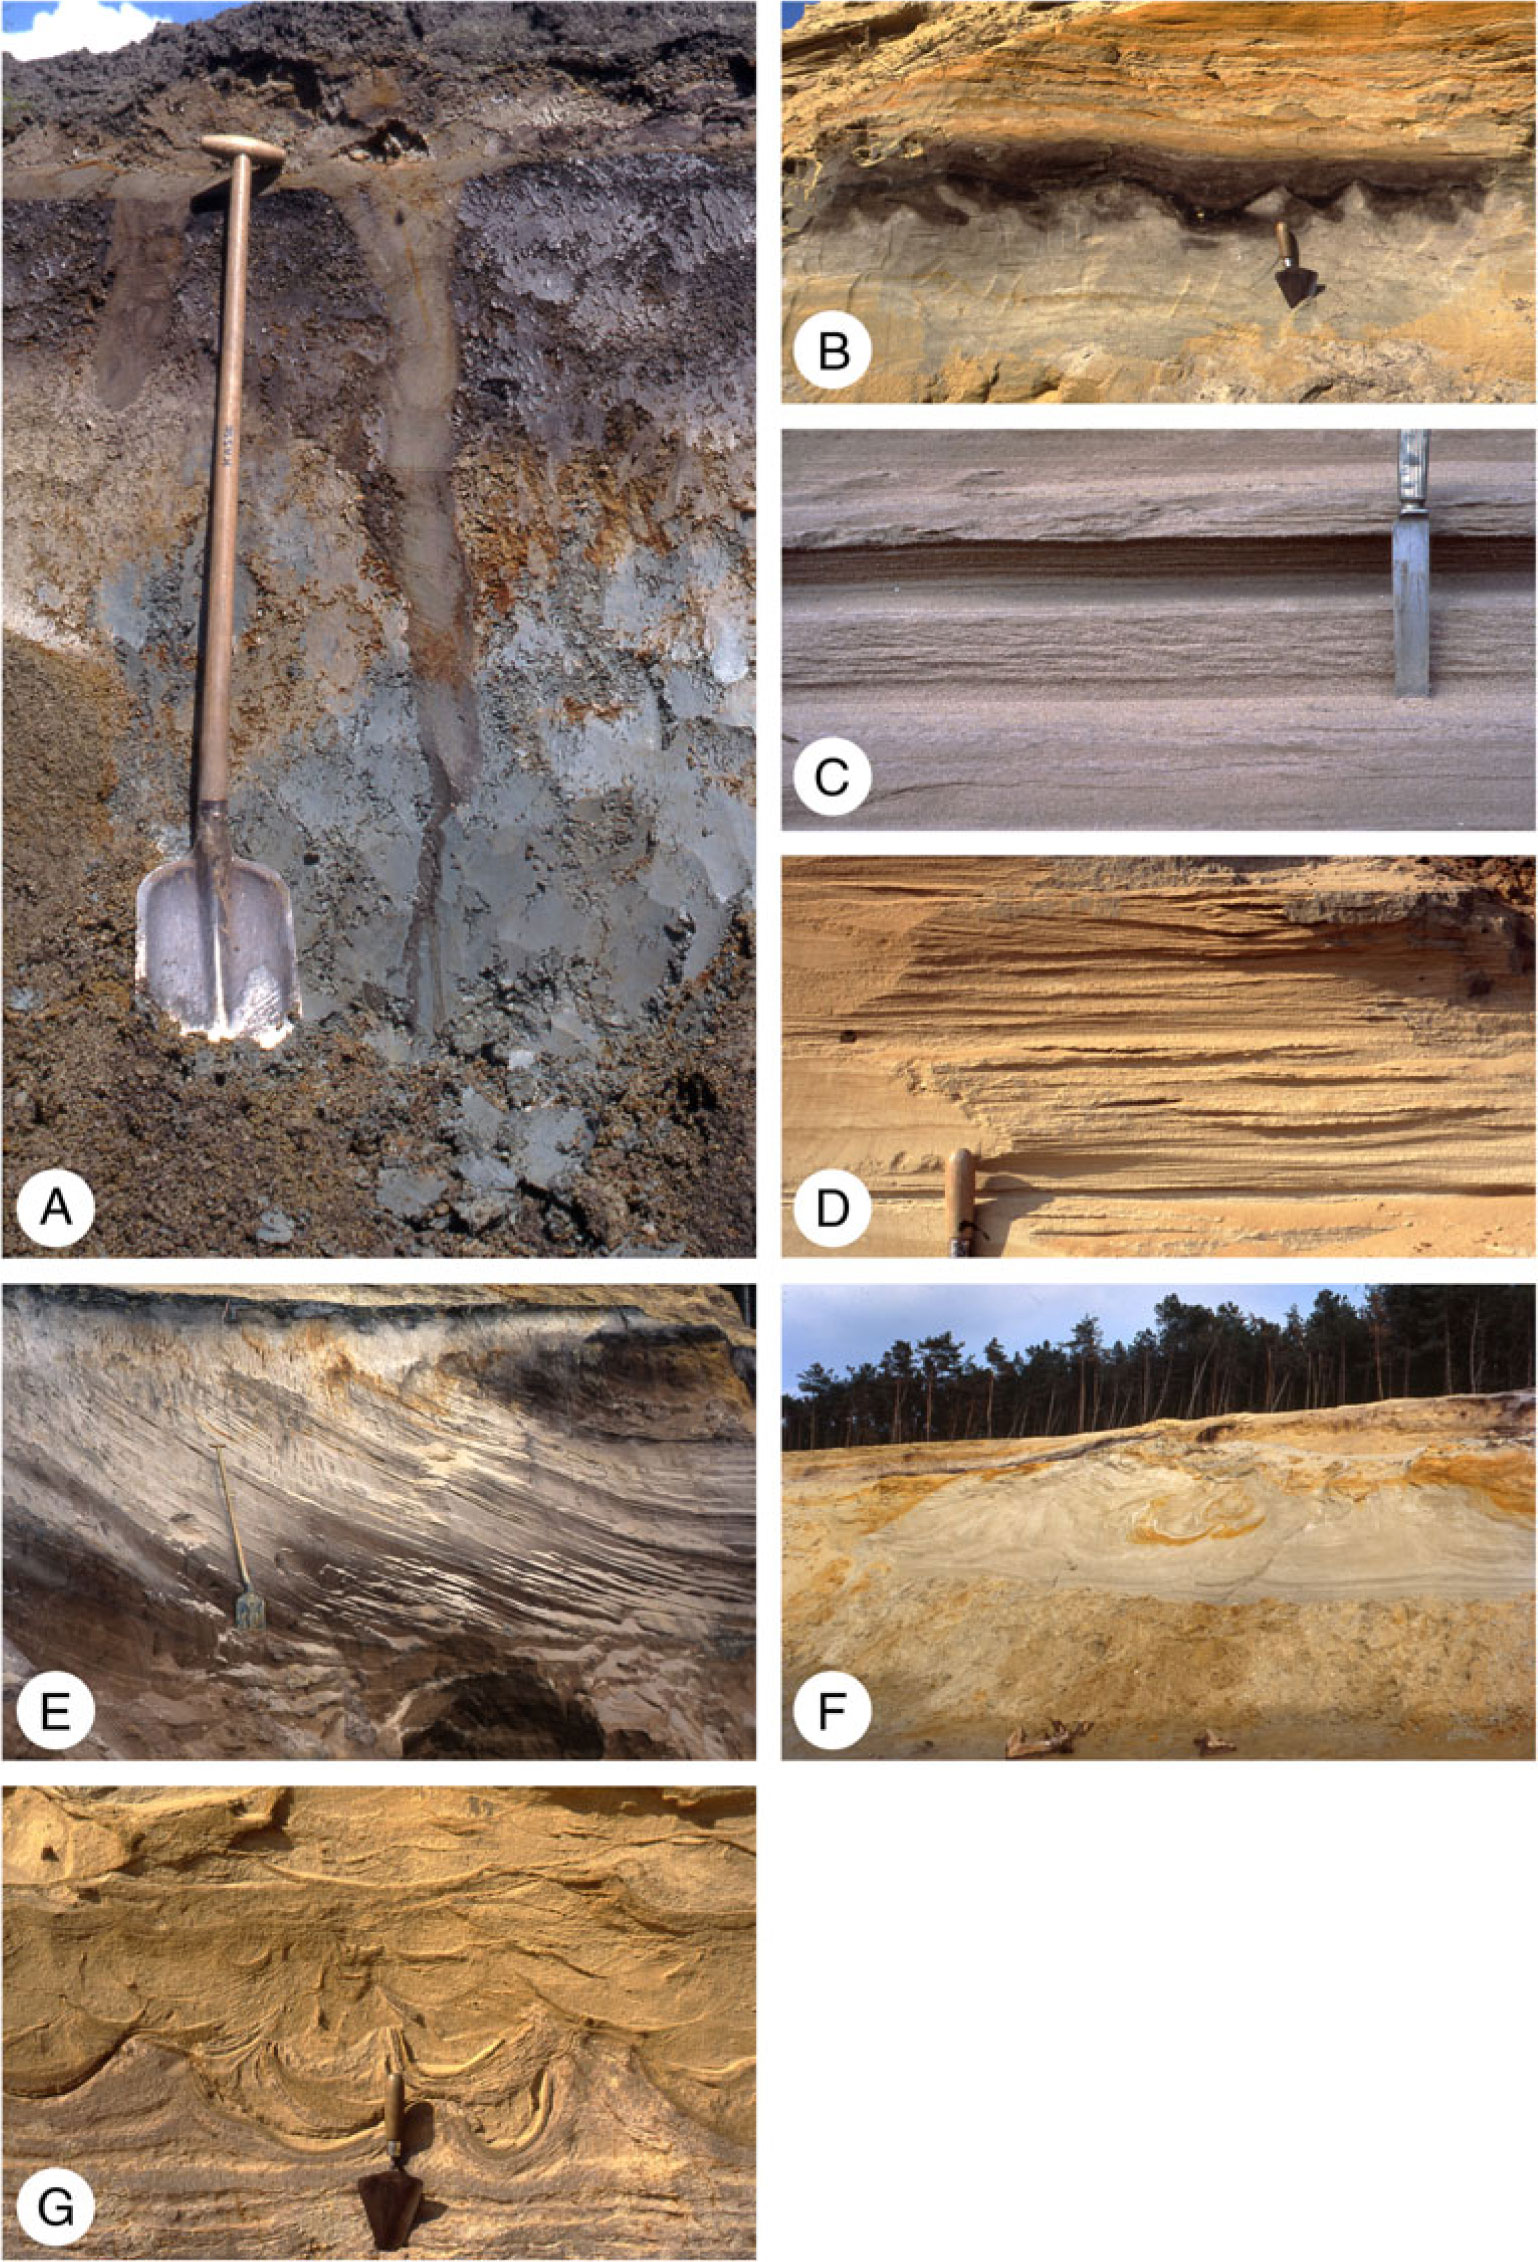
Fig. 4. Photographs of the units. (A) Large frost crack in the top of the Waalre Formation. (B) Cryoturbated peaty Usselo Soil. (C) Alternating horizontal and adhesion ripple cross-lamination in the wet-aeolian lower part of unit 3 (Younger Coversand II). (D) Horizontal and low-angle cross-bedding in the dry-aeolian upper part of unit 3 (Younger Coversand II). (E) Large-scale dune-slipface cross-bedding in unit 3 (Younger Coversand II) in which the Holocene podzol has developed with thick eluviation horizon following the sedimentary bedding. (F) Local large-scale involutions in unit 3 (Younger Coversand II); note black Holocene podzol soil in the upper part of the section. (G) Several generations of small-scale involutions at the transition from wet to dry aeolian deposition in unit 5 (Drift Sand).
Unit 2 consists of well-sorted loamy fine sands with mean grain size of 210 µm (n = 1) (Fig. 5). The upper part is finer-grained and poorly sorted, with a mean grain size of 127 µm and a high clay and silt fraction (23%). Wavy horizontal bedding, locally disturbed by cryogenic deformations, has been observed (Fig. 4B), but sedimentary structures are frequently obscured because of water-saturated conditions related to the impermeable clay below.
Fig. 5. (A) Grain-size classes and mean grain size of the Late Weichselian (Unit 2 Older Coversand II / Younger Coversand I; Unit 3 Younger Coversand II) and Holocene aeolian sequence (unit 4 older Drift Sand; unit 5 younger Drift Sand). Fine sand is 63–250 µm; medium sand is 250–500 µm; coarse sand is 500–2000 µm. (B) Grain-size distributions of unit 2 (sample OSD99-1, Older Coversand II / Younger Coversand I), unit 3 loamy base (OSD99-4, Younger Coversand II), unit 3 sand (OSD99-8, Younger Coversand II), unit 4 (OSD99-13, older Drift Sand) and unit 5 (OSD99-19, younger Drift Sand). Sample numbers are indicated in Figure 5A.
Soil A (Usselo Soil and basal part of Younger Coversand II)
Soil A is a multi-genetic soil complex. The lower part developed in the top of unit 2. It consists of a c.10 cm thick, dark-grey to black, humic Ah soil horizon (Usselo Soil), that locally grades laterally into a (involuted) peaty bed (Fig. 4B). The upper part of soil complex A consists of slightly organic, loamy, laminated fine sands that reflect the onset of deposition of unit 3.
Samples for pollen analysis were taken from soil complex A (Fig. 6A, B) and the result is presented in Figure 7A. Three local pollen zones are distinguished. Zone 1 (34–36 cm) is characterised by high Betula values and some upland herbs. In zone 2 (29.5–34 cm) Betula has declined and Pinus and ferns are dominant. Zone 3 (0–29.5 cm: organic loamy fine sand) shows, compared to zone 2, a strong decline in Pinus and an increase of Juniperus and Salix. Ericaceae and dryland herbs are important, while high Cyperaceae and Sphagnum values indicate local wet conditions. Empetrum and Armeria are present in low values. Alnus, Ilex and Tsuga show an increase in this zone.
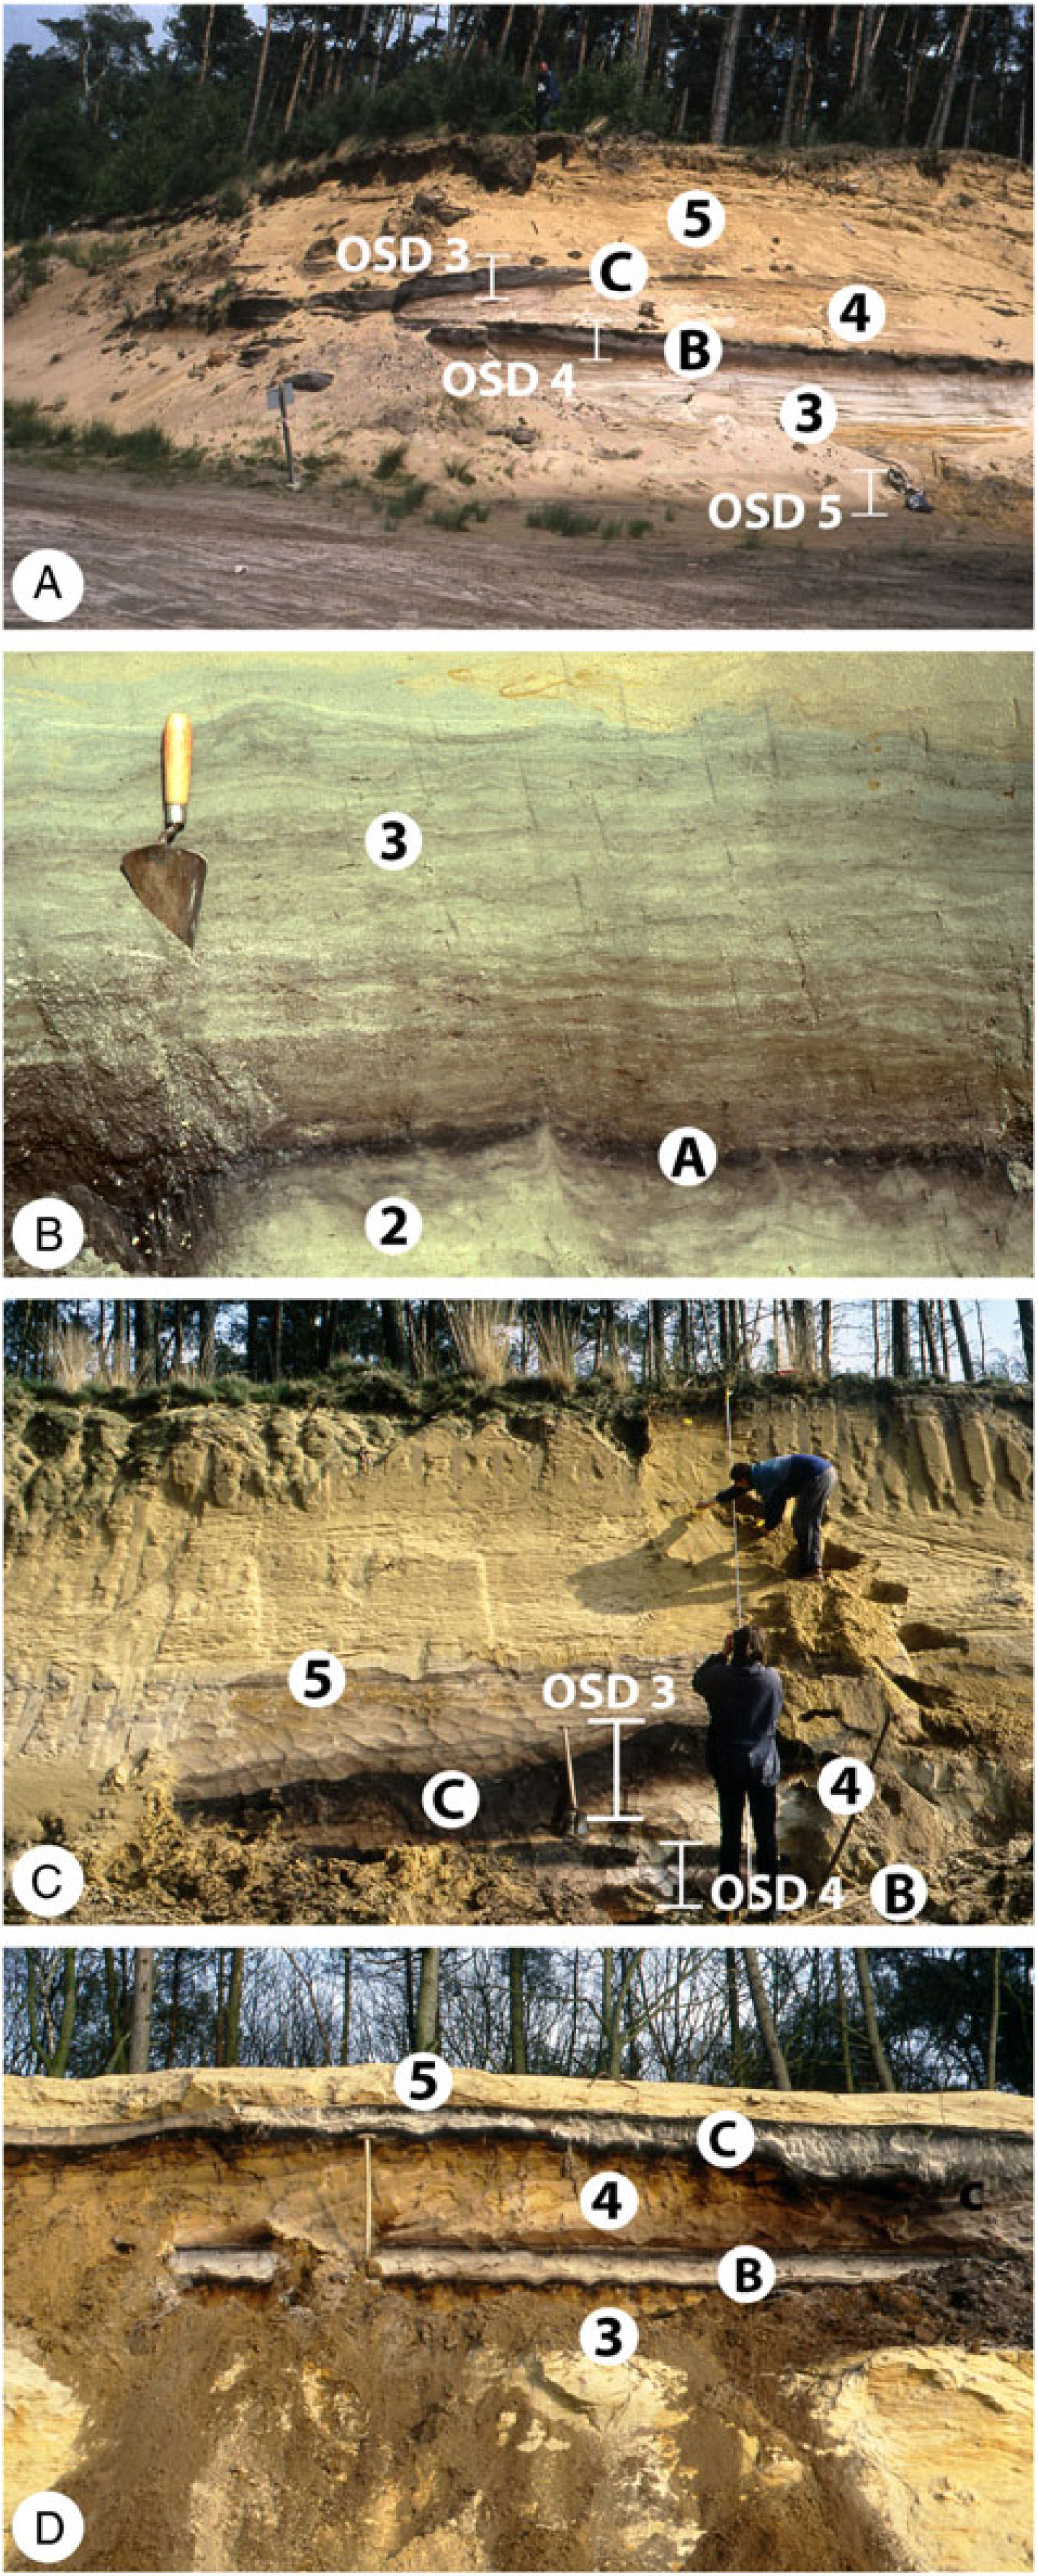
Fig. 6. (A) Location of the investigated pollen profiles OSD3 (soil C), OSD4 (soil B) and OSD5 (soil A); lithological units are indicated by numbers; for location see Figure 3A. (B) Sedimentary succession at pollen profile OSD5 with the Usselo Soil (darkest colour) at the base and laminated organic fine sand in the lower part of unit 3 (Younger Coversand II) near the trowel; note the gradual decrease in organic matter and increase in sand content reflecting the onset of aeolian deposition of unit 3. (C) Location of pollen profiles OSD3 (soil C) and OSD4 (podzol B); note that the two soils merge to the left into one soil and the upper soil changes laterally from a podzol to a peaty soil. (D) Two well-developed humic-iron podzols and intercalated older Drift Sand unit 4 (eastern pitface, c.50 m east of OSD3/4/5).
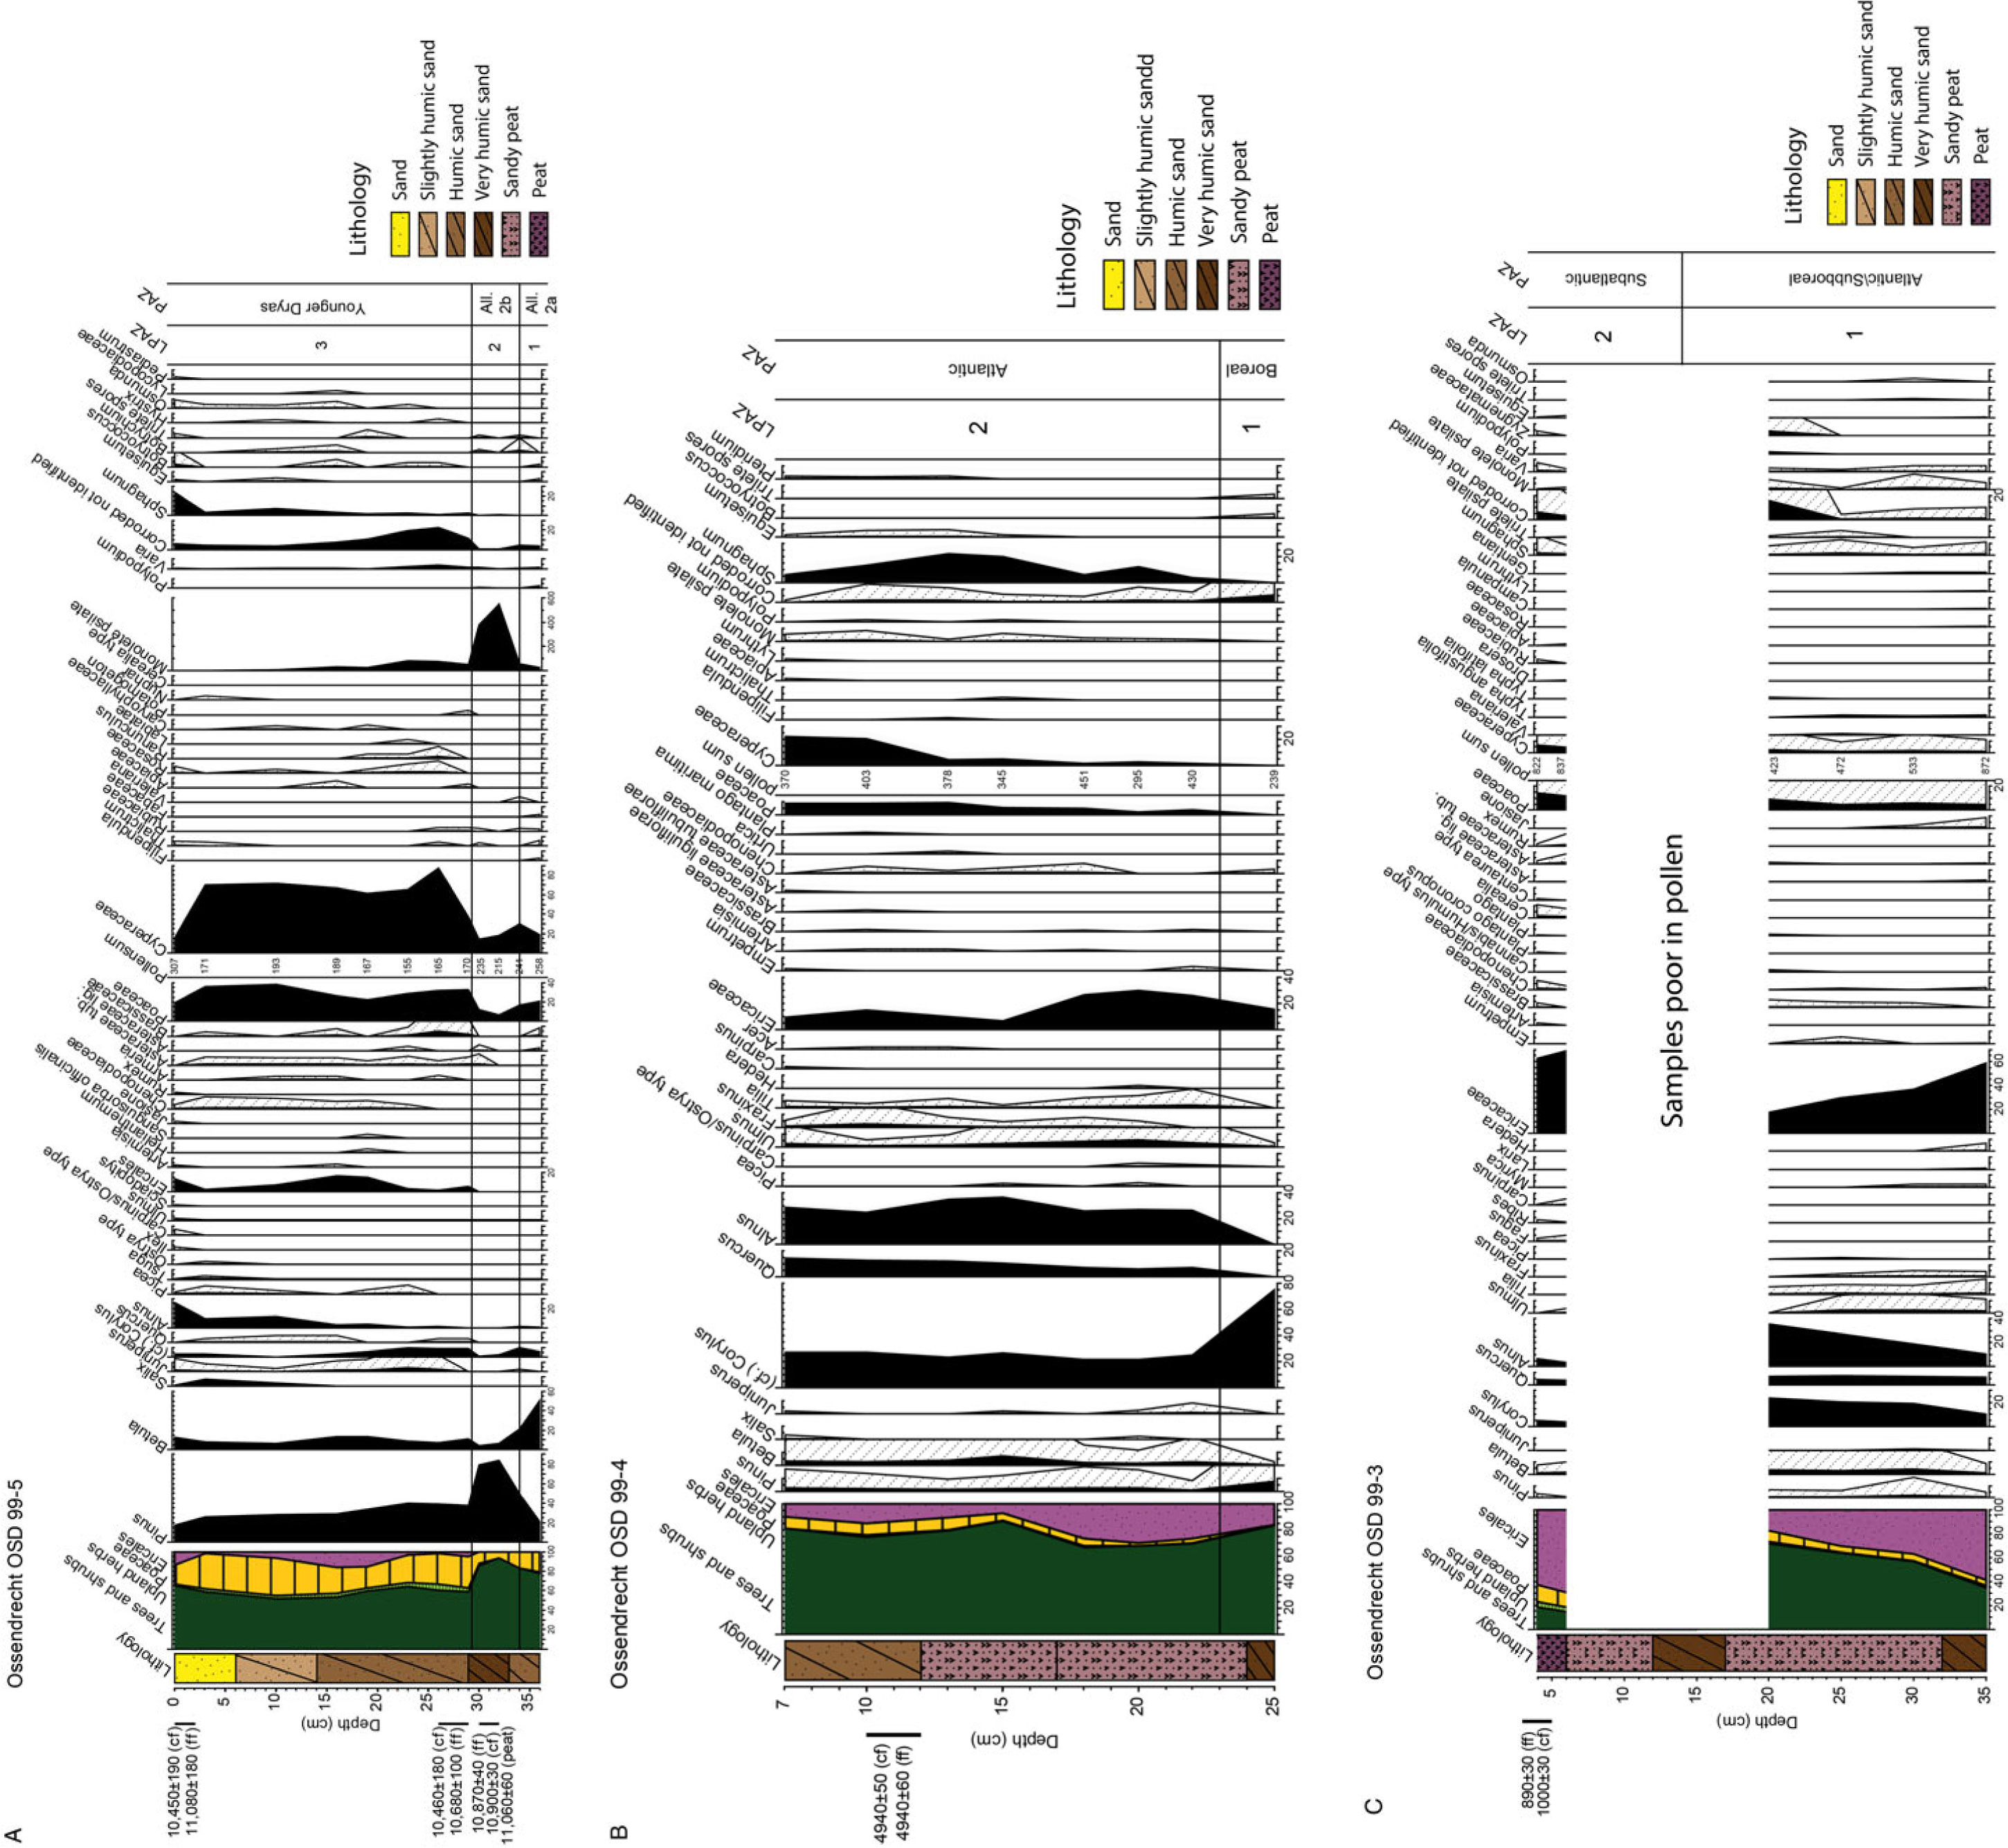
Fig. 7. (A) Pollen diagram OSD99-5 from soil complex A (Usselo Soil and fine-grained basal part of Younger Coversand II). Note the sharp drop in Pinus and increase of upland herbs and Poaceae at the Allerød – Younger Dryas transition. (B) Pollen diagram OSD99-4 from lower podzol B showing the Early to Middle Holocene vegetation development, early presence of heathland (Ericaceae) and weak indications of human activity (Poaceae, upland herbs). (C) Pollen diagram OSD99-3 from upper podzol C showing the Middle to Late Holocene vegetation development. Note the high presence of Ericaceae and Cerealia in the upper part, indicating strong human impact on the vegetation.
Radiocarbon dates of wood fragments from the black Ah horizon (Usselo Soil) provided uncalibrated ages of 10,870 ± 40, 10,900 ± 30 and 11,060 ± 60 BP (Table 1), which point to a late Allerød age of this soil (Vandenberghe et al., Reference Vandenberghe, Kasse, Hossain, De Corte, Van den haute, Fuchs and Murray2004). Radiocarbon dates from the overlying loamy, organic fine sand (base of Younger Coversand II) yield uncalibrated ages of 10,460 ± 180 (cf) and 10,680 ± 100 BP (ff) for the lower sample; 10,450 ± 190 (cf) and 11,080 ± 180 (ff) for the upper sample (Table 1; Fig. 7A). The fresh brown organic material formed in situ and was not reworked from the underlying darker Usselo soil. Therefore, it provides the age of the onset of aeolian sedimentation of unit 3 (Younger Coversand II).
Unit 3 (Younger Coversand II)
Unit 3 overlies soil complex A and is generally 2 m thick, but the maximum thickness is unknown due to later deflation of the higher parts of unit 3 (Figs 2 and 3). Unit 3 is present over the whole exposed area and shows an overall coarsening-upward trend from c.100 to 300 µm (Fig. 5A). The lower 25 cm consists of greyish-brown, humic, laminated, loamy fine sands (mean 122 µm, 19–25% clay and silt; n = 2). Loam and organic matter content decrease upward which is related to increased aeolian sand deposition (Fig. 6B). The main part of unit 3 consists of light-grey to yellow medium sands with gleyic mottles and a mean grain size of 267 µm (n = 7) (Fig. 5A). The clay and silt fraction is low, at 1–3%, and a prominent coarse sand fraction larger than 500 µm of 8–17% is present (Fig. 5B).
In the lower part of unit 3, wavy horizontal bedding, crinkly lamination and adhesion ripple bedding are the dominant bedding types (Figs 4C and 8A). The upper part of the sequence is dominated by plane horizontal bedding and low-angle cross bedding (Fig. 4D). High-angle, dune slipface cross-bedding is rarely observed (Fig. 4E).
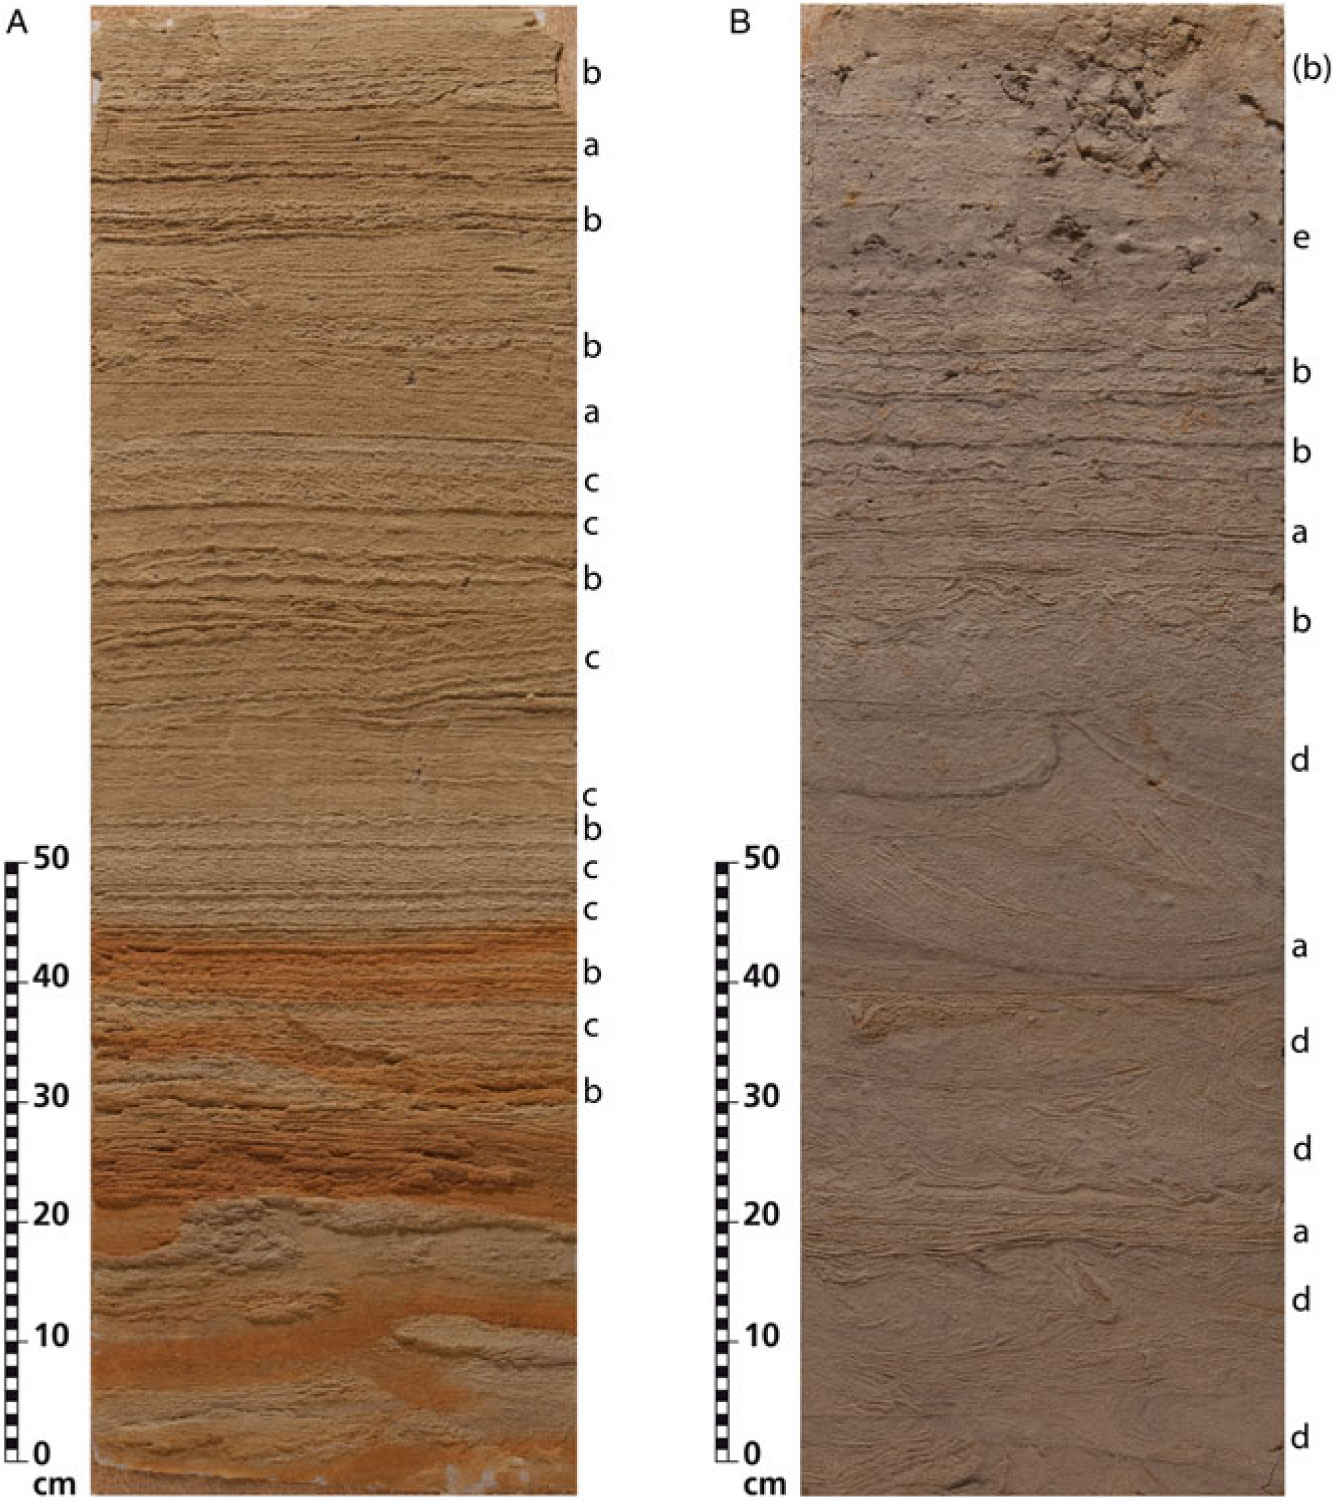
Fig. 8. (A) Lacquer peel of the base of unit 3 (Younger Coversand II) showing drying-upward sequence with wet aeolian bedding gradually changing to more dry aeolian bedding. The Usselo Soil (soil A) is situated c.0.5 m below the peel. (B) Lacquer peel of basal part of unit 5 (Drift Sand) dominated by wet aeolian bedding and involutions. Legend a: dry aeolian horizontal lamination; b: wet aeolian crinkly lamination; c: wet aeolian adhesion ripple lamination; d: involuted bedding; e: incipient soil.
Periglacial structures like frost cracks, ice-wedge casts or sand wedges have not been observed, but locally metre-scale large involutions were found (Fig. 4F).
Soil B (podzol)
Soil B has formed in the upper part of unit 3 (Younger Coversand II). A humic-iron podzol was found on higher well-drained dunes, and a peaty podzol was found in the former dune slacks (Fig. 6A, C, D). The podzol formed in and follows the undulating morphology of unit 3, which indicates that unit 3 was deposited in low dunes not exceeding 5 m in height (Fig. 3C).
Podzol soil B was sampled at site OSD99-4 (Fig. 6A, C). The results of the pollen analysis are presented in Figure 7B. Two pollen zones are distinguished. Zone 1 (23–25 cm) is dominated by high arboreal pollen values, mainly of Corylus and Pinus, and by Ericaceae (Boreal period). The start of zone 2 (7–23 cm) is characterised by the first presence of Alnus, Quercus, Tilia, Ulmus (Atlantic period). Somewhat higher in this zone, Fraxinus appears and increases in value. Ericaceae are present throughout the zone, and Cyperaceae and Poaceae increase upward. Some dryland herbs like Artemisia, Chenopodicaceae, Asteraceae and Brassicaceae are present that possibly indicate agricultural activity.
The sandy sedge peat at the top of podzol soil B was radiocarbon-dated at 4940 ± 50 BP (cf) and 4940 ± 60 BP (ff) (Table 1).
Unit 4 (older Drift Sand)
Unit 4, intercalated between podzol soils B and C, has a thickness of maximal 1 m (Fig. 6A, D). This unit was observed locally over a distance of c.100 m. Unit 4 consists of light-grey to yellow, medium sand with a mean grain size of 303 µm (n = 3) and a weak coarsening-upward trend (Fig. 5A). Grain-size distributions resemble unit 3. The fine fraction smaller than 63 µm is almost absent (less than 1–2%), but a distinct coarse sand fraction larger than 500 µm is present (8–21%) (Fig. 5B).
Bedding types are dominated by horizontal bedding and low-angle cross-bedding (Fig. 6A, D).
Soil C (podzol)
Soil C developed in the upper part of unit 4. Like soil B, the podzol shows a lateral change from a well-drained humic-iron podzol to a lower-lying peaty podzol (Fig. 6A). Site OSD99-3 has been sampled for pollen analysis and radiocarbon dating (Fig. 6C).
The pollen diagram of podzol soil C is presented in Figure 7C. Two pollen zones are distinguished separated by an interval poor in pollen. Zone 1 (20–35 cm) is characterised by Alnus, Corylus, Quercus, Tilia and Ulmus (Atlantic–Subboreal period). Fagus and Carpinus have not been observed. Ericaceae values are high, and dryland herbs like Chenopodicaceae, Asteraceae, Brassicaceae and Jasione are present but Cerealia have not been found.
Zone 2 (4–6 cm) is characterised by low arboreal pollen values and high Ericaceae values. Alnus, Betula, Corylus and Quercus strongly decline compared to zone 1, while Ulmus and Tilia are scarce or even absent. Fagus and Carpinus are present for the first time. Upland herbs are well presented with Chenopodicaceae, Asteraceae, Brassicaceae and Rumex. Cerealia, Centaurea-type and Plantago are characteristic elements of this zone (Subatlantic period).
Uncalibrated radiocarbon dates of 1000 ± 30 BP (cf) and 890 ± 30 BP (ff) from the peaty top of podzol soil C (Table 1; Fig. 7C: interval 3–5 cm) provide a maximum age for the deposition of drift-sand unit 5.
Unit 5 (younger Drift Sand) and Soil D (micropodzol)
Unit 5 overlies podzol soil C and was observed in all pit faces over the years of exploitation (Figs 3 and 6A). Its thickness ranges from 1 to 5 m. A weakly developed soil or micropodzol (Dutch: Duinvaaggrond) occurs at the present-day surface.
Unit 5 consists of brownish-grey to yellow, medium sand with a mean grain size of 312 µm (n = 6) (Fig. 5A). The lower brownish-grey part fills in former depressions of the landscape (Fig. 6C). A coarsening-upward trend from 200 to 400 µm is visible in the upper part of the unit (Fig. 5A). The sediments have generally less than 2% clay and silt fraction (<63 µm). The coarse fraction larger than 500 µm varies between 13% and 33% and reaches the highest values of the complete aeolian succession (Fig. 5B). One sample (17) forms an exception to the general grain-size characteristics. It was taken at the transition from greyish to yellow sand and contained many crinkly humic laminae. It is finer-grained (mean 186 µm), with higher fine fraction (4%) and lower coarse fraction (2%).
Wavy horizontal bedding, crinkly lamination and adhesion ripple bedding are the dominant bedding types in the lower brownish-grey part of unit 5 (Fig. 8B). The upper part of the sequence is dominated by plane horizontal bedding and low-angle cross-bedding (Fig. 6A and C). High-angle cross-bedding, indicating dune slipface deposition, is rarely observed.
Decimetre-scale involutions are frequently found in unit 5, especially in the brownish-grey lower part and at the transition to the yellow upper part (Figs 4G and 8B). Several phases of loading followed by renewed sedimentation are present.
Interpretation and discussion
During 20 years of exploitation, exposure Boudewijn revealed the presence of four fine to medium-grained aeolian sand units with intercalated soils of late Weichselian and Holocene age (Figs 2 and 3). The results are summarised in Figure 9 in which the new results are combined with previous age determinations (Schwan, Reference Schwan1991; Fink, Reference Fink2000; Vandenberghe et al., Reference Vandenberghe, Kasse, Hossain, De Corte, Van den haute, Fuchs and Murray2004). The local pollen zones of the soils are correlated with the well-established biochrostratigraphy of the Late Glacial (Hoek, Reference Hoek1997, Reference Hoek2001) and the Holocene (Janssen, Reference Janssen1974; Van Geel et al., Reference Van Geel, Bohncke and Dee1981; Bos & Zuidhoff, Reference Bos and Zuidhoff2015).

Fig. 9. Synthesis of the Late Glacial and Holocene lithostratigraphy, aeolian depositional phases, soil formation and timing of the environmental changes. 1 to 5 are lithological units; A–B–C–D are soils; OSD3–4–5 are pollen profiles (Fig. 7); 1, 4, 8, 13, 19 are grain-size samples (Fig. 5B). Note that there is almost no time gap between the radiocarbon-dated peaty top of the soils and the OSL-dated overlying sands. Age jumps in the time–depth plot coincide with soil formation (sedimentary hiatus), and high sedimentation rates are present in the aeolian units. Calibrated radiocarbon ages of the Usselo Soil (soil A) are in good agreement with OSL dates of units 2 and 3 from different publications.
General sedimentary evolution
The grain-size analysis shows an overall coarsening-upward trend, with fine sands (mean 169 µm) in unit 2 grading upward into medium sands (200–400 µm) in unit 5 (Figs 5 and 9). Superimposed on this general trend, smaller-scale coarsening-upward sequences are visible within units 3, 4 and 5. These coarsening-upward trends on different scales can be explained by changes in the aeolian depositional environment (see discussion below). In the lower finer-grained parts of the aeolian units 2, 3 and 5, the presence of adhesion ripple bedding and wavy to crinkly lamination points to wet-aeolian deposition (Hunter, Reference Hunter1980; Ahlbrandt & Fryberger, Reference Ahlbrandt, Fryberger, Scholle and Spearing1982; Ruegg, Reference Ruegg, Brookfield and Ahlbrandt1983: facies B; Schwan, Reference Schwan1986, Reference Schwan1988: facies 3; Kasse, Reference Kasse2002: facies 2) (Figs 4B, C and 8). The sand was probably deposited from the traction load and the silty fine sand by adhesion of the suspension load on a moist to wet depositional surface. According to Schwan (Reference Schwan1986), the sand and silty fine sand might reflect alternating deposition attributed to (possibly seasonal) variations in wind velocity. Storm events resulted in sand deposition while during fair weather periods silt settled from suspension and adhered on a damp surface. The well-developed palaeo-wetness indicators in the Boudewijn sand pit, despite its high position in the landscape, are related to the underlying impermeable clay of the Waalre Formation leading to a perched water table.
The upper parts of units 3, 4 and 5 are dominated by horizontal lamination and low-angle cross bedding, that indicate aeolian deposition in plane beds or by wind ripples on a dry surface of a sand sheet or in low dunes (Hunter, Reference Hunter1977; Fryberger et al., Reference Fryberger, Ahlbrandt and Andrews1979; Ruegg, Reference Ruegg, Brookfield and Ahlbrandt1983: facies A; Schwan, Reference Schwan1986, Reference Schwan1988: facies 2; Kasse, Reference Kasse2002: facies 3) (Figs 4D and 6C).
The changes in grain size and sedimentary bedding in the units (and in the succession as a whole) indicate that changes from wet to dry aeolian depositional environments (units 3 and 5) occurred. Such vertical facies changes and drying-up sequences have previously been related to environmental changes in climate, permafrost or wind regime (Schwan, Reference Schwan1986; Koster, Reference Koster1988: table 4; Stapert & Veenstra, Reference Stapert and Veenstra1988: 11–12). However, evidence for permafrost (ice-wedge casts) was not encountered in the aeolian sequence of exposure Boudewijn, nor in equivalent units in the Netherlands (Maarleveld, Reference Maarleveld1976; Kasse, Reference Kasse2002). These drying-up sequences can be explained by system-intrinsic changes in topography and drainage conditions by the accumulation of wind-blown sand and dune migration over wet produne or interdune areas caused by the underlying impermeable clay (Ahlbrandt & Fryberger, Reference Ahlbrandt, Fryberger, Scholle and Spearing1982; Schwan Reference Schwan1988: 224; Reference Schwan1991). The increasing thickness and relief during the deposition of the sediment bodies (units) resulted in a decrease of the soil moisture content and a drying-up sequence. This holds true for the individual units but also for the stacked up to 8 m thick aeolian complex overlying the Brabantse Wal (Fig. 2).
Late Pleniglacial and early Late Glacial coversand deposition (Unit 2: Older Coversand II / Younger Coversand I)
Some periglacial deformation structures were found in the top of the clay of the Waalre Formation (unit 1), separated from unit 2 by an erosional unconformity (Fig. 4A). The scarcity of periglacial deformation structures in the top of the clay, while they are reported more regularly to the east (Kasse, Reference Kasse1988, e.g. exposures Wouwse Plantage, Meerle), may be related to dry subsoil conditions below the clay layer, because of the low groundwater table in this region close to the Brabantse Wal escarpment. Apparently, ice-rich permafrost did not develop in the clay and sand of the Waalre Formation during the Late Pleniglacial, and periglacial loading due to melting of the permafrost did not occur.
Unit 2 is generally free from periglacial deformations. Ice-wedge casts and large-scale loading structures are generally interpreted as the result of permafrost associated with the Last Glacial Maximum (LGM) (Vandenberghe, Reference Vandenberghe1985; Vandenberghe et al., Reference Vandenberghe, Derese, Kasse and Van den haute2013). Previous OSL dating of sand unit 2 provided direct dates ranging between 14.6 ± 0.9 ka and 15.3 ± 0.9 ka (Vandenberghe et al., Reference Vandenberghe, Kasse, Hossain, De Corte, Van den haute, Fuchs and Murray2004) and 18.1 ± 2.9 ka (Fink, Reference Fink2000) (Fig. 9). Based on the OSL dates and overlying radiocarbon dates from soil complex A (see below), it is concluded that unit 2 formed after the LGM during the Weichselian Late Pleniglacial and early Late Glacial. In this period, widespread aeolian deposition occurred over most of the Netherlands and surrounding regions, and the landscape was covered by an aeolian sand sheet of coversands (Older Coversand II) (Koster, Reference Koster1988; Kasse, Reference Kasse1997, Reference Kasse2002; Kasse et al., Reference Kasse, Vandenberghe, De Corte and Van den haute2007; Derese, Reference Derese2011; Vandenberghe et al., Reference Vandenberghe, Derese, Kasse and Van den haute2013). This phase of coversand deposition lasted at least till the start of the Late Glacial, but often it continued into the Late Glacial (Van Geel et al., Reference Van Geel, Coope and Van der Hammen1989; Kasse, Reference Kasse and Schirmer1999a, Reference Kasse2002). The OSL dates cannot distinguish whether the sediments belong to the Older Coversand II and/or Younger Coversand I units because the Lower Loamy Bed separating the two coversand units was not encountered. Coversand deposition in the Netherlands came to a halt during the Allerød period when the so-called Usselo Soil formed, which is a widespread soil horizon in the Late Glacial aeolian stratigraphy of northwest and central Europe (Van der Hammen Reference Van der Hammen1951, Reference Van der Hammen, Van der Hammen and Wijmstra1971; Derese et al., Reference Derese, Vandenberghe, Paulissen and Van den haute2009, Reference Derese, Vandenberghe, Van Gils, Mees, Paulissen and Van den haute2012; Kaiser et al., Reference Kaiser, Hilgers, Schlaak, Jankowski, Kühn, Bussemer and Przegiętka2009; Vandenberghe et al., Reference Vandenberghe, Derese, Kasse and Van den haute2013).
Allerød soil formation and early Younger Dryas deposition
The local pollen zones of soil complex A (Fig. 7A) can be correlated with the regionally well-established biochronostratigraphy of the Late Glacial (Hoek, Reference Hoek1997, Reference Hoek2001). The dominance of Betula in zone 1 (34–36 cm) followed by Pinus in zone 2 (29.5–34 cm) is equivalent with respectively the Betula phase (PAZ 2a: 14.0–13.2 ka cal. BP) and Pinus phase (PAZ 2b: 13.2–13.0 ka cal. BP) of the Allerød period.
The strong decline in Pinus and increase of Juniperus, Ericaceae and dryland herbs in the organic, loamy fine sand (Fig. 7A: zone 3: 0–29.5 cm) is correlated with PAZ 3 (13.0–11.7 ka cal. BP) of the Younger Dryas stadial (Hoek, Reference Hoek1997, Reference Hoek2001; Bos et al., Reference Bos, Bohncke and Janssen2006). Empetrum and Armeria are typical elements of the Younger Dryas period. Pine forests declined with the climatic deterioration during the Allerød to Younger Dryas transition leading to forest fires, and a more open landscape and heliophilous vegetation developed (Van der Hammen and Van Geel Reference Van der Hammen and Van Geel2008). Local wet conditions, as indicated by the grain size and sedimentary bedding, are reflected by high Cyperaceae and Sphagnum values. The presence of Alnus, Ilex and especially Tsuga probably reflects landscape instability (erosion) and reworking of pollen from the Early Pleistocene sediments below (Waalre Formation) (Kasse, Reference Kasse1988: pollen diagrams Korteven and Ravels). The sediments of pollen zone 3 can be regarded as the first slow response to the Younger Dryas cooling that culminated later in extensive river dune formation (unit 3).
The uncalibrated radiocarbon dates of wood fragments from soil A (Fig. 7A: pollen zone 2) (10,870 ± 40; 10,900 ± 30 and 11,060 ± 60 BP; c.12.8–13.1 ka cal. BP) (Table 1) are in good agreement with the biochronostratigraphic interpretation (Allerød Pinus phase, PAZ 2b: 13.0–13.2 ka cal. BP; Hoek, Reference Hoek2001). The dates indicate a late Allerød age, and the lower part of soil complex A is therefore correlated with the Usselo Soil (Vandenberghe et al., Reference Vandenberghe, Kasse, Hossain, De Corte, Van den haute, Fuchs and Murray2004). The Usselo Soil in the Boudewijn sand pit was previously dated at 11,240 ± 50 BP (c.13.1–13.3 ka cal. BP) by Schwan (Reference Schwan1991), which is slightly older, but possibly a deeper or larger part of the soil was dated then. The dates are in accordance with the mean value of 23 dates on charcoal from the Usselo Soil in the Netherlands that cluster around 11,000 BP (c.13.1 ka cal. BP) (Hoek, Reference Hoek1997: 43). More recent high-resolution radiocarbon dating of charcoal from the Usselo Soil and overlying Ahrensburg occupation layer at site Geldrop-A2 gave a mean age of 10,870 ± 15 BP (c.12.8 ka cal. BP) (Van Hoesel et al., Reference Van Hoesel, Hoek, Braadbaart, Van der Plicht, Pennock and Drury2012) and 10,915 ± 35 BP (c.12.8 ka cal. BP) (Kasse et al., Reference Kasse, Tebbens, Tump, Deeben, Derese, De Grave and Vandenberghe2018) respectively.
The radiocarbon dates of the loamy, slightly organic, fine sand in the upper part of soil complex A (10,450 ± 190; 11,080 ± 180; 10,460 ± 180 and 10,680 ± 100 BP; c.11.8–12.8 ka cal. BP) (Table 1) indicate a Younger Dryas age. This is in good agreement with the regional biochronostratigraphic interpretation of pollen zone 3 (Fig. 7A; Younger Dryas PAZ 3: 11.7–13.0 ka cal. BP; Hoek, Reference Hoek2001). The 11,080 ± 180 BP date is equal in age to the underlying Usselo Soil and is therefore considered to be too old. The gradual sedimentary transition from the fine-grained upper part of soil complex A into the overlying sand unit 3 demonstrates that deposition of unit 3 slowly started in the Younger Dryas. It shows the delayed response of the aeolian system to the Younger Dryas cooling.
Younger Dryas river dune formation (unit 3: Younger Coversand II)
Unit 3 is characterised by a coarsening-upward and drying-upward sequence with finer grained wet-aeolian deposition at the base and coarser-grained dry-aeolian deposition in the upper part (Figs 4C, D, 5 and 8A) (Schwan, Reference Schwan1991). The relief of the overlying podzol soil B and sporadic presence of slipface deposition points to dune formation not exceeding 5 m in height in the upper part (Fig. 4E) (cf. Schwan, Reference Schwan1991: Fig. 4).
The fine-grained basal part is interpreted as a wet produne environment that formed in front of the dunes that migrated over the Usselo Soil (Fig. 6B). The dune advance raised the water table in front of the dunes, fine-grained loamy material was trapped on the wet surface and organic material became preserved. In addition to system-intrinsic depositional changes, external climate factors also played a role. The cold Younger Dryas climate and vegetation decline (Fig. 7A: pollen zone 3) resulted in lower evapotranspiration and deeper seasonal frost which also increased the surface wetness. Higher lake levels have been reported for this period in eastern Noord Brabant (Bos et al., Reference Bos, Bohncke and Janssen2006).
The small-scale deformations of the Usselo Soil or peat layer (Fig. 4B) can be explained by increased frost activity at the start of the Younger Dryas period. Large involutions were found locally in the lower wet-aeolian part of unit 3 (Fig. 4F). Metre-scale and widespread loading phenomena in Weichselian Late Pleniglacial deposits are interpreted as the result of melting of ice-rich permafrost (Vandenberghe, Reference Vandenberghe and Elias2006). Local permafrost conditions during the Younger Dryas have been reported in the Netherlands (Kasse, Reference Kasse, Troelstra, Van Hinte and Ganssen1995; Isarin, Reference Isarin1997). However, neither ice-wedge casts nor frost cracks were found in unit 3. Therefore, these local large-scale involutions are not interpreted as periglacial loadings, but they probably resulted from deposition of sand on a water-saturated surface leading to compaction, oversaturation, quick-sand formation and involution (Schwan, Reference Schwan1990; Kasse, Reference Kasse1999b).
The radiocarbon dates from the upper part of soil complex A (c.11.8–12.8 cal. BP) are in good agreement with OSL ages of 12.2 ± 0.7, 13.1 ± 0.9 and 11.5 ± 0.7 ka from the base of unit 3 obtained by Vandenberghe et al. (Reference Vandenberghe, Kasse, Hossain, De Corte, Van den haute, Fuchs and Murray2004) and with OSL ages between 10.0 ± 1.5 and 15.1 ± 3.9 ka from unit 3 by Fink (Reference Fink2000) (Fig. 9). All dates combined indicate that unit 3 was mainly deposited in the (second part of the) Younger Dryas period between c.12.3 and 11.7 ka. These results are in accordance with previous research in which the formation of the Younger Coversand II unit was placed in the (second half of the) Younger Dryas period (Bohncke et al., Reference Bohncke, Vandenberghe and Huijzer1993; Kasse et al., Reference Kasse, Vandenberghe, Bohncke and Frenzel1995, Reference Kasse, Tebbens, Tump, Deeben, Derese, De Grave and Vandenberghe2018; Isarin et al., Reference Isarin, Renssen and Koster1997; Derese et al., Reference Derese, Vandenberghe, Zwertvaegher, Court-Picon, Crombé, Verniers and Van den haute2010b, Reference Derese, Vandenberghe, Van Gils, Mees, Paulissen and Van den haute2012).
The Younger Coversand II at Ossendrecht is part of an extensive, 4–8 km wide, dune belt (Fig. 1: drift sand and river dunes). The south–north orientation of this dune belt is parallel to the former Late Glacial Scheldt valley that is present in the subsurface below the young Holocene polders (Kiden, Reference Kiden1995; Westerhoff & Dobma, Reference Westerhoff and Dobma1995; Vos and Van Heeringen Reference Vos and Van Heeringen1997). Sand was blown out of the Scheldt valley during the Younger Dryas stadial and therefore these dunes are interpreted as source-bordering river dunes on the right bank of the Scheldt. The relatively coarse grain size and high amount of grains larger than 500 µm (Fig. 5) indicate limited sorting due to a short transport distance of the fluvial source material. The parabolic dune forms indicate a west-southwesterly wind direction and trapping by vegetation. Despite the Younger Dryas cooling, vegetation cover did not disappear, although its composition changed (Fig. 7A). This is in accordance with reconstructions and climate modelling experiments for northwestern Europe (Isarin et al., Reference Isarin, Renssen and Koster1997). Similar dunes have been described on the east bank of the Maas valley (Bohncke et al., Reference Bohncke, Vandenberghe and Huijzer1993; Kasse, Reference Kasse, Troelstra, Van Hinte and Ganssen1995; Kasse et al., Reference Kasse, Vandenberghe, Bohncke and Frenzel1995; Hoek et al., Reference Hoek, Lammertsma, Bohncke, Bos, Bunnik, Kasse, Schokker and Westerhoff2017; Woolderink et al., Reference Woolderink, Kasse, Cohen, Hoek and Van Balen2019) and in the Rhine–Meuse fluvial area of the central and western Netherlands (Pons, Reference Pons1957; Hijma et al., Reference Hijma, Cohen, Hoffmann, Van der Spek and Stouthamer2009). Increased aeolian activity, particularly during the second phase of the Younger Dryas, has been ascribed to a delayed response to cooling, increased aridity and vegetation decline (Hoek, Reference Hoek1997; Isarin & Bohncke, Reference Isarin and Bohncke1999; Kasse, 1999a, Reference Kasse2002). A decline of the forest vegetation cover (Fig. 7A) and a change from meandering to braided rivers are held responsible for this new phase of aeolian deposition, which is therefore more regional than the supraregional extensive Older Coversand II / Younger Coversand I. East of the river dune belt, Younger Coversand II deposition did not occur and the Late Glacial Usselo Soil was probably incorporated later in the Holocene soil (Kasse, Reference Kasse2002; Kasse et al., Reference Kasse, Tebbens, Tump, Deeben, Derese, De Grave and Vandenberghe2018).
Early and Middle Holocene soil formation (podzol soil B)
River dune formation (unit 3, Younger Coversand II) does not seem to continue over the Younger Dryas to Holocene boundary (11.7 ka cal. BP), given the uncertainty of the OSL dates (Fig. 9). This suggests no or a limited time lag between the climate warming and aeolian activity. Aeolian transport stopped and the dunes were stabilised by rapid colonisation of the surface by nearby vegetation (herbs and birch) at the start of the Holocene (Hoek, Reference Hoek1997, Reference Hoek2001). Soil formation started during the early Holocene, and over time the humic-iron podzol soil B developed on the well-drained dunes and peat was formed in former dune depressions (Schwan, Reference Schwan1991).
The dominance of Corylus and Pinus in the lower part of the podzol soil B (Fig. 7B: zone 1: 23–25 cm) points to formation during the Boreal period (9000–8000 BP; 10.8–8.9 ka cal. BP) (Van Geel et al., Reference Van Geel, Bohncke and Dee1981). The high Ericaceae values indicate the early presence of heathlands, which is in accordance with recent findings for the central Netherlands (Sevink et al., Reference Sevink, Koster, Van Geel and Wallinga2013, Reference Sevink, Van Geel, Jansen and Wallinga2018). The continuous presence of Alnus, Quercus, Tilia, Ulmus in zone 2 (Fig. 7B: zone 2: 7–23 cm) is characteristic for the Quercetum Mixtum of the Atlantic period (8000–5000 BP; 8.9–5.8 ka cal. BP). The presence of Fraxinus indicates the second half of the Atlantic period (Van Geel et al., Reference Van Geel, Bohncke and Dee1981).
The radiocarbon dates of the peaty top of podzol soil B (4940 ± 50 and 4940 ± 60 BP (c.5.6–5.8 ka cal. BP; Table 1) indicate a late Atlantic to early Subboreal period which is in agreement with the biostratigraphic interpretation. The OSL dates of the underlying unit 3 and the radiocarbon dates of the top of podzol soil B show that soil B formed during a long period of landscape stability in the Early and Middle Holocene, between c.11.7 and 5.8 ka cal. BP (Fig. 9). Podzol soil B grades locally into a peat layer in former river dune depressions. The peat was dated between 9050 ± 45 and 3000 ± 30 BP (c.10.3–3.1 ka cal. BP) by Schwan (Reference Schwan1991), which indicates that the peat and podzol soil B formed simultaneously. Podzol soils of similar age were described by Sevink et al. (Reference Sevink, Koster, Van Geel and Wallinga2013: soils S1, S2, S3 combined) and Van Mourik et al. (Reference Van Mourik, Nierop and Vandenberghe2010). It shows that the onset of podzolisation and development of ericaceous vegetation occurred prior to the introduction of Neolithic farming, which is earlier than previously assumed (Louwe Kooijmans, Reference Louwe Kooijmans1995: 419) and in accordance with recent investigations (Sevink et al., Reference Sevink, Koster, Van Geel and Wallinga2013, Reference Sevink, Van Geel, Jansen and Wallinga2018; Doorenbosch and Van Mourik Reference Doorenbosch and Van Mourik2016; Sevink and Van Geel Reference Sevink and Van Geel2017). Mineralogical differences in parent material may be responsible for differences in the timing of the onset of acidification and podzolisation (Kluiving et al., Reference Kluiving, Bekkema and Roymans2015). Aeolian quartz-rich dune sands, as in the investigated site, were more susceptible to rapid acidification and podzolisation than loamy coversands and fluvial deposits in which the acidification took place at a later stage.
Middle Holocene drift-sand deposition (unit 4)
The areal distribution of unit 4 is limited over a short distance of c.100 m (Fig. 6A, D). Grain size and sedimentary bedding resemble unit 3 (Younger Coversand II) (Figs 5 and 9). However, unit 4 is interpreted as a local drift-sand deposit, as it is intercalated between two Holocene podzol soils B and C (Fig. 6D). The distinction between coversands and drift sands is based on climate and chronostratigraphy and refers to cold-climate Pleistocene and Holocene aeolian sands respectively (Koster, Reference Koster1982). Unit 4 was probably formed by local reworking of the underlying river dunes. The local occurrence of unit 4 was previously also established by Schwan (Reference Schwan1991, his Fig. 4). He recorded 450 m of quarry pit faces, and generally one Holocene podzol soil was observed. Only in a short 30 m section (165–194 m) were two podzols found.
Drift sand unit 4 overlies podzol soil B (4940 ± 50 and 4940 ± 60 BP; c.5.6–5.8 ka cal. BP; Table 1), possibly indicating Middle Holocene drift-sand deposition. However, indirect dating of sand units by radiocarbon dating of underlying soils may give unsatisfactory results (Van Mourik et al., Reference Van Mourik, Wartenbergh, Mook and Streurman1995, Reference Van Mourik, Nierop and Vandenberghe2010, Reference Van Mourik, Slotboom and Wallinga2011; Koster, Reference Koster2009; Wallinga et al., Reference Wallinga, Van Mourik and Schilder2013; Pierik et al., Reference Pierik, Van Lanen, Gouw-Bouman, Groenewoudt, Wallinga and Hoek2018). The organic material of soil B has accumulated over the Early and Middle Holocene periods, and resistant carbon fractions of the soil–forming period are still incorporated in the soil. Therefore, radiocarbon dating of buried soils gives a maximum age of the overlying sand deposit and does not necessarily represent the start of sand deposition (Vandenberghe et al., Reference Vandenberghe, Derese, Kasse and Van den haute2013; Pierik et al., Reference Pierik, Van Lanen, Gouw-Bouman, Groenewoudt, Wallinga and Hoek2018). To circumvent this problem the gradual peat-to-sand transition at the top of soil B, that reflects sand being trapped in the sedge vegetation, was sampled for radiocarbon dating.
The radiocarbon dates of the top of soil B are 4940 ± 50 and 4940 ± 60 BP (c.5.6–5.8 ka cal. BP). OSL dating of overlying unit 4 revealed a mean age of 5449 ± 797 (n = 3) (Fink, Reference Fink2000) (Fig. 9). The radiocarbon dates of the top of soil B and the OSL dates of unit 4 (c.5500 years) are therefore in good agreement. This indicates that radiocarbon dates from the top of peaty soils can be used to reliably date the onset of overlying sand deposition (unit 4). The three OSL dates of unit 4 have overlapping ages, which indicates a short phase of drift-sand deposition at c.5500 cal. BP at the Atlantic to Subboreal transition during the Middle Neolithic (Fig. 9). A similar drift-sand phase was reported by Zonneveld (Reference Zonneveld1965) from the nearby Kalmthoutse Heide, c.4 km east of the Boudewijn pit, which was dated later than 5300 ± 90 BP. The cause for the first drift-sand phase (unit 4) at c.5500 cal. BP is not clear. The vegetation reconstruction of the underlying podzol soil B shows the presence of heathlands (Ericaceae) and an increase of grasses and sedges indicating a local decrease of the forest cover and opening of the vegetation, possibly by local forest clearing (Fig. 7B). Dryland herbs like Artemisia, Chenopodicaceae, Asteraceae and Brassicaceae can indicate agricultural activity (Bos & Zuidhoff, Reference Bos and Zuidhoff2015: 51). However, Cerealia pollen, indicative for arable land, has not been found. The pollen assemblage of soil B and the first drift-sand deposition might reflect the impact of early agriculture on the vegetation in the region during the Neolithic. However, it was stated that the impact of farming on the vegetation and on the landscape was still limited or local during the Late Neolithic (Louwe Kooijmans, Reference Louwe Kooijmans1995: 419: Bos & Zuidhoff, Reference Bos and Zuidhoff2015: 49; Broothaerts et al., Reference Broothaerts, Verstraeten, Kasse, Bohncke, Notebaert and Vandenberghe2015; Van Beek et al., Reference Van Beek, Gouw-Bouman and Bos2015) while it increased during the Bronze Age. Neolithic occupation and a first increase in Cerealia pollen is reported in the Maas valley in the southeastern Netherlands from c.6400 cal. BP (4365 BC; Bos & Zuidhoff, Reference Bos and Zuidhoff2015). According to Sevink et al. (Reference Sevink, Koster, Van Geel and Wallinga2013: 260) the major drift-sand phase D-3 around 5000 cal. BP in the central Netherlands coincides with the first intensive land use in this region, suggesting a causal relation between this early agricultural phase, land degradation and sand-drifting.
Middle Holocene drift-sand phases have been reported from the Netherlands and Germany (Van Mourik et al., Reference Van Mourik, Wartenbergh, Mook and Streurman1995, Reference Van Mourik, Nierop and Vandenberghe2010, Reference Van Mourik, Seijmonsbergen, Slotboom and Wallinga2012; Tolksdorf & Kaiser, Reference Tolksdorf and Kaiser2012; Sevink et al., Reference Sevink, Koster, Van Geel and Wallinga2013, Reference Sevink, Van Geel, Jansen and Wallinga2018; Koster, Reference Koster2017; Pierik et al., Reference Pierik, Van Lanen, Gouw-Bouman, Groenewoudt, Wallinga and Hoek2018). The causes for these earlier Meso- and Neolithic drift-sand phases, whether by climate change (cooling, aridity, storminess), human activity (burning of vegetation, agriculture, overgrazing) or natural soil degradation, is still debated (Jungerius & Riksen, Reference Jungerius and Riksen2010; Tolksdorf & Kaiser, Reference Tolksdorf and Kaiser2012; Sevink et al., Reference Sevink, Koster, Van Geel and Wallinga2013, Reference Sevink, Van Geel, Jansen and Wallinga2018; Kluiving et al., Reference Kluiving, Bekkema and Roymans2015; Pierik et al., Reference Pierik, Van Lanen, Gouw-Bouman, Groenewoudt, Wallinga and Hoek2018).
Holocene climatic oscillations were probably not strong enough to cause landscape degradation and to initiate sand-drift formation. Although the vegetation composition changed (Hoek & Bos, Reference Hoek and Bos2007), the protective vegetation cover persisted, hampering the initiation of deflation and drift-sand formation. On the other hand, the impact of man on the landscape increased from the Neolithic period onwards. Our results confirm that deforestation and soil cultivation may have led to local barren surfaces prone to local sand drifting in the Neolithic.
The occurrence of drift-sand phases need not be time-equivalent in the Netherlands. Temporally and spatially different responses may have occurred to the same forcing depending on the carrying capacity and resilience of the landscape. Differences in parent material such as mineralogy and loam content resulted in differences in vegetation and soil formation (Kluiving et al., Reference Kluiving, Bekkema and Roymans2015). On quartz-rich parent materials with poorly buffered soils, the vegetation had a lower regenerative capacity following human impact, and the surface was more susceptible to deflation and drift-sand formation than on the richer soils. First small-scale sand drifts seem to have occurred on nutrient-poor, depleted coversands and river dunes (Willemse & Groenewoudt, Reference Willemse, Groenewoudt, Bebermeier, Hebenstreit, Kaiser and Krause2012; Sevink et al., Reference Sevink, Koster, Van Geel and Wallinga2013, Reference Sevink, Van Geel, Jansen and Wallinga2018) similar to the investigated site Boudewijn in western Noord Brabant. The same forcing (e.g. small-scale slash-and-burn agriculture) may therefore have resulted in a site-specific environmental response and a different threshold towards deflation.
Middle and Late Holocene soil formation (podzol soil C)
Podzol soil C developed in the upper part of unit 4 and is therefore younger than c.5500 years. The presence of Jasione at the base of pollen zone 1 indicates dry open sandy soil, following the deposition of unit 4 (Fig. 7C). The presence of Alnus, Corylus, Quercus, Tilia and Ulmus and absence of Fagus and Carpinus in zone 1 indicate a late Atlantic or early Subboreal age (c.5.8–4.0 ka) (Janssen, Reference Janssen1974; Bos & Zuidhoff, Reference Bos and Zuidhoff2015). The decline of Ulmus in the top of zone 1 possibly indicates the start of the Subboreal. The presence of high Ericaceae values and dryland herbs like Chenopodicaceae, Asteraceae and Brassicaceae may indicate agricultural activity; however, Cerealia pollen has not been found in zone 1. Pollen zone 1 of soil C (Fig. 7C) resembles zone 2 of the underlying podzol soil B (Fig. 7B). Since unit 4 has been deposited in a short period around 5500 years ago, it is very likely that the two pollen zones are closely connected in time. This means that little time is present in clastic unit 4 (high sedimentation rate), while most of the time is represented by soil formation (soils B and C).
The presence of Fagus and Carpinus in zone 2 of soil C (Fig. 7C) indicates a late Subatlantic age (younger than c.2000 cal. BP) (Janssen, Reference Janssen1974; Bos & Zuidhoff, Reference Bos and Zuidhoff2015). The low values of Alnus, Betula, Corylus, Quercus and Ulmus in combination with high Ericaceae values point to deforestation and heathland development. The presence of Cerealia type is an indication for agriculture, and weeds related to agriculture (Chenopodicaceae, Asteraceae, Brassicaceae, Rumex and Plantago) are present in the pollen diagram. The occurrence of Centaurea type is generally associated with the Middle Ages and is found from the 10th to 11th century AD onwards (Bakels, Reference Bakels2012; Bos & Zuidhoff, Reference Bos and Zuidhoff2015: 30; Sevink and Van Geel Reference Sevink and Van Geel2017: 285).
The radiocarbon dates from the peaty top of podzol soil C of 1000 ± 30 and 890 ± 30 BP (c.1000–800 cal. BP) (Table 1) indicate that the final stage of soil formation occurred during the Middle Ages or later. This age, in close agreement with the pollen analytical results presented above, shows that radiocarbon dates from the peaty top of a soil can be reliable.
Based on the OSL dates of the underlying drift sand unit 4 (c.5500 years) in combination with the radiocarbon dates and vegetation reconstruction of soil C, it is concluded that podzol soil formation (soil C) covered a 4500 year period from c.5500 to 1000 cal. BP (Fig. 9).
Late Holocene drift-sand deposition (unit 5)
Unit 5 is a widespread drift-sand unit observed in all pit faces (Fig. 3). The grain-size characteristics resemble units 3 and 4, and the coarsest intervals are observed in the top of the unit (Figs 5 and 9). The coarsening-upward trend in combination with a change from wet to dry aeolian bedding types reflects a drying-upward sequence similar to unit 3 (Fig. 8) (Schwan, Reference Schwan1991: 161). Initial planation of older dunes, erosion of the podzol soil and filling of dune depressions under wet conditions was followed by dry-aeolian dune formation (Figs 3C, 6C). The finer grain size and faint humic laminations at the wet-to-dry transition may represent a short stand-still phase in the sedimentation and associated initial soil formation (cf. Schwan, Reference Schwan1991: hydromorphic soils in Kootwijk Formation).
Decimetre-scale involutions especially at the transition from the wet to dry aeolian deposits are attributed to the deposition of dry sand on a water-saturated surface leading to a reversed density gradient, oversaturation and load casting (Figs 4G and 8B). Successive involuted levels indicate successive phases of deposition, groundwater table rise and load casting (Schwan, Reference Schwan1991: 165).
Unit 5 overlies podzol soil C. The pollen assemblage of the upper part of soil C (Fig. 7C) demonstrates that unit 5 was formed during or following the Middle Ages (Bos & Zuidhoff, Reference Bos and Zuidhoff2015: 30). The presence of the weakly developed present-day soil indicates that deposition continued until recently. Many active drift sand areas in western Noord Brabant were reforested from the end of the 19th century onwards (Zonneveld, Reference Zonneveld1965). The radiocarbon dates from the top of the underlying podzol soil C (1000–800 cal. BP) are in good agreement with the OSL dates of unit 5 ranging between 0.9 and 0.3 ka (Fink, Reference Fink2000) (Fig. 9). The dates indicate no or limited time lag between the end of soil formation and the start of aeolian deposition. Radiocarbon dating of soils can give good results provided that the top of wet–type peaty soils is sampled. A reliable chronology of aeolian deposition can be established based on both radiocarbon dating and pollen analysis of soils in combination with luminescence dating of sand units.
Medieval to recent drift-sand phases have been reported previously from the nearby Kalmthoutse Heide, c.4 km east of the Boudewijn pit (Zonneveld, Reference Zonneveld1965: drift sand later than 1310 ± 60 BP), from eastern Noord Brabant (Van Mourik et al., Reference Van Mourik, Nierop and Vandenberghe2010; Kasse et al., Reference Kasse, Tebbens, Tump, Deeben, Derese, De Grave and Vandenberghe2018) and from adjacent Belgium (Beerten et al., Reference Beerten, Vandersmissen, Deforce and Vandenberghe2014). Extensive drift-sand formation in the Netherlands and northwestern Europe occurred especially from the late Middle Ages onwards (c.1100 cal. BP) (Castel et al., Reference Castel, Koster and Slotboom1989; Koster et al., Reference Koster, Castel, Nap and Pye1993; Koster, Reference Koster2009, Reference Koster, Fanta and Siepel2010; Vandenberghe et al., Reference Vandenberghe, Derese, Kasse and Van den haute2013; Pierik et al., Reference Pierik, Van Lanen, Gouw-Bouman, Groenewoudt, Wallinga and Hoek2018: Fig. 11).
This young drift-sand phase is generally ascribed to human occupation. Deforestation and expansion of agriculture, grazing and burning practices, formation of roads and cattle/sheep drifts, and the use of plaggen as fertiliser led to the remobilisation of the Late Weichselian aeolian sands (Koster, Reference Koster2009: 100; Pierik et al., Reference Pierik, Van Lanen, Gouw-Bouman, Groenewoudt, Wallinga and Hoek2018). The palynological indications for deforestation and agriculture in the upper part of podzol C support this view (Fig. 7C). A climatic cause for drift-sand formation, as has been suggested previously (Heidinga, Reference Heidinga1984, Reference Heidinga, Fanta and Siepel2010; Jungerius & Riksen, Reference Jungerius and Riksen2010), cannot be confirmed, although drift-sand expansion may have intensified during the Little Ice Age as stated by Pierik et al. (Reference Pierik, Van Lanen, Gouw-Bouman, Groenewoudt, Wallinga and Hoek2018).
Conclusions
A stacked sequence of Late Weichselian and Holocene aeolian sediments and soils in the southern Netherlands reveals autogenic changes in the sedimentary sequence and the allogenic impact of climate and man. Coarsening and drying-upward trends are caused by system-intrinsic changes in topography and drainage conditions related to the accumulation of wind-blown sand and dune migration. Aeolian deposition changed over time from supraregional (Older Coversand II and Younger Coversand I) to regional (river dunes / Younger Coversand II) to local (Drift Sand phases).
Climate-controlled sand accumulation (Older Coversand II and Younger Coversand I) occurred during the Late Pleniglacial and early Late Glacial. A soil complex formed during the Allerød (Usselo Soil) and early Younger Dryas. Vegetation cover strongly changed (decline of pine, increase of herbs) at the Allerød – Younger Dryas transition, but the aeolian response was limited. Younger Coversand II deposition occurred during the second part of the Younger Dryas stadial (c.12.3–11.7 ka cal. BP), implying a delayed response to the Younger Dryas cooling. Source-bordering parabolic river dunes formed along the Scheldt valley by southwesterly winds. Aeolian deposition stopped around the Younger Dryas to Holocene transition, implying a limited time lag to the climate change and rapid vegetation response.
Early podzolisation and heathland formation occurred in the Early and Middle Holocene, between c.11.7 and 5.8 ka cal. BP, prior to the introduction of Neolithic farming, as a consequence of natural or anthropogenic soil degradation. In the Middle and Late Holocene a second podzol soil formed between c.5500 and 1000 cal. BP. In line with earlier studies in the Netherlands and adjacent Belgium, we find a small-scale drift-sand phase around 5500 years ago, possibly related to agricultural activity and a more extensive (post-)Medieval drift-sand phase after 1000 cal. BP caused by deforestation and agriculture.
Climate was the dominant forcing factor during the Late Weichselian, while forcing by man increased and became dominant during the Holocene. The study shows a good correspondence and limited hiatuses between the radiocarbon-dated top of peaty soils and luminescence ages of overlying sand units. A multi-proxy approach based on sediment characteristics, pollen analysis and independent dating control enables robust landscape reconstructions.
Acknowledgements
Hessel Woolderink is thanked for his great help with the figures. John van der Woude constructed the pollen diagrams. The reviews by Harm Jan Pierik and an anonymous reviewer greatly improved the manuscript.


 Open access