


Advances in Fontan surgery in recent years have increased life expectancy and quality of life in patients with single ventricular physiology. Consequently, a greater number of individuals with Fontan circulation reach adolescence and adulthood. However, because of the haemodynamic features of the Fontan circulation, such as high central venous pressure, passive pulmonary blood flow, and low cardiac output, patients experience heart failure, arrhythmias, protein-losing enteropathy, thromboembolism, plastic bronchitis, and Fontan-related liver disease during long-term follow-up.Reference Gewillig and Brown1–Reference Rychik, Atz and Celermajer5 Therefore, the early detection of these problems may have a positive impact on the quality of life and life expectancy of patients.
Despite the increasing knowledge about the risk factors that increase mortality and morbidity, there is no consensus on how and how often these patients will be followed up because of the scarcity of evidence-based supportive findings. Therefore, follow-up should be planned appropriately based on the presence of cardiac and end-organ problems. Since conventional echocardiography, for example, M-mode measurement, use of the Simpson method or modified Simpson method to measure systemic ventricular function, and valve deficiencies, alone is insufficient to predict survival and quality of life in the long-term follow-up of patients, using tissue Doppler imaging, natriuretic peptide levels, exercise tests, MRI, and cardiac catheterisation is recommended.Reference Rychik, Atz and Celermajer5,Reference Di Maria, Goldberg and Zak6
Although these methods have been used to evaluate the functional and clinical status of Fontan patients, they have not been compared in Fontan patients. Therefore, in this study, we analysed the association between serum N-terminal pro-brain natriuretic peptide levels, conventional echocardiography, exercise parameters, and dyssynchrony measurement in patients who underwent Fontan surgery.
Materials and methods
This retrospective cohort study included 28 patients who underwent Fontan surgery and 27 healthy children evaluated in our paediatric cardiology outpatient clinic for heart murmurs or chest pain without cardiac pathology. The anatomical diagnoses of the Fontan group are shown in Fig 1. In 23 (82%) patients, the structure of the systemic ventricle was the left ventricle. Fontan surgery was performed in 27 patients with a lateral tunnel (in five patients with fenestration of the lateral tunnel) and in one patient with an extracardiac conduit. Fenestration was closed during follow-up, except in one of the five patients who could not attend regular follow-up. The resting saturation of this patient was 89%.
Patients with neuropsychomotor disorders, implanted pacemakers, and those who could not use a bicycle were excluded from the study. This study was conducted in accordance with the ethical principles of the Declaration of Helsinki. Informed consent was obtained from all patients, and the local institutional ethics committee approved the study protocol (KA09/28).
Demographic characteristics, such as age, sex, weight, height, body mass index, and body surface area (according to the Haycock formula), Reference Neyzi, Bundak and Gökçay7 were recorded (see Table 1). The height and body weight of the participants were evaluated using standard percentile tables for Turkish children. Reference Haycock, Schwartz and Wisotsky8 In the Fontan group, the median age at surgery was 5.35 years (range: 1.9–14 years), and the median post-operative follow-up time was 5.75 years (range: 1.8–14.8 years). Patients’ palpitations, fatigability, chest pain, and physical performance were recorded, and their physical performance was graded according to the NYHA functional classification. Almost half of the Fontan group (46%) complained of palpitations and/or fatigue. The remaining patients had no relevant complaints. All the patients were taking medications (see Table 2).
Table 1. Demographic features and echocardiography measurements of Fontan and healthy groups (data are expressed in mean±standard deviation, *significant p values)
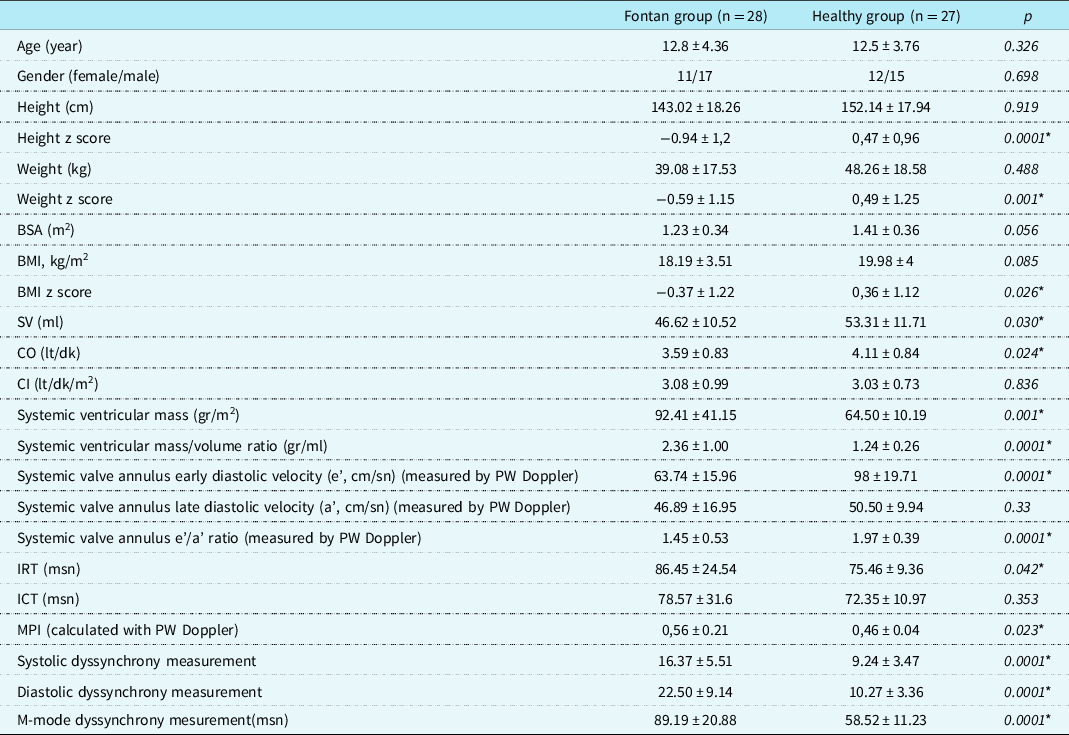
BMI = body mass index; BSA = body surface area; CI = cardiac index; CO = cardiac output; ICT = isovolumic contraction time; IRT = isovolumic relaxation time; MPI = myocardial performance index; PW = pulse wave; SV = stroke volüme.
Table 2. Medications taken by fontan patients
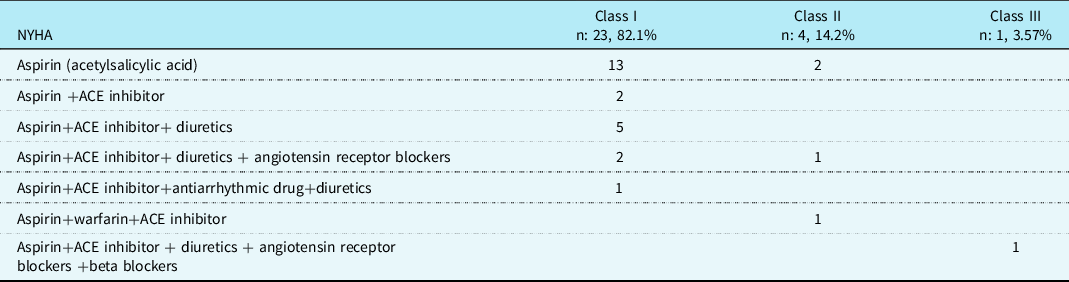
ACE = angiotensin-converting enzyme.
Echocardiography Study: Two-dimensional, colour Doppler, continuous-wave Doppler, and pulse-wave Doppler examinations of the cases were performed using the “Acuson Sequoia C 256 (Acuson Siemens, MountainView, California)” device with a 3-MHz probe. Cardiac index, cardiac output, and stroke volume were calculated using formulas. Reference Oh, Seward and Tajik9,Reference Yu, Fung, Lin, Zhang, Sanderson and Lau10 The device “SONOS 7500 (Phillips, Andover, Mass)” with a 3-MHz probe was used for synchrony measurement. Systemic ventricle mass was calculated on the software installed on the device of the ECHO. Transsystemic valve flow was measured via pulse-wave Doppler echocardiography. We measured early diastolic (systemic valve e’) and late diastolic (systemic valve a’) peak velocities. Left ventricular ejection fraction was estimated using Simpson’s method. We used the modified Simpson’s method to assess the right ventricular ejection fraction. The myocardial velocities during systole, early diastole, and late diastole were recorded at a speed of 100 mm/sec. The isovolumic contraction time (ICT) was defined as the period between the end of the late diastolic wave and the beginning of the systolic wave. The isovolumic relaxation time (IRT) was defined as the period between the end of the systolic wave and the beginning of the early diastolic wave. The myocardial performance index (MPI) was calculated according to the following equation: MPI = (ICT + IRT)/ET. The data were stored on videotapes of the video home system (VHS) to ensure playback and analysis later on. The mean values were recorded by averaging the results of three consecutive measurements. Synchronisation measurements were obtained by imaging myocardial velocity in the basal and mid-segmental regions of the systemic ventricle in the apical four-chamber, apical two-chamber, and apical long-axis positions. The sample volume was placed in the basal and mid-segmental regions in these three images. We measured the duration (Ts) between the onset of the QRS complex and the location at which the peak systolic velocity was obtained. The standard deviation of the time between the peak systolic velocities of 12 segments measured from 6 basal and 6 mid-segmental regions was taken. The results were evaluated using the Yu index (>33 ms = dyssynchrony). Diastolic duration was calculated by measuring the time from the onset of QRS to the peak of the first early diastolic wave of myocardium (Em, ms). Reference Quanjer, Tammeling and Cotes11 In addition, the difference between the peak contraction times of the septal and posterior walls at the onset of QRS was calculated using the M-mode technique. Respiratory Function Test: The respiratory function test was performed on all subjects prior to the exercise test using a clinical spirometer (Sensor Medics Vmax spectra 229, Bilthoven, the Netherlands). A maximal expiratory flow manoeuvre was performed on each subject while seated. A forced expired volume in 1 s, the forced expired volume in 1 s %, forced vital capacity, a forced expired volume in 1 s/forced vital capacity, predictive forced expired volume in 1 s, and maximum voluntary ventilation parameters were measured. At least three repeatable tests were performed for each measurement, and the best results were recorded. Reference Wasserman, Hansen, Sue, Casaburi and Whipp12
Cardiopulmonary Exercise Test: The cardiopulmonary exercise test was performed using a bicycle ergometer (Ergo-metrics 900, Sensor Medics) and facemask (Rudolph Face Mask 7930 Series for exercise testing; Hans Rudolph Inc., Kansas City, Missouri, United States of America). A facemask with a unidirectional low-resistance valve was placed on the patient’s face and checked for leakage. All patients were in stable physical condition and had no concomitant diseases. The incremental exercise test included a 3-min rest period followed by a 3-min warm-up period (the pedalling rate was maintained at 60 r.p.m.) and a periodic increase in work output of 10–20 W per minute, depending on the patient’s tolerance and maximum target heart rate. The test was terminated when the maximum heart rate was reached or when fatigue, leg pain, chest pain, or shortness of breath occurred. Findings were automatically recorded during exercise (Desktop Diagnostics/CPX; Medical Graphics Corporation, St Paul, Michigan, United States of America). Electrocardiogram, arterial blood pressure, and oxygen saturation of each patient were monitored during the test. Oxygen uptake, carbon dioxide production, heart rate, minute ventilation, and ventilatory equivalent during the anaerobic threshold were recorded. The ventilatory anaerobic threshold was determined using the two-slope method. Reference Cordina, Ministeri and Babu-Narayan13 Respiratory reserve, chronotropic index, peak oxygen pulse, and peak VO2 were calculated according to patient age. Reference Quanjer, Tammeling and Cotes11,Reference Wasserman, Hansen, Sue, Casaburi and Whipp12 Oxygen uptake and carbon dioxide production values were indexed according to the body surface area.
N-terminal pro-brain natriuretic peptide Test: The serum N-terminal pro-brain natriuretic peptide levels were measured via enzyme-linked immunosorbent assay using an Elecsys autoanalyzer (Roche Diagnostics).
Statistics: The statistical program SPSS-26.0, version for Windows, was used for statistical analysis. When comparing the control and patient groups, the chi-squared test was used for categorical data, the Student’s t-test was used for data with normally distributed characteristics, and the Mann–Whitney U-test was used for data without normally distributed characteristics. In the patient group, the correlation between the indices, pro-brain natriuretic protein levels, and other continuous variables was assessed using Pearson’s and Spearman’s rank correlation tests. Frequency and percentage (%) are given as descriptive values for categorical variables and mean ± standard deviation for continuous data. Statistical significance was set at p < 0.05.
Results
The demographic and echocardiography measurements characteristics of the study population are shown in Table 1. There were no significant differences between the groups according to age or sex (p > 0.05). The height, weight, and body mass index z-scores of the Fontan group were significantly lower than those of the control group (p < 0.05). The systemic ventricle was the left ventricle, except in 5 of the 28 patients (82%) in the Fontan group. None of the patients had severe valvular regurgitation in the systemic ventricle. Systemic ventricular functions were within normal limits in all except 2 of the 28 patients (Simpson ejection fraction: 50.2% and 49.4%, respectively). When comparing the patients and the healthy group, systemic ventricular mass and mass-to-volume ratio were significantly higher in the Fontan group; cardiac output, stroke volume, systemic valve annulus early diastolic velocity (e’), and early diastolic velocity/late diastolic velocity (a’) ratio were significantly lower; IRT was longer; and MPI was higher (p < 0.05). Dyssynchrony measurements from the M-mode and tissue Doppler studies were significantly higher in the Fontan group than in the healthy group (p < 0.05). A positive correlation was demonstrated between the mass/volume ratio and systolic dyssynchrony measurement, diastolic dyssynchrony measurement, and M-mode dyssynchrony measurement (p = 0.002, r = 0.42; p = 0.002, r = 0.42; and p = 05.0001, r = 0.49, respectively).
The forced vital capacity, forced expired volume in 1 s, and maximum voluntary ventilation were lower in the Fontan group than in the healthy group. In addition, the maximal workload and anaerobic threshold, peak heart rate, chronotropic index, maximum oxygen uptake, and maximum carbon dioxide production in the exercise test were lower in the Fontan group than in the healthy group (p < 0.05) (Table 3). A negative correlation was observed between serum N-terminal pro-brain natriuretic peptide levels and forced vital capacity, forced vital capacity %, forced expired volume in 1 s, forced expired volume in 1 s %, and the chronotropic index (p = 0.023, r = −0.32; p = 0.001, r = −0.45; p = 0.026, r = −0.32; p = 0.001, r = −0.46; and p = 0.0001, r = −0.63).
Table 3. Respiratory function test and exercise test results of the Fontan and healthy groups (data are expressed in mean±standard deviation, * significant p values)
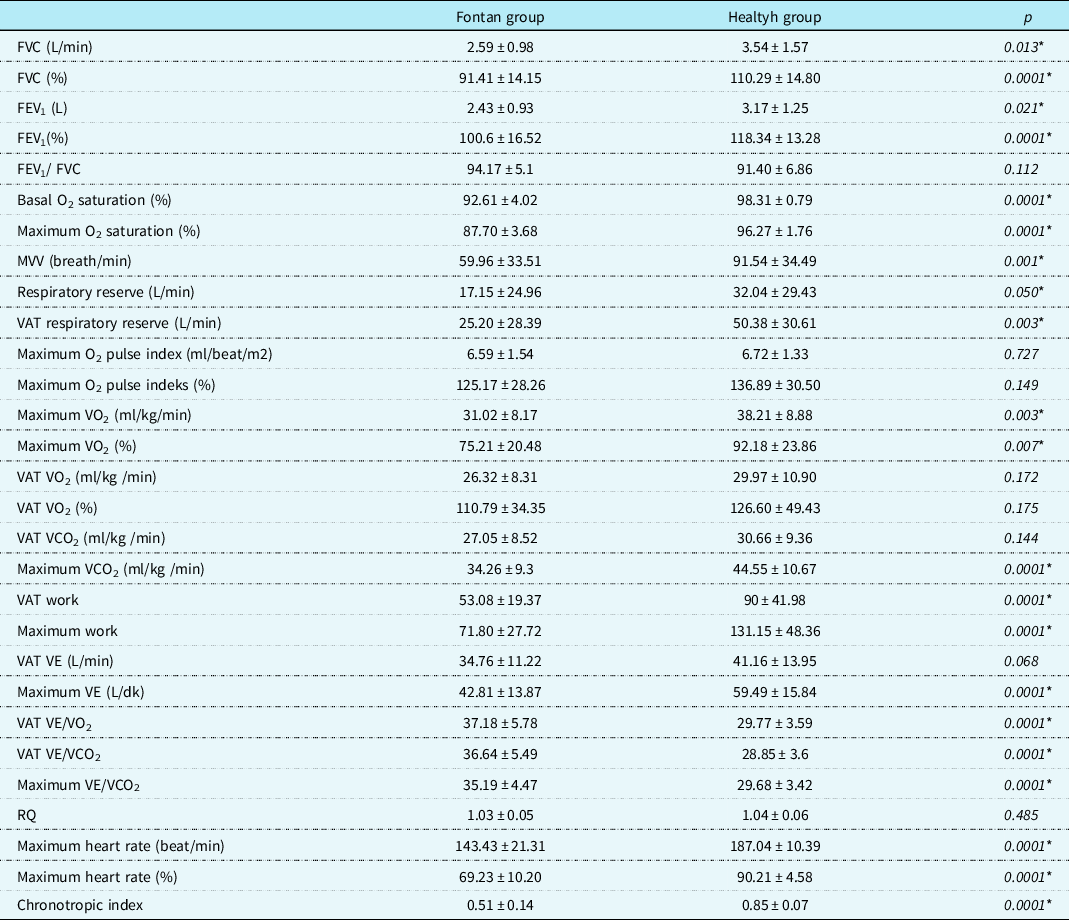
CO2 = carbon dioxide; FEV1 = forced expiratory volume in 1 s; FVC = functional vital capacity; MVV = maximal voluntary ventilation; O2 = oxygen; VAT = ventilatory anaerobic threshold; VE = minute ventilation; VCO2 = carbon dioxide production; VE/VCO2 = ventilatory equivalents for carbon dioxide; RQ = respiratory exchange ratio; VE/VO2 = ventilatory equivalents for oxygen; VO2 = oxygen uptake.
There was a negative correlation between post-operative follow-up time and maximum oxygen uptake, maximum oxygen %, and maximum carbon dioxide production in the Fontan group (p = 0.024, r = −0.43; p = 0.028, r = −0.42; and p = 0.008, r = −0.49, respectively). Moreover, a negative correlation was found between the chronotropic index and systolic and diastolic dyssynchrony measurements (p = 0.0001, r = −0.59; p = 0.0001, r = −0.56, respectively). However, a positive correlation was observed between systolic dyssynchrony measurement and ventilatory equivalents for carbon dioxide during ventilatory anaerobic threshold, ventilatory equivalents for oxygen during ventilatory anaerobic threshold, and maximum ventilatory equivalents for carbon dioxide (p = 0.003, r = 0.41; p = 0.013, r = 0.34; and p = 0.009, r = 0.36). A similar result was observed for the relationship between diastolic dyssynchrony measurement and ventilatory equivalents for carbon dioxide during ventilatory anaerobic threshold ventilatory equivalents for oxygen during ventilatory anaerobic threshold and maximum ventilatory equivalents for carbon dioxide (p = 0.002 r = 0.42; p = 0.011, r = 0.36; and p = 0.006, r = 0.38, respectively).
Serum N-terminal pro-brain natriuretic peptide levels were significantly higher in the Fontan group than in the healthy group (258.94 ± 224.74 pg/ml and 60.51 ± 38.79 pg/ml, respectively) (p = 0.0001). A negative correlation was found between serum N-terminal pro-brain natriuretic peptide levels and mass/volume ratio (p = 0.001, r = 0.46), stroke volume (p = 0.041, r = −0.28), and cardiac output (p = 0.023, r = −0.31), respectively. A positive correlation was observed between serum N-terminal pro-brain natriuretic peptide levels and systolic dyssynchrony measurement, diastolic dyssynchrony measurement, and M-mode systolic dyssynchrony mesurement (p = 0.001, r = 0.44; p = 0.007, r = 0.37; and p = 0.0001, r = 0.62, respectively).
Discussion
Progressive ventricular dysfunction after a Fontan procedure remains a major problem. Unfortunately, because of the differences in post-operative ventricular geometry, it is difficult to assess systemic ventricular function using conventional echocardiographic methods. Echocardiographic measurements, for example, M-mode measurement, use of the Simpson method or modified Simpson method to measure systemic ventricular function, and valve deficiencies, alone do not provide sufficient information about the patient’s clinical status. In recent years, advanced echocardiographic techniques, exercise testing, MRI, and natriuretic peptides have been used to monitor Fontan patients. However, there is still no consensus regarding the follow-up of these patients. Reference Di Maria, Goldberg and Zak6 Although each diagnostic modality provides sufficient information about the systemic ventricle and quality of life, no gold standard exists for a monitoring tool.
Our echocardiographic examination results agree with those of previous studies in the Fontan group. Reference Gewillig and Brown1,Reference Rychik, Atz and Celermajer5,Reference Di Maria, Goldberg and Zak6 Stroke volume and cardiac output were lower in the Fontan group than in the control group, and the cardiac index was similar in both groups. As it is well known, the main characteristic of the Fontan circulation is the absence of a subpulmonary ventricle, which is the subpulmonary energy source responsible for pumping blood to the lungs. Over time, this leads to an increase in the central venous pressure and a decrease in the preload. This situation decreases the return of blood from the pulmonary bed to the heart in the Fontan group compared with healthy individuals, resulting in a decrease in cardiac output. Reference Gewillig and Brown1
There were also significant differences in the duration and measurement of dyssynchrony between the Fontan and healthy groups. In the Fontan group, systemic ventricular function was within normal limits, except in two patients. There were no clinical findings of increased fatigue or decreased performance in the Fontan group. Although the systolic function of the Fontan group was normal, the duration of dyssynchrony was longer than that of the control group, suggesting the presence of a regional contraction and relaxation disorder. Ventricular synchrony disorder is the contraction of ventricular segments at different times due to uncoordinated electrical activity of the heart. Asynchrony between ventricular contraction and relaxation leads to dynamic changes in ventricular pressure and volume over the cardiac output. Reference Cordina, Ministeri and Babu-Narayan13,Reference Penny and Redington14 In our study, despite the long duration of dyssynchrony in the Fontan group, there were no significant effects on physical performance or abnormal clinical findings. Consequently, there was no significant relationship between dyssynchrony and physical performance.
The cardiopulmonary exercise test is widely used to evaluate the post-operative functional status and cardiac reserve in patients with CHD. In the Fontan circulation, lower stroke volume and cardiac output, disruption of the cardiac autonomic nervous system activity, excess neurohormonal factors, and endothelial dysfunction result in an abnormal cardiopulmonary response to exercise. The exercise capacity, maximum oxygen uptake, cardiac output, maximum heart rate, stroke volume, ventilatory anaerobic threshold, and maximum aerobic capacity of Fontan patients were lower than healthy individuals. Reference Goldberg, Zak and McCrindle15 Similar results were found in the present study. The maximum oxygen uptake, maximum heart rate, maximum work, ventilatory anaerobic threshold, chronotropic index, and maximum aerobic capacity were lower in the Fontan group than in the healthy group because of the unique physiology of this operation. Although physical performance increased in these patients compared with what it was in the pre-operative period, it was found to be lower than that in normal individuals. Reference Takken, Hulzebos, Blank, Tacken, Helders and Strengers16 Maximal oxygen uptake, an objective indicator of aerobic capacity, was significantly lower in Fontan patients than in healthy subjects. The maximum oxygen uptake strongly depends on the cardiac reserve and increases with cardiac output. Because these patients lack a subpulmonary ventricle, their ability to increase cardiac output during exercise is limited. In addition, the lack of body muscle mass, lower muscle blood flow, and lower oxygen utilisation of the muscle are factors that explain the lower maximum oxygen uptake and the lower maximum carbon dioxide production. Reference Martin Talavera, Manso, Cejudo Ramos, Rodriguez Puras, Wals Rodriguez and Garcia de Vinuesa17,Reference Mertens, Reybrouck, Eyskens, Daenen and Gewillig18 Chronotropic insufficiency is an important problem in patients with Fontan disease. Owing to the positive correlation between maximum oxygen uptake and the chronotropic index, exercise capacity is reduced in Fontan patients, and the risk of death increases. Reference Martin Talavera, Manso, Cejudo Ramos, Rodriguez Puras, Wals Rodriguez and Garcia de Vinuesa17,Reference Diller, Dimopoulos and Okonko19 It was reported that the Fontan group had lower maximum aerobic capacity and better submaximal performance than the healthy group, patients with high oxygen pulse showed better physical performance, and physical performance was lower in the male and adolescent groups. Reference Goldberg, Zak and McCrindle15,Reference Paridon, Mitchell and Colan20 In contrast to previous studies, our study emphasised that oxygen pulse further influenced the maximum aerobic performance. Although the maximum oxygen pulse was lower in Fontan patients than that in the healthy group, no statistically significant difference was found between the two groups. In our study, we also found a positive correlation between the chronotropic index and maximum oxygen uptake, basal oxygen saturation %, stroke volume, and cardiac output, and negative correlations with myocardial performance index, systolic dyssynchrony measurement calculated by pulse Doppler, diastolic dyssynchrony measurement, and M-mode synchrony measurement. However, the mechanisms leading to a low chronotropic index are not fully understood. Many factors, such as impairment of parasympathetic modulation and dysfunction of the sinus node (either congenital or due to damage resulting from multiple surgeries), are responsible for this condition. Reference Mahle, Wernovsky, Bridges, Linton and Paridon21,Reference Colucci, Ribeiro and Rocco22 We found that the maximum anaerobic threshold was higher in our patients than in the healthy group. An elevated anaerobic threshold indicates increased hyperventilation and/or dead space ventilation. Normally, alveolar and arterial oxygen differences increase with exercise. The alveolar dead space decreased, particularly in the upper lobes of the lungs. Because venous flow is not pulsatile owing to the absence of a subpulmonary ventricle in the Fontan circulation, gas exchange in the lungs cannot occur the way it does in a normal healthy individual. In healthy individuals, pulmonary blood flow decreases from the upper lobe to the lower lobe. In Fontan patients, blood flow to the upper lobes of the lungs has been shown to be greater than that in healthy people. This type of circulation increases the ventilation–perfusion mismatch, which increases the physiologic dead space. This leads to an increase in anaerobic threshold. The ventilation–perfusion mismatch and the increase in physiological dead space also contribute to the increase in intrapulmonary shunts over time. In our study, the forced vital capacity, forced expired volume in 1 s, respiratory reserve, and maximum voluntary ventilation were significantly lower in the Fontan group than in the healthy group. Factors leading to this result include surgically induced chest deformities, absence of subpulmonary ventricle, alteration of endothelial structure due to non-pulsatile flow, and injury to the lung parenchyma. Reference Mahle, Wernovsky, Bridges, Linton and Paridon21,Reference Ohuchi, Negishi and Noritake23
Serum N-terminal pro-brain natriuretic peptide levels are commonly used to determine the severity of heart failure after Fontan surgery. Reference Van den Bosch, Bossers and Kamphuis24 In our study, the value of serum N-terminal pro-brain natriuretic peptide levels were significantly higher in approximately 96% of patients in the Fontan group than in the healthy group. In the Fontan circuit, N-terminal pro-brain natriuretic peptide is released by cardiac cells under both hypoxic conditions and severe ventricular dysfunction. In our study, the exercise capacity of all but one patient was NYHA classes I and II. No symptoms or signs of heart failure were observed in these patients. They were individuals who attended school and participated in daily activities. The presence of subclinical heart failure may have contributed to the higher serum N-terminal pro-brain natriuretic peptide levels in these patients compared with the healthy group because of their unique physiology and lower-than-normal oxygen saturation. Contrary to our results, Lechner et al. showed that N-terminal pro-brain natriuretic peptide levels in their patients were similar to those in healthy children before heart failure developed and that they increased after heart failure developed in correlation with the degree of failure. Reference Lechner, Gitter and Mair25 They recommended that the upper limit of N-terminal pro-brain natriuretic peptide in patients without heart failure is 282.3 pg/ml and that patients with values ≥ 282.3 pg/ml should be re-examined via all diagnostic methods despite the absence of heart failure. The N-terminal pro-brain natriuretic peptide level in our patient with heart failure was 772 pg/ml. The patient had stenosis in the Fontan tunnel. Because the number of patients in our study was small, we could not detect any difference in serum peptide levels between patients with and without heart failure. In addition, a negative correlation between the serum peptide levels and respiratory function tests, maximum oxygen saturation, maximum heart rate, stroke volume, cardiac output, and a linear mass/volume ratio was found in the Fontan group. This correlation has been supporting the unique nature of the Fontan circulation. The negative relationship between N-terminal pro-brain natriuretic peptide levels, dyssynchrony measurements, and exercise capacity suggests that these parameters should be studied more closely in Fontan patients.
Taken together, our results indicate that exercise parameters, serum N-terminal pro-brain natriuretic peptide values, and dyssynchrony measurements are more valuable than conventional methods for evaluating the clinical and functional status of Fontan patients. Although the patients' systolic functions were normal on conventional echocardiography, dyssynchrony measurements showed the opposite result. Although, dyssynchrony values provide better information regarding the status of the ventricles than conventional echocardiography examinations, we could not find clear results about the impact on the patient’s clinical status. Although each assessment method provided valuable results, its superiority over each other was not demonstrated. Our results indicate that the use of all methods (cardiopulmonary exercise test, echocardiography examination, and natriuretic peptide levels) together, rather than individually, provided more objective information in the assessment of the clinical condition of patients. Although the results obtained were abnormal compared with those of normal subjects, no significant complaints or findings were noted in all patients except those with tunnel obstruction. As these findings are based on a group of patients younger than those reported in the literature, further in vivo and in vitro studies involving larger age-related groups are needed to assess these methods.
Limitations
This study has limitations, such as its retrospective design, the small sample size, and systemic ventricle being mainly the left ventricle.
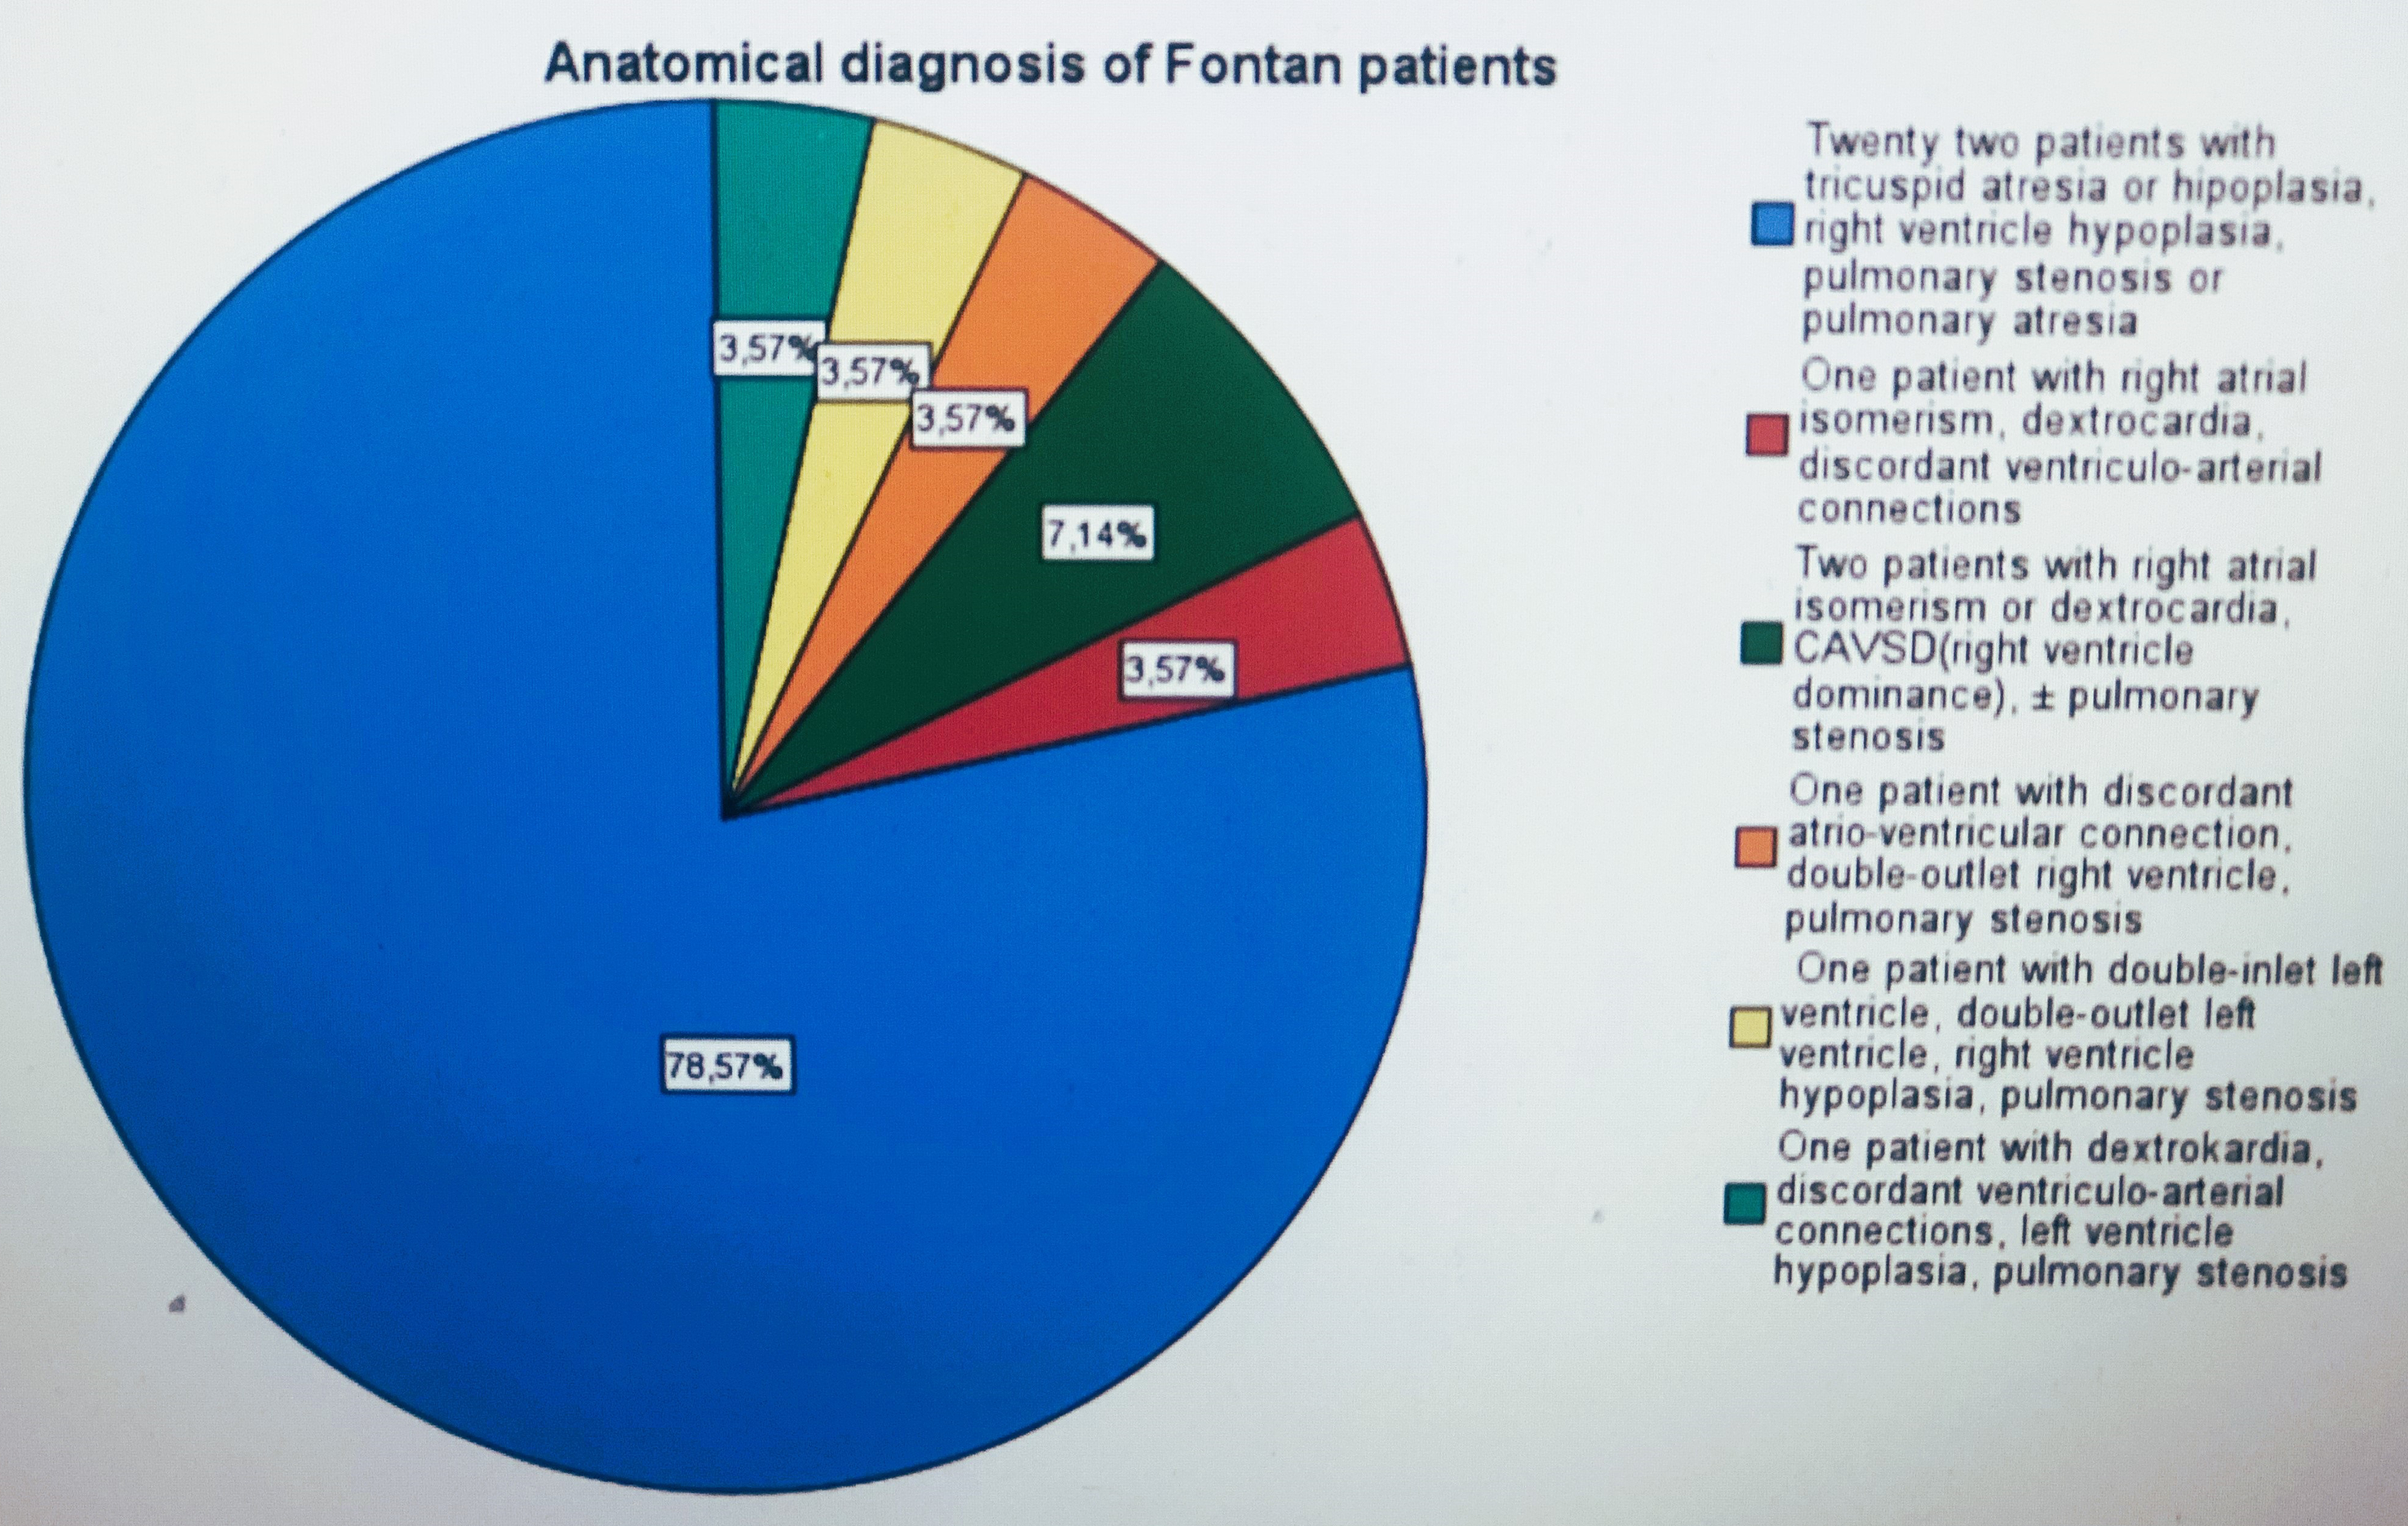
Figure 1. Anatomical diagnosis of Fontan patients.
Acknowledgments
We would like to thank the exercise and biochemistry laboratory technicians who contributed to the data collection.
Financial support
This research received no specific grant from any funding agency, commercial, or not-for-profit sectors.
Competing interests
None.


 Open access