


Introduction
Glaciers can be used as key indicators of climate change (Reference KuhnKuhn, 1981; Reference Haeberli, Hoelzle, Paul and ZempHaeberli and others, 2007; Reference Raper and BraithwaiteRaper and Braith-waite, 2009). Additionally, alpine glaciers play an important role in the alpine hydrological system (Reference Chen and OhmuraChen and Ohmura, 1990; Reference Lambrecht and KuhnLambrecht and Kuhn, 2007). In alpine countries with many glaciers, various glacier inventories have been made to study the glaciers’ losses in overall area and volume (Reference Kääb, Paul, Maisch, Hoelzle and HaeberliKääb and others, 2002; Reference CitterioCitterio and others, 2007; Reference Lambrecht and KuhnLambrecht and Kuhn, 2007; Reference Abermann, Lambrecht, Fischer and KuhnAbermann and others, 2009). However, detailed studies of glaciers that involve determining their mass-balance behaviour are rare, having been made for just a few of the larger alpine glaciers (e.g. Reference Thibert, Blanc, Vincent and EckertThibert and others, 2008; Reference FischerFischer, 2010). To be able to completely understand a given glacier’s responses to climate variations, all sizes of glaciers have to be studied. UNESCO/IASH (1970) stated that glaciers smaller than 0.5 km2 represent the smallest glaciers, while Reference KuhnKuhn (1995) refers to the representatives of this area class as very small glaciers. Only a few studies of very small glaciers have been made in various parts of the world (Reference KuhnKuhn, 1994; Reference Kaufmann, Ladstadter, Hurni and KrizKaufmann and Ladstadter, 2008; Reference DeBeer and SharpDeBeer and Sharp, 2009; Reference Grunewald and ScheithauerGrunewald and Scheithauer, 2010; Reference Shahgedanova, Nosenko, Bushueva and IvanovShahgedanova and others, 2012).
Triglav glacier lies beneath the top of Slovenia’s highest mountain peak, Triglav (2864 m), located in the Julian Alps. It is situated on the mountain’s northeast side at an altitude of 2400–2500 m. It lies below the climatic snowline of the Julian Alps, which is taken as ∼2700m (Reference GamsGams, 1994). According to Reference KuhnKuhn (1995), Triglav glacier can be classified as a very small glacier. According to the UNESCO/IASH (1970) primary classification it is currently a mountain glacier in the form of an ice apron. Until the 1950s Triglav glacier was still showing signs of movement in the form of glacier crevasses (Reference MezeMeze, 1955; Reference Triglav-Čekada, Zorn, Kaufmann and LiebTriglav-Čekada and others, 2012).
The Kredarica mountain hut was constructed next to the glacier in 1896. The glacier retreat can therefore be traced back through the whole of the 20th century using old drawings and several amateur photographs.
Systematic, annual measurements of Triglav glacier began in 1946, carried out by the Anton Melik Geographical Institute of the Scientific Research Centre of the Slovenian Academy of Sciences and Arts, and were made manually using a metre band, rope and compass to measure the distance and direction towards permanent points marked on rocks around the glacier. Some non-metric images were also taken during these expeditions. Regular, monthly photographing of the glacier began in 1976 using a panoramic, non-metric Horizont camera (Fig. 1).
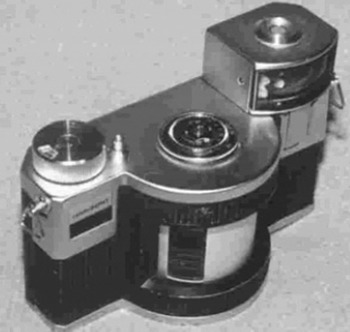
Fig. 1. The panoramic Horizont camera. The camera uses ordinary, 35 mm film, with a frame size of 24mm × 58 mm. It has a 120° field of view and a theoretical focal length of 28 mm.
The Kredarica mountain hut contains the highest meteorological station in Slovenia, and has been in constant operation since 1954. At first, the weather conditions were monitored three times per day by permanent meteorological staff on Kredarica. However, 24 hour per day observations were introduced in April 1991, and since 1994 automatic measuring instruments have been in use. Earlier meteorological observations at Kredarica were conducted between 1897 and 1912, but only during the summer months (Reference Cegnar and RoškarCegnar and Roškar, 2004).
Triglav glacier is an ideal example for studying the retreat of a very small glacier and meteorological measurements that can show long-term, climate variations. The first studies of Triglav glacier’s response to climatic variations were made by Reference GamsGams (1994), Reference Gabrovec and ZakšekGabrovec and Zakšek (2007) and Reference GabrovecGabrovec (2008). In the current work, the annual variations in area and volume over the past 35 years and monthly variations in the snow-cover elevation are presented and compared with the meteorological data. The results obtained from Triglav glacier studies will also help to elucidate the behaviour of other very small glaciers in the Alps and southeast Europe (e.g. glaciers in Montenegro, Albania and Bulgaria; Reference Grunewald, Weber, Scheithauer and HauboldGrunewald and others, 2006; Reference HughesHughes, 2007, Reference Hughes2009; Reference Grunewald and ScheithauerGrunewald and Scheithauer, 2010).
Methods
In addition to the systematic, annual measurements, some non-metric images of the glacier were taken from different locations using a variety of cameras. However, to enable measurement of the glacier’s retreat, it was necessary to have photographs from identical standpoints over the years. Initially, some approximate standpoints for the annual photographing of Triglav glacier using different cameras were used (Reference MezeMeze, 1955; Reference ŠifrerŠifrer,1963; Reference Šifrer and KoširŠifrer and Košir, 1976; Reference GabrovecGabrovec, 2008; Reference Triglav-Čekada, Zorn, Kaufmann and LiebTriglav-Čekada and others, 2012).
For regular, monthly photographing of the glacier, a Horizont non-metric camera mounted on two fixed standpoints was chosen. Both standpoints make it possible to cover the whole glacier within the view of a single photograph and are easily accessible from the Kredarica mountain hut. Unfortunately, the views of the glacier from these two standpoints are convergent, preventing any stereo-vision from the two images (Fig. 2). The standpoints are stabilized using metal bars ∼ 1m high with a small horizontal plate on top to hold the camera.
Fig. 2. Re-sampled Horizont images from the two standard standpoints taken on 24 August 1989. On the left image, standpoint A, the white rocks above the glacier that represent the historical upper boundary of the glacier can be clearly seen. The right image was taken from standpoint B.
The Horizont panoramic camera is kept at the Kredarica mountain hut and used only for the monthly photographs of the glacier. It uses a swing lens to produce the panoramic image. The film in a swing-lens, panoramic camera is placed on a cylinder and is exposed through a small moving slit. Therefore, its mathematical projection model is different to the usual perspective projection applied in standard photogrammetric procedures. In the process of calibration we developed a special geometrical model of the projection, used to perform a re-sampling of the panoramic image to a correct perspective projection (Reference Triglav-Čekada, Radovan, Gabrovec and Kosmatin-FrasTriglav-Čekada and others, 2011).
The first geodetic measurements of Triglav glacier were conducted in 1952. They included measurements of the glacier boundary and the points that made it possible to produce contour presentations of the glacier. The second set of geodetic measurements was conducted in 1995 (Reference GabrovecGabrovec, 1998). Since 1999, regular geodetic and photogrammetric measurements of the glacier have been made, and until 2007 both aerial and ground-based oblique photogrammetric measurements were made on a biennial basis (Reference Triglav-Čekada and etrovič DTriglav-Čekada, 2007). Due to the small size of the glacier in the past decade, since 2007 annual geodetic measurements of the glacier boundary and the points on the surface of the glacier, which are arranged in vertical lines, have been conducted. In combination with the geodetic measurements, only supplementary, ground-based, oblique, photogrammetric measurements are conducted. In 1999 and 2000, ground-penetrating radar (GRP) surveys of the glacier were also performed, to measure the depth of the glacier (Reference Verbič and GabrovecVerbič and Gabrovec, 2002).
In this research we present a comparison of the three-dimensional (3-D) boundaries of Triglav glacier acquired from Horizont images. The interactive method of absolute orientation, described in detail by Reference Triglav-Čekada, Radovan, Gabrovec and Kosmatin-FrasTriglav-Čekada and others (2011) and Reference Rönnholm, Hyyppä, Pöntinen, Haggrén and HyyppäRönnholm and others (2003) was used. First, the Horizont images were re-sampled to the perspective projection (Fig. 2). Then the same images were used in an interactive method for absolute orientation. The absolute-orientation parameters of the image (the 3-D location of the standpoint, the three angles of the image orientation and the scale) were derived with a manual interactive search for the best fit of the superimposed 3-D points of the digital elevation model (DEM) onto the details seen on the image. When the image is oriented correctly, the superimposed DEM points fit the image well. The 3-D boundary of the glacier is measured by selecting individual 3-D points from the superimposed DEM. The glacier boundary (i.e. the glacier edge) lies on bare, rocky terrain. This terrain can be described by the DEM measured at any time between 1976 and 2012, as it is assumed it has not changed significantly during this period. Therefore, we used a modern, photogrammetrically derived DEM with a grid size of 2 m × 2 m from 2005. Unfortunately, this decision caused problems, as the theoretical volumes of the glacier became negative after 2005.
The delineation of the glacier boundary based on Horizont images also includes the snow adjoining the glacier, as such snow areas cannot be visually distinguished from the real glacier. Such a glacier delineation was also proposed by UNESCO/IASH (1970). Because the annual systematic measurements made prior to 1976 show glacier areas smaller than 15 ha, it was decided that the lower tongue of the snow cover seen in the Figure 3 images from 1976 and 1980 should be excluded from the glacier area. As the extent of the snow cover from previous winters at the end of the glacier’s melting season could be relevant for a comparison with the meteorological parameters, it was decided that these data should also be presented. For the empirical computations (Table 1) the reduced areas were also computed. The reduced areas present the area in 1976 without a lower snow tongue, and in subsequent years they obey the rule that the glacier cannot grow in size for two successive years.
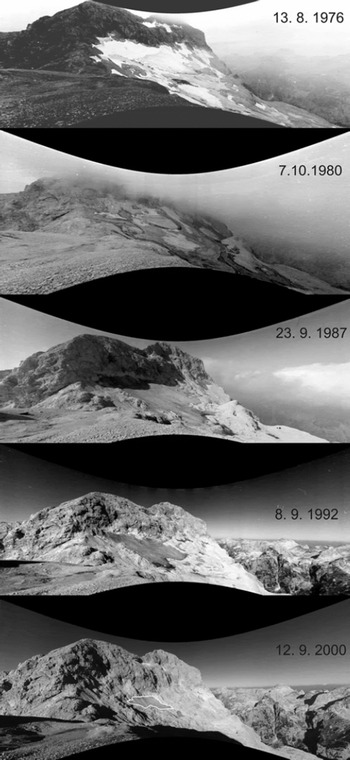
Fig. 3. The retreat of Triglav glacier on re-sampled Horizont images. Dates are day/month/year. Because in 2000 the glacier/rock contrast is very small, the boundary of the glacier in that image is marked with a white border.
Table 1. Area, reduced area and theoretical volume from Horizont images, and empirical volume and empirical average thickness (as defined by Reference Chen and OhmuraChen and Ohmura, 1990). For the computation the reduced area is used
The resulting 3-D glacier boundary is used to calculate the 2-D area and the theoretical 3-D volume of the glacier. The glacier’s 2-D area is measured as a projection of a 3-D boundary on a plane with an elevation of 0m. The glacier’s theoretical 3-D volume is calculated as the difference between two surfaces: the upper surface connects the 3-D glacier boundary, while the lower surface connects the points of the DEM from 2005.
It was concluded that more precise glacier-area measurements could be expected if the Horizont images from standpoint B were used (Fig. 2), as the view towards the glacier is more uniform for all the parts of the glacier (Reference Triglav-Čekada, Radovan, Gabrovec and Kosmatin-FrasTriglav-Čekada and others, 2011). An expected average standard deviation of the area of ±0.06 ha and the volume of ±5.5×1000 m3 can be expected if angle-orientation errors of ±0.2° for all three angles are allowed. (The Horizont images from standpoint A have a more inclined view towards the glacier, which results in greater standard deviations of the area and volume when applying the same angle-orientation errors.)
The theoretical volume calculations were checked against the empirical volume calculations proposed by Reference Chen and OhmuraChen and Ohmura (1990):
where S is the reduced area size. Due to the lack of multi-annual, ground-penetrating radar measurements, which would tell us more about the glacier-thickness reduction, only the empirical mean thickness, h, of the glacier could be calculated by Reference Chen and OhmuraChen and Ohmura (1990):
Horizont images can also be used to study the monthly variation of snow cover on the glacier. As our method enables only the 3-D restitution of objects that are located on the DEM, only the upper boundary of the glacier can be measured from the Horizont images. The upper boundary of the glacier leans against steep rocks, which always show a snow/rock contact (see Fig. 6). The interactive orientation, therefore, enables a study of the average glacier upper-boundary elevation during different months.
Results
Annual variation
In 1937 the glacier had an area of 27 ha, as determined from a 1937 topographic map with a scale of 1 : 25000. At the beginning of the regular measurements using a metre band in 1946, the glacier area had reduced to 14.4 ha, or 15.7 ha when the snowfields were included Reference MezeMeze, 1955). In the period 1946–73 the glacier retreated only slightly. The uncovered glacier had an area of 11.9 ha in 1973, as measured by metre band (Reference Šifrer and KoširŠifrer and Košir, 1976).
If the glacier is covered by snow from the previous winter, only the extended glacier area with snowfields included can be acquired from the Horizont images. Therefore, the size of the snow-covered glacier acquired from the Horizont images is greater than the size of the real glacier obtained from the metre-band measurements in the period 1946–73. In the period 1976–82 the glacier was still covered by snow from the previous winter at the end of September (upper two images in Fig. 3). Accelerated glacier retreat began in 1983, with the glacier being mainly snow-free at the end of the melting season. Over the next 10 years the glacier area decreased from 10.1 ha in 1983 to 4.7 ha in 1993. In 1995 it reached 3.0 ha, and over the next 5 years it decreased to 1.1 ha by 2000 (bottom image of Fig. 3). It reached its minimum of 0.6 ha in the period 2003–07, with the exception of 2004, 2005 and 2006, when the snow-covered glacier was a little larger.
As a result of the above-mentioned snow-rich winters, the retreat of the glacier has halted since 2007/08. The glacier was still partly conserved under the snow when the annual geodetic measurements in late August or early September were conducted in the years 2009–11. The latest geodetic measurements show 2.4 ha of snow-covered glacier area in 2011. This means that the Horizont images from the end of September or early October reveal smaller snow-covered glacier areas than the areas acquired by the geodetic measurements. The differences between the geodetic measurements in late August/early September and the Horizont images in late September show an average reduction of the snow-covered glacier area of 0.2 ha in the period 2008–10. The geodetic measurements are conducted in mid-September at the latest, i.e. before the first autumn snow, which can cover the glacier. Nevertheless, they are very important as they enable detailed glacier-surface studies, which are not possible from only the Horizont images.
As seen in Figures 4 and 5, the glacier-area retreat is exponential for the period 1976–2010. For the period 1971– 2000 the average annual and average summer temperatures on Kredarica are –1.3 and 5.3°C, respectively (Reference Cegnar and RoškarCegnar and Roškar, 2004). In Figure 4 we see a small increase in the average annual air temperature and a slightly larger increase in the average summer air temperature (June–August). Additionally, it is clear that before 1990 the mean annual and the mean summer air temperatures are generally lower than the long-term average, while after 1990 they are mainly higher.

Fig. 4. Area change of Triglav glacier on a logarithmic scale on the left-hand axis. The mean annual and the mean summer temperatures (June–August) on the right-hand axis. The temperatures are taken from Reference Cegnar and RoškarCegnar and Roškar (2004) and the newest data of the Slovenian Environment Agency (http://www.arso.gov.si/en/).
Fig. 5. Area change of Triglav glacier on the left-hand axis. The annual maximum snow-cover depth and the maximum snow-cover depth in June on the right-hand axis are taken from Reference Cegnar and RoškarCegnar and Roškar (2004) and the Slovenian Environment Agency (http://www.arso.gov.si/en/).
The maximum snow-cover depth in June is very important for the glacier’s conservation, as it presents the highest snow-cover depth at the end of the glacier-accumulation period. Figure 5 shows the general trend for the reduction of the annual and the June maximum snow-cover depth. Both maximum snow-cover depths are correlated, and this trend is also correlated with glacier reduction. In the period 1993–2000 the June maximum snow-cover depths are much smaller than the average greatest maximum snow-cover depths, which mainly occur in April. This can depend on higher spring temperatures, which also raise the average annual temperatures (Fig. 4) and melt away the snow accumulation from previous months.
The second highest maximum snow-cover depth was observed in 1977, with 690 cm of snow in April. The period 1975–79 is recorded as the period of the highest maximum snow-cover depth since the start of the meteorological observations on Kredarica in 1954 (Reference NadbathNadbath, 1999). The next exceptional year was 2001, with 700 cm of snow. However, it was followed by just 195 and 240 cm maximum snow-cover depth in 2002 and 2003, respectively. In 2003 this was accompanied by exceptionally high summer temperatures (Fig. 4). These unfavourable conditions resulted in the smallest size of the glacier in 2003, when it was just 0.6 ha on the Horizont image from early October.
Since 2003 the annual maximum snow-cover depth has been increasing again, resulting in a conserved glacier under the snow during the summer months. Only the late-September Horizont images reveal a snow-free glacier of 0.6ha in the years 2003–07. Later, in 2009 and 2010, the Horizont images also show a snow-covered glacier in mid-September. It can be concluded that the maximum snow-cover depth represents an important factor for glacier conservation. Unless such snowy winters continue, the glacier will soon disappear.
An estimate of the glacier area under the snow is given as the reduced area in Table 1, which was estimated as described in the Methods section. The reduced area was used to calculate the empirical volume and the empirical mean thickness of the glacier. It is clear that the theoretical volumes derived from the 3-D glacier boundaries describing, in many cases, a still partially snow-covered glacier, are in good correlation with the empirical volume derivations. On 5/6 July 2000 the only useful glacier-thickness measurements were recorded with GPR (Reference Verbič and GabrovecVerbič and Gabrovec, 2002). The thickness of the snow cover on the glacier and the ice thickness were given separately. The maximum ice thickness of the glacier was 9.5 m. Additional snow cover over the glacier, in most cases, did not exceed 1 m. Using these data, a glacier volume of ∼35000 m3 was calculated. The volume calculated from the thickness measurements is smaller than the volume computed empirically, 70500 m3. Nevertheless, the theoretical volumes correspond better to the empirical volumes. The difference between the theoretical volume and the empirical volume in 2005 implies a negative theoretical volume, as discussed above.
The empirical mean thickness of 5.7m derived for 2000 also corresponds well, in general, with the thickness span of the GPR measurements from 2000. Therefore, the empirical thickness values can be taken for the computation of the annual glacier-thickness reduction. On average, the glacier thickness has reduced by 0.5 m a – 1 in the period 1976–2011.
Monthly variation
The average upper boundary of the glacier covered by snow (which leans against steep rocks; Fig. 6) can give an indication of the glacier’s thickness reduction. This can be directly compared with the maximum snow-cover depth observations at Kredarica. Years 1977 and 1998 were chosen to test the monthly snow-cover variation.

Fig. 6. Triglav glacier’s upper-boundary elevation reduction between May and August 1998. In May the snow reaches to the top of the light-grey rocks seen in the August image.
On average, Kredarica is snow-covered for 73% of the year. In the summer months there are, on average, only a couple of days with snow cover. The 1971–2000 long-term average at Kredarica shows that we can expect the highest maximum snow-cover depths in April, which is also characterized as the rainiest month in the lowlands. March, April and May are characterized as the months with the highest maximum snow-cover depths (Reference Cegnar and RoškarCegnar and Roškar, 2004). This can be clearly seen in Figure 7. As expected, the average upper-boundary elevation of the glacier covered by snow corresponds well with the maximum snow-cover depth observations. The elevation difference between the 1977 and the 1998 average upper boundaryis 17m inAugust and 16m in May. The difference between March 1977 and May 1998, in which the highest average upper-boundary elevation is seen, is 19 m in elevation and 19 m in planimetry. The differences are rounded up to the nearest 1 m, due to greater expected inaccuracies of the interpolated DEM in steeper terrain.
Fig. 7. The maximum snow-cover depth per month in 1977 and 1998 on the left-hand axis. The average upper-boundary elevation of the glacier covered by snow in different months for 1977 and 1998 on the right-hand axis.
The maximum elevation difference in 1 year is 40 m for 1977, between March and August, and 44m for 1998, between May and September. These elevation differences show that on the upper boundary of the glacier there is a very thick accumulation of winter snow. In addition, this snow does not melt away as quickly as the snow on Kredarica, as it is protected by the shadow of Triglav mountain. The meteorological station on Kredarica is, in contrast, positioned in the open and is liable to high winds and melting snow on sunny days. Therefore, the shadow of Triglav mountain represents an important conserving factor for the glacier.
In Figure 8 the highest elevations of the glacier’s upper boundary for 1977 and 1998 are drawn on a summer Horizont image of 26 August 1977. It is clear that the upper glacier boundary in May 1998 corresponds well with the upper summer glacier boundary in 1977, which is presented on the original Horizont image.
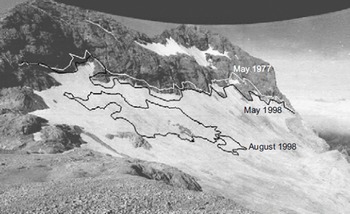
Fig. 8. Triglav glacier on 26 August 1977. The white curve represents the glacier’s upper-boundary elevation in May 1977. The black curves represent the glacier’s area in August 1998 and its highest upper-boundary elevation in May 1998.
Conclusion
Regular monthly photographing of Triglav glacier, carried out since 1976 using a Horizont, panoramic, non-metric camera, represents an invaluable source of data, showing the snow conditions and glacier decrease over three decades. Annual geodetic and photogrammetric measurements of Triglav glacier have been available since 1999, while the Horizont images from the same period help us to resolve the minimum size of the glacier during the years when geodetic measurements were made on the glacier while it was still partly snow-covered.
The comparison of the annual glacier decrease with the average annual and summer temperatures and the maximum snow-cover depth at the nearby Kredarica meteorological station shows that the glacier decrease and conservation mainly depend on the maximum snow-cover depth in that year, especially the cover in June. The snow-rich winters from 2003 onwards prevented the glacier from disappearing. However, if the winter weather conditions are not favourable, with small maximum snow-cover depths, the complete disappearance of the glacier can be expected in the next few years.
As shown using an example of a monthly study in 1977 and 1998, the Horizont images enable a detailed study of the snow conditions on the glacier. The average upper-boundary elevation of the glacier covered by snow can be measured from Horizont images and compared with meteorological data from Kredarica. An annual elevation difference of 40 m for 1977 and 44m for 1998 shows that on the upper boundary of the glacier there is a substantial accumulation of winter snow, which does not melt away as quickly as the snow at the meteorological station on Kredarica. This agrees very well with the Reference KuhnKuhn (1995) suggestion that very small glaciers owe their existence mainly to the local topographic features, which can cause wind drift and avalanches that locally multiply the winter precipitation by a larger factor. This method of monthly study for the upper-boundary elevation can be implemented for the whole period 1976–2010 and represents great potential for a detailed study of glacier shrinkage.
The interactive orientation of the DEM to a 2-D image will allow us to acquire further 3-D data from other archive images of Triglav glacier, which are stored in the archives but have not yet been analysed. This will enable a reconstruction of the glacier’s size and snow conditions during earlier times. The method would benefit in terms of precision if a more accurate lidar-derived DEM were to be used in the future. The final goal for our future research is to study the mass balance of the glacier. The area and volume changes represent a basis for computing the geodetic mass balance, as proposed by Reference FischerFischer (2011). To make these computations possible, some ice-density measurements of Triglav glacier will be needed prior to its disappearance.
Acknowledgements
This work was partly supported by Slovenian Research Agency projects L6-7136(C) and Z2-4182(B). We are grateful to M. Kuhn for confirming our theoretical volume calculations and pointing us in the direction of literature discussing very small glaciers.


