


INTRODUCTION
In England, urinary tract infections (UTIs) are the most common cause of emergency admission to hospital amongst conditions that could be managed appropriately in the community, with age- and sex-adjusted admissions per 100 000 population increasing from 102 in 2001/02 to 229 in 2012/13 [1]. UTI sequelae include frequent recurrences, pyelonephritis, bloodstream infection (BSI) and complications associated with frequent antibiotic use, such as antibiotic resistance and Clostridium difficile colitis [Reference Flores-Mireles2]. In 2015, UTIs in the overall population were the second most common cause for antibiotic prescribing in primary care and prescribing for UTI has been increasing from 2010 to 2015 [3]. Most of this prescribing is likely to be in women, as UTIs are more prevalent in women [Reference Flores-Mireles2]. As such, antibiotic treatment for UTI is an important driver of antibiotic resistance.
Understanding the seasonality dynamics of UTI may provide a valuable insight into the determinants of infection, which can help clinicians and infection control specialists understand the risk factors for these infections and ultimately improve their prevention. Any seasonality should also be accounted for in the evaluation of interventions against UTI, as decreases in incidence due to seasonality could be misinterpreted as decreases caused by the intervention. Seasonality is also important when interpreting surveillance datasets and antibiotic prescription datasets, as increases in incidence or prescriptions could be misinterpreted as outbreaks or inappropriately high prescribing.
While some bacterial infections seem to exhibit a winter seasonal pattern in temperate climates, such as bacterial meningitis [Reference Opatowski4, Reference Paireau5], other infections such as Campylobacter and Salmonella infection are more common during the warmest months of the year [Reference Louis6, Reference Yun7]. Dehydration has been suggested to increase the risk of UTI, by causing lower rates of urine flow and voiding frequency, which may delay bacterial eradication from the urinary tract [Reference Beetz8]. Due to increases in temperature during summer time, which can make individuals prone to dehydration, UTIs could be expected to peak in summer. These changes could be particularly marked in the elderly population, who are prone to dehydration [Reference Wolff, Stuckler and McKee9]. However, drinking more water in summer could also cause dehydration to be less common this period. Sexual activity is also a known risk factor for UTI and may also influence UTI dynamics [Reference Flores-Mireles2].
Evidence regarding the seasonality of UTIs from the literature is conflicting (Supplementary Table S1 and Appendix 1). One study showed UTI incidence was higher in the winter [Reference Stansfeld10], one in autumn [Reference Vorland, Carlson and Aalen11] and others in summer [Reference Anderson12–Reference Melamed, Khiabanian and Rabadan16]. Additional studies suggested that seasonality varied by causative organism [Reference Pead, Maskell and Morris17, Reference Ferry, Burman and Mattsson18] and by whether patients were seen by general practitioners (GPs) or in hospital [Reference Eriksson, Giske and Ternhag19]. These differences may be partly caused by the use of inadequate methodology (e.g. comparing incidence without any formal statistical analysis [Reference Stansfeld10, Reference Yolbaş15, Reference Ferry, Burman and Mattsson18, Reference Kwok20]), the assessment of seasonality in different geographical areas (e.g. in Norway [Reference Vorland, Carlson and Aalen11] vs. in Greece [Reference Falagas13]), different species (e.g. Escherichia coli and Staphylococcus saprophyticus [Reference Ferry, Burman and Mattsson18]) and different case-mix (e.g. in children [Reference Stansfeld10, Reference Yolbaş15, Reference Kwok20] vs. in all ages [Reference Vorland, Carlson and Aalen11, Reference Rossignol14, Reference Melamed, Khiabanian and Rabadan16, Reference Ferry, Burman and Mattsson18, Reference Stamm21], in the community [Reference Vorland, Carlson and Aalen11–Reference Falagas13, Reference Yolbaş15, Reference Pead, Maskell and Morris17, Reference Ferry, Burman and Mattsson18, Reference Kwok20] vs. in hospital [Reference Stansfeld10, Reference Melamed, Khiabanian and Rabadan16] or in females [Reference Anderson12, Reference Pead, Maskell and Morris17, Reference Eriksson, Giske and Ternhag19, Reference Stamm21] vs. both sexes [Reference Stansfeld10, Reference Vorland, Carlson and Aalen11, Reference Falagas13–Reference Melamed, Khiabanian and Rabadan16, Reference Ferry, Burman and Mattsson18, Reference Kwok20]).
In order to explore the seasonality and trends of UTI in the UK over 2008–2015, we analysed UTI consultations and antibiotic prescriptions by GPs in different age groups using data from a nationally representative database of electronic health records from primary care, The Health Improvement Network (THIN).
METHODS
Dataset
THIN is a validated database of primary care consultation data covering over 3·7 million active patients which are demographically representative of the UK [Reference Blak22–Reference Bourke, Dattani and Robinson24]. The monthly rate of de-duplicated UTI consultations and nitrofurantoin and trimethoprim prescriptions by age and sex, for 2008–2015, were extracted from THIN (see Supplementary Appendices 2 and 3 for details).
Statistical methods
Negative binomial models were separately fit to the rate of UTI consultations and trimethoprim and nitrofurantoin prescriptions in order to assess trend and seasonality. These were repeated by age group (14–17, 18–24, 25–45, 46–69, 70–84, 85+) and by sex (full model described in Supplementary Appendix 4). All models included a trend term modelled as a quadratic function of time.
A seasonality term was then added to the models. The dispersion parameter was fixed at the estimate derived for the seasonal model, which was more complex. This enabled to compare the fit of the models with and without the seasonality term using the Akaike information criterion (AIC) and the percentage of deviance explained by the model. In addition, a correlogram was plotted to explore the correlations between the residuals of the model and the lagged values of the residuals for lags 1–12 (over the course of a year). Adding an autoregressive term at a lag of 1 month in the regression to test for local statistical dependence or autocorrelation was also explored, as it is common for infection time-series data; however, it did not significantly improve the fit of the models.
All the analyses were carried out in R version 3.3.0 [25] using the glm.nb function in the MASS package [Reference Venables and Ripley26] to obtain the θ (the dispersion parameter) of the full model. Subsequently the glm function (stats package) was used to fit the model with the fixed θ.
Sensitivity analysis
In order to assess coding reliability for UTI consultations in THIN, we calculated the percentage of monthly trimethoprim and nitrofurantoin prescriptions that had a UTI consultation coded on the same day. These appeared to follow a cyclical pattern during the year; therefore, in order to account for any seasonality in coding, the monthly UTI consultations were scaled for each age group by dividing by a scaling factor. This scaling factor was the percentage of UTIs coded in each month (as described above) divided by the maximum percentage coded over the study period for that age group. As a sensitivity analysis, the seasonality was also assessed in these scaled UTIs. We also repeated the analysis for England.
RESULTS
UTI consultations and trimethoprim and nitrofurantoin prescriptions
Between 1 January 2008 and 31 December 2015, there were 992 803 de-duplicated UTI consultations and 1 719 416 de-duplicated trimethoprim and nitrofurantoin prescriptions reported to THIN. The mean monthly rate of UTI consultations and trimethoprim and nitrofurantoin prescriptions per 100 000 population for all age groups and by sex is shown in Table 1. Both measures increased steeply with age, particularly in males (see Table 1).
Table 1. Descriptive table of the rates of UTI consultations and trimethoprim and nitrofurantoin prescriptions by age group and sex
These were de-duplicated to one per patient per 30-day period in order to approximate episodes of infection (one nitrofurantoin or trimethoprim prescription during the 30-day period).
Trend
Although coding for UTI consultations by GPs was poor, it remained stable over the study period (the percentage of trimethoprim and nitrofurantoin prescriptions that had a UTI consultation coded on the same day fluctuated between 35% and 41% during the study period), enabling the study of trend over time (Supplementary Fig. S2). With the exception of males aged 70–84, the rate of UTI consultations for both males and females of all age groups decreased during the study period, as shown by the greatly improved AIC when adding a linear trend term to the model (see Supplementary Fig. S3 and Tables S2, S3). This decrease was particularly pronounced for females aged 85 or older. The trend in the UK was very similar to the trend in England (Supplementary Fig. S4).
Seasonality by age
Adding a seasonal component to the negative binomial regression greatly improved the model fit to the data for ages 14–17, 18–24, 25–45 and 46–69, as measured by the AIC and the percentage of deviance explained by the model (see Table 2), showing that UTI consultations in these age groups follow a cyclic yearly pattern. For ages 70–84, there was also a notable improvement in the model fit; however, in those aged 85 or older, the improvement was minimal. In younger ages, there is no overlap between the 95% CIs of the models with and without seasonality during the September to November period for most years (Fig. 1). However, the 95% confidence intervals (CIs) of the two models overlap substantially for those aged 85+.
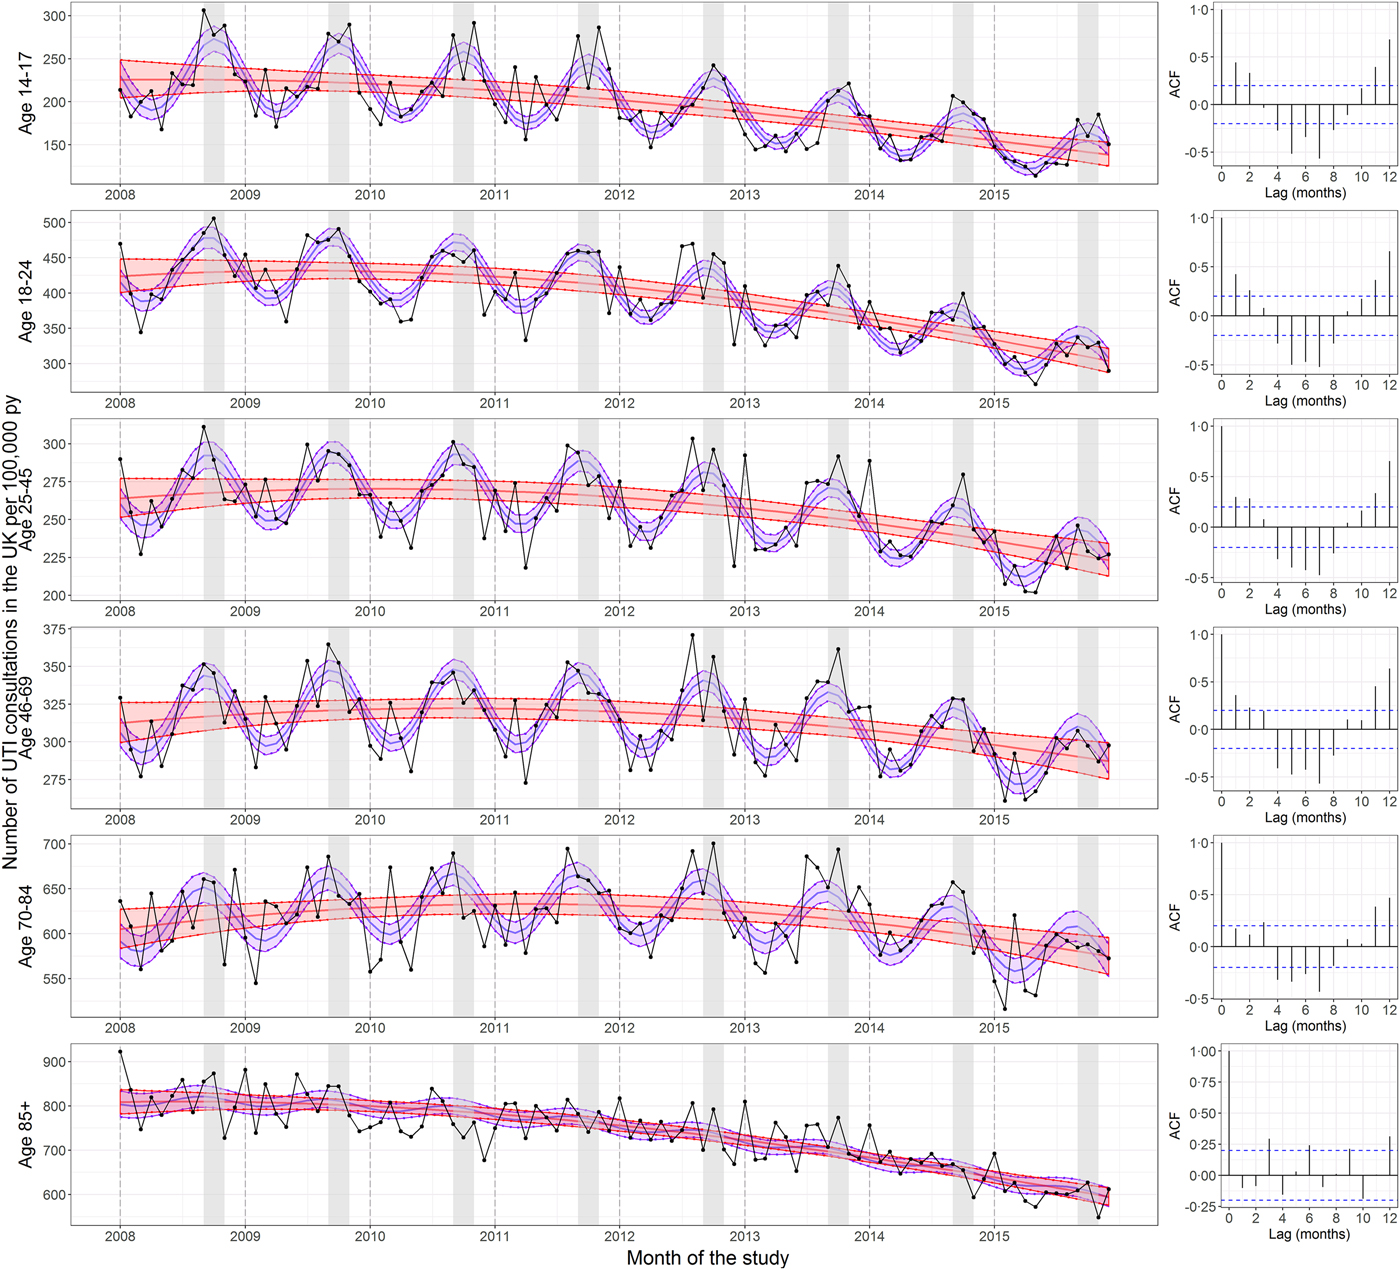
Fig. 1. Seasonality in UTI consultations coded in the UK per 100 000 person years by age. The left panels show the rate of UTI consultations by age group. The central red lines represent the fitted predictions of the negative binomial polynomial regression model of degree 2 with the number of patients registered at each of the GP practices on 1 July (mid-year) each year of the study as offset. The central blue lines represent the fitted predictions of the same model but with a seasonal component included. The shaded areas represent the 95% confidence intervals for their respective models. These were calculated using the standard errors from the predict function, which calculates the confidence intervals around the mean. The right panels show the correlograms for the residuals of the regression models without seasonality at lags of 0–12 months for each age group. The September to November period is shaded in grey. The UTI consultations were de-duplicated to one per 30-day period. The y-axes differ between panels.
Table 2. Akaike information criteria (AIC) and the percentage deviance explained by the models of UTI consultations in the UK including a seasonal component and models that did not by age group
* In order to calculate the AIC and percentage deviance explained for the non-seasonal model, the dispersion parameter (θ) was fixed at the estimate derived for the seasonal model.
The correlograms in Figure 1 show the autocorrelation functions for the residuals of the regression models without seasonality at lags of 0–12 months. For ages 14–17, 18–24, 25–45 and 46–69, the correlograms show oscillatory patterns consistent with seasonality. This pattern is less pronounced in the 70–84-year olds and disappears in those aged 85+. With one exception (January 2014), the month of the year with the highest number of UTI consultations in those aged under 85 every year from 2008 to 2015 was between September and November (Supplementary Table S4).
The same seasonal pattern was observed for the scaled monthly UTI consultations (Supplementary Fig. S5 and Table S5), for trimethoprim and nitrofurantoin prescriptions (Supplementary Fig. S6), when restricting the analysis to England (Supplementary Fig. S7), and when analysing the seasonality of urine samples submitted to the AmSurv database [Reference Ironmonger27] in the West Midlands (data not presented here).
Seasonality by sex
Figure 2 shows the seasonality of the rate of UTI consultations by sex and large groupings of age for which we have shown seasonality to vary (<85 and 85+). UTIs in males followed a similar pattern to females; however, they were rare, which reduced statistical power to detect seasonality. Including a seasonal component into the regression model of the younger age group improved the model fit (the AIC decreased from 1092·5 to 1066·3 and the percentage deviance explained by the model more than doubled from 12·9 to 34·8). There was also an oscillatory pattern visible in the correlogram, although few correlations were significant. This contrasted with a clear lack of oscillatory shape in the correlogram for UTI consultations in males aged 85 and older and a lack of improvement in the model fit when adding a seasonal term (the AIC increased from 816·5 to 819·1 and the percentage deviance explained by the model only increased very slightly from 32·9 to 35·3). This is similar to what is observed for trimethoprim and nitrofurantoin prescriptions (Supplementary Fig. S8).
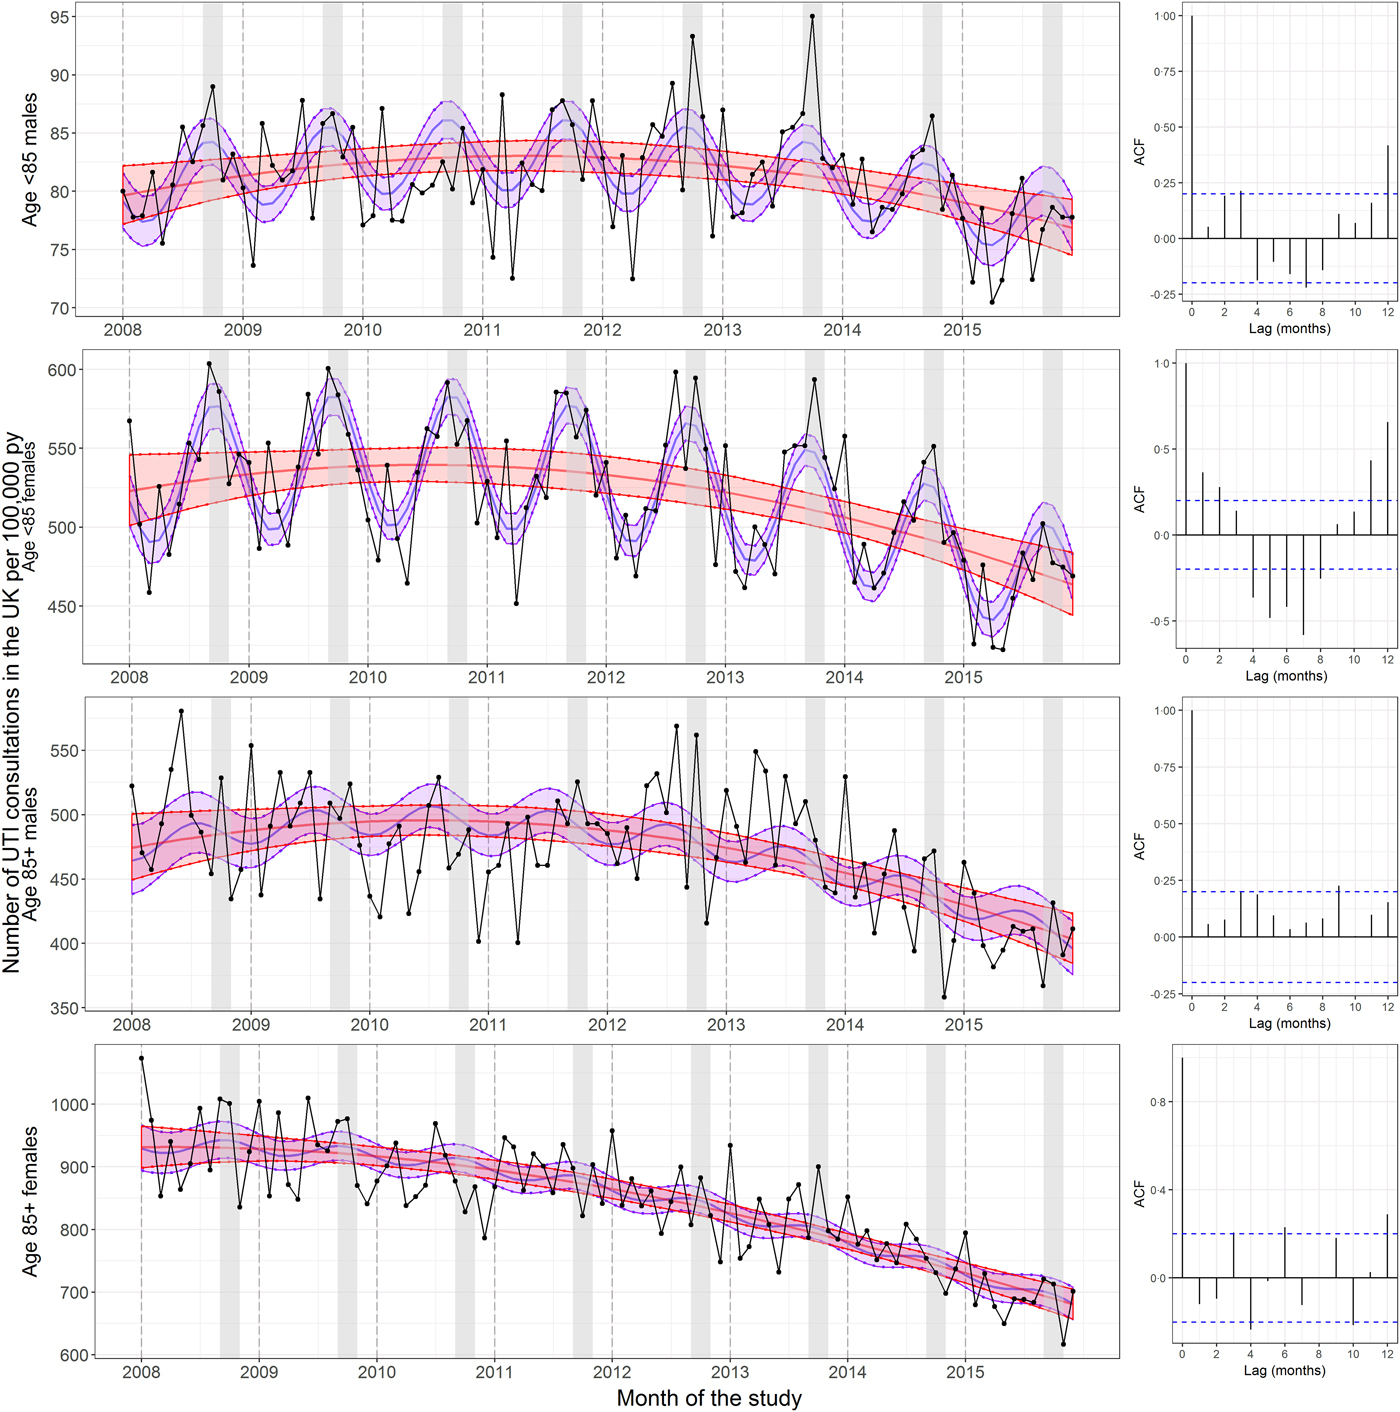
Fig. 2. Seasonality in UTI consultations coded in the UK per 100 000 person years by age group and sex. The left panels show the rate of UTI consultations by age group and sex. The central red lines represent the fitted predictions of the negative binomial polynomial regression model of degree 2 with the number of patients registered at each of the GP practices on 1 July (mid-year) each year of the study as offset. The central blue lines represent the fitted predictions of the same model but with a seasonal component included. The shaded areas represent the 95% confidence intervals for their respective models. These were calculated using the standard errors from the predict function, which calculates the confidence intervals around the mean. The right panels show the correlograms for the residuals of the regression models without seasonality at lags of 0–12 months for each age group. The September to November period is shaded in grey. The UTI consultations were de-duplicated to one per 30-day period. The y-axes differ between panels.
DISCUSSION
Summary
There was a September to November peak in UTI consultations and in trimethoprim and nitrofurantoin prescriptions for UTI in those aged 14–69 in the UK; however, this seasonality gradually disappeared with age and was not apparent in those aged 85 or older. Similar patterns were observed for males and females, although male UTIs were rare, which reduced statistical power.
Mechanism
The exact mechanism surrounding the seasonality of UTI consultations observed is likely to be complex, involving interactions between real UTI incidence, healthcare-seeking behaviour, access to care and severity. A full analysis of the mechanisms underlying the autumnal seasonality observed in younger age groups is beyond the scope of this study and warrants further research. However, these could be influenced by sexual behaviour patterns, as recent sexual intercourse is an important risk factor for UTI in young women [Reference Hooton28]. Given that the seasonal peak was not in high summer, when one might expect more dehydration, the influence of dehydration and temperature on UTI incidence in younger age groups remains unclear.
Risk factors for UTI in the elderly include recurrent UTIs, incontinence, catheter use, disruptions to the normal vaginal flora, diabetes mellitus, prostatic hypertrophy (in men) and cognitive impairment or other comorbidities that may impede adequate self-hygiene [Reference Rowe and Juthani-Mehta29]. These risk factors are less likely to be influenced by seasonal variation. UTIs in the very old can be considered a symptom of general frailty and poor care, such as consistent dehydration throughout the year, poor hygiene or inadequate catheter care. Our findings do not suggest a different seasonality in men and women; therefore, it is unlikely that the lack of seasonality detected in the very old is driven by the increase in the proportion of UTIs that are in males in this age group.
The decrease in GP consultations for UTI contrasts with the steady increase in admissions to hospital for UTIs in England (which did not include A&E attendances) [1, 30]. While these are not truly comparable datasets, this difference between the GP and hospital data could indicate an increase in severity of UTIs or treatment failure due to antibiotic resistance, which means UTIs could more frequently warrant hospitalisation. Increases in hospital admissions for UTI could also denote shortfalls in the management of UTI in the community, for example, in social care and community nursing [Reference Age31], as well as correct antibiotic treatment in primary care, which are important in preventing admissions to hospital.
Findings in context
Many studies that addressed seasonality in the literature simply reported differences in incidence [Reference Stansfeld10, Reference Yolbaş15, Reference Ferry, Burman and Mattsson18, Reference Kwok20]. One of the studies set in the UK reported a peak in S. saprophyticus UTI in mid-September and a peak in all Gram-negative bacilli other than Proteus spp. and Pseudomonas spp. (aggregated) in March [Reference Pead, Maskell and Morris17]. Gram-negative bacteria comprise the majority of the organisms that cause UTI; therefore, their findings are not in agreement with ours. That study assessed the seasonality of urine specimens from 1978 to 1983 and the epidemiology and sampling of UTIs could have changed greatly since then. The other study from the UK found a higher number of UTIs during the winter months in children seen in hospital in Durham [Reference Stansfeld10]. As we examined only adults in our study and the authors did not report their methods, so a comparison is not possible.
The seasonality of UTIs has been studied in other countries; however, the findings from these studies are also conflicting (Supplementary Table S1). Two studies reported autumnal peaks in incidence [Reference Vorland, Carlson and Aalen11, Reference Eriksson, Giske and Ternhag19]. However, neither employed appropriate methods to assess seasonality. Eriksson et al. [Reference Eriksson, Giske and Ternhag19] only reported the monthly total of samples received for 1 year and Vorland et al. [Reference Vorland, Carlson and Aalen11] studied seasonality in large aggregated time periods, which resulted in a loss of information.
In England, the seasonality of E. coli BSIs varied by region [Reference Deeny32]. As the urinary tract has been reported to be a primary source of infection for BSIs, the seasonality of UTIs could also vary by region.
Strengths and limitations
This study, to the best of our knowledge, is the first to formally assess the trend and seasonality of UTI consultations in the UK. This was a large study carried out in THIN, which is a validated database of primary care consultation data covering over 3·7 million active patients which are demographically representative of the UK [Reference Blak22–Reference Bourke, Dattani and Robinson24]. It was carried out over a period of 8 years (January 2008 to December 2015), which should help minimise the bias of detecting patterns that only occurred sporadically. In addition, we repeated the UTI consultations analysis for trimethoprim and nitrofurantoin prescriptions, which confirmed our findings.
We found that the percentage of trimethoprim or nitrofurantoin prescriptions that had a UTI consultation coded on the same day (a proxy for UTI consultation coding) was low; however, it remained relatively stable during the study period, at between 35% and 41%. We also acknowledge that, as this study focused on patients with UTIs that presented to primary care, our conclusions may not extend to complicated UTIs seen in hospital, nor to UTIs that resolved with over-the-counter medication such as alkalinising agents and did not warrant a GP visit. In addition, although we used the analysis of seasonality in trimethoprim and nitrofurantoin prescriptions as a sensitivity analysis, there are also limitations in using these as proxy for UTI consultation as they do not make up the entirety of prescriptions for UTIs in secondary care.
Clinical implications
Our findings highlight that UTI prevention in the elderly should not only involve avoiding dehydration in these patients during the summer months, but warrants attention throughout the year, as UTIs in this population are common year-round and can be regarded as a symptom of general frailty and poor care. We also provide helpful information for the interpretation of the results of interventions and surveillance reports. For example, a decrease in UTI incidence in spring could be due to the effectiveness of a trialled intervention against UTIs, the seasonal pattern in UTIs, which yearly decrease during this period, or a combination of both, and their effect should be disentangled in order to correctly interpret the intervention effectiveness. Oppositely, an increase in incidence or antibiotic prescription during the autumn should be interpreted in the context of the yearly peak observed during this time.
Further research
Further research should focus on understanding the causes of the peak in UTI incidence during the autumn in those aged 14–69, which could then help select strategies for their avoidance and treatment. The differences in trend between GP consultations and hospital admissions for UTI also warrant further study. This will be important in order to improve the community management of UTIs and prevent unnecessary admissions to hospital in the future.
TRANSPARENCY DECLARATION
None of the authors has any conflicts of interest to declare. The funding bodies had no role in the study design, data collection and analysis, decision to publish, or preparation of the manuscript. The views expressed are those of the authors, and not necessarily those of the funding bodies.
SUPPLEMENTARY MATERIAL
The supplementary material for this article can be found at https://doi.org/10.1017/S095026881700259X.
ACKNOWLEDGEMENTS
This work was supported by a Public Health England (PHE)-funded PhD studentship to A. Rosello. S. Hopkins was funded by the National Institute for Health Research Health Protection Research Unit (NIHR HPRU) in Healthcare Associated Infections and Antimicrobial Resistance at the University of Oxford in partnership with PHE (grant number HPRU-2012-10041) and the National Institute for Health Research Health Protection Research Unit (NIHR HPRU) in Healthcare Associated Infections and Antimicrobial Resistance at Imperial College London in partnership with PHE (grant number HPRU-2012-10047). The remaining authors had no funding to declare.
DECLARATION OF INTEREST
None.


