


Introduction
Considerable effort has been expended in the last few years to collect information that will advance our understanding of the drift and deformation of pack ice. In planning such studies a deliberate effort is usually made to establish the study area far enough from the coast so that the boundary effects associated with the coast can (presumably) be ignored. This is undoubtedly a wise policy in that the effects of land and its associated fast ice are believed to be complex and are certainly poorly understood. Yet in many applied problems it is just this boundary area over the continental shelf between the fast ice and the offshore pack that is of interest. This is particularly true in petroleum exploration in the Arctic where many regions of the continental shelf are believed to have high potential for significant production of oil and/or gas.
To develop such areas in a rational manner requires a solid foundation of geophysical knowledge of the major hazards that will be encountered. In the Arctic offshore these hazards are largely due to the presence of sea ice in one form or another. It is reasonable to assume that offshore development will gradually start at “easy" protected sites within the fast-ice zone. In fact, this has already occurred with the successful exploratory drilling operations that have been undertaken from artificial gravel islands constructed in shallow water (<8 m) in Mackenzie Bay in the western Canadian Arctic. As confidence is gained, operations will gradually move into deeper water within the winter fast-ice zone and ultimately into the seasonal pack-ice zone itself.
Similar developments are expected to occur off the North Slope of Alaska inasmuch as a lease sale in the Beaufort Sea is anticipated in the near future. The present study attempts to acquire some of the geophysical information (i.e. quantitative data on the movement of both the near-shore pack ice and the fast ice) necessary for rational decision making relative to such developmental activities and specifically to delineate some of the hazards that the environment poses to the safety of petroleum exploration and development operations.
Locale
The present study was based at a small camp located on Narwhal Island (see Fig. 1). Additional instrumentation was sited on Cross Island located 19 km to the north-west. These two islands were selected for a number of reasons. First, the geological structures trapping the oil in the Prudhoe Bay field are known to extend out to sea near the study area. Any information gained in the Narwhal Island operation would have immediate applicability to the coming lease sale. The two islands arc representative examples of a large number of similar barrier islands that occur along the coast of the North Slope between Harrison Bay and Demarcation Point. A “sheltered" lagoonal fast-ice environment exists between these barrier islands and the mainland, while north of the islands a narrow belt of fast ice extends to the southern edge of the near-shore pack ice. Cross and Narwhal Islands arc the outermost of the barrier islands and as such they are closest to the pack-ice-fast-ice boundary. This is important in that it is very desirable to observe ice motion some distance into the pack ice. If the base stations had not been located on these outermost islands, we would not have been able to obtain suitable observations on the movement of the pack inasmuch as in 1976 the fast -ice-pack-ice boundary proved to be located much farther from shore than anticipated.

Fig. 1. Map of the Narwhal and Cross Islands area showing the location of the radar transponder sites, the orientation of the x,y coordinate system used in the ice-movement study, the the approximate range of the radar system (taking 37 km as the maximum effective range from a master unit), and the areas of strong X-band radar return as seen by SLAR.
A general impression of the ice morphology in the study area can be gained from examining Figure 1, on which are plotted the areas of strong radar return as observed by X-band SLAR imagery obtained by an aircraft overflight on 11 May 1976. The strengths of X-band radar returns from sea ice are almost entirely a function of the roughness of the upper ice surface. As indicated, a low-return area of essentially undeformed fast ice extends from the coast to a few kilometers north of the barrier islands. At the time of our study this ice was approximately 215 cm thick. The other principal area of undeformed ice is the elongated low-return feature that trends north-west south-east and runs between radar transponders R7 and R8. This is a large refrozen lead that was active until mid-December 1975 as ascertained from infra-red imagery from the DMSP satellite. The areas of high radar return are composed of ice that was primarily deformed when it was quite thin (<30 cm) plus a few small multi-year floes. Again, during the time of the study, this ice was roughly 2 m thick. At the time the SLAR image was obtained, all the ice on which radar transponders were sited was fast.
The water between Narwhal and Cross Islands and the mainland is shallow, with a maximum depth of 7.6 m. Most of the area is Jess than 6.7 m deep and there are several shoals. North of the islands, water depth increases rapidly, reaching 10 m within a distance of less than 1 km. Beyond this the increase in depth is more gradual, with the 20 m depth contour paralleling the islands roughly 11 km farther offshore.
Techniques
The best system to use to study ice movement depends on the sort of motion to be measured. Unfortunately, very little information was available on the movement of either fast ice or near-shore ice along the north coast of Alaska, particularly for the March-June time period. Reference Coachman and BarnesCoachman and Barnes (1961) reported that mean net long-term winter ice-drift rates in the seasonal pack-ice zone in the southern Beaufort Sea were on the order of 2.1-2.6 km/d. The general drift direction was east to west parallel to the coast. Short-term exceptions to the general drift direction can, however, readily be found by examining the tracks of past drift stations (U.S. Polar Research Board, 1976). Whatever the drift direction, the main problem anticipated with the remote pack-ice measurement sites was “keeping" them within range of the on-shore tracking units which commonly require line-of-sight contact.
Even less information was available about the motion of the fast ice along the North Slope of Alaska. The published observations closest to those proposed by the present study were taken by Reference CooperCooper (1975) on the fast ice in Kugmallit Bay, north of Tuktoyaktuk, Canada (located on the north-east side of the Mackenzie Delta). Working in a reasonably protected locale, Cooper observed ice displacements of up to 17 m between January and March 1969. These movements were presumed to be due to the thermal expansion of the ice cover associated with the general warming trend during the time period of the study. It was not known whether the ice movements were gradual or sharp, intermittent or continuous. Because the fast ice north of Narwhal Island was believed to be more exposed to the pressure exerted by the pack than at Kugmallit Bay, we anticipated ice displacements of a similar or greater magnitude.
To study the above problem, a combination of ranging systems was used. Near Narwhal Island a He-Ne laser ranging system with a range of 12 km was used because it had the high resolution required to study the small displacements that were expected. Also the ranges were small enough that severe restrictions due to unfavorable atmospheric conditions were not anticipated. The nominal accuracy of the system is ±5 mm ±2 p.p.m. Eleven targets were used with the farthest target located approximately 7 km from the laser. Readings were taken twice a day when possible. Blowing snow, fog, and severe atmospheric refraction made it impossible to obtain readings on a number of occasions.
For sites located in the pack ice (and far from Narwhal or Cross Islands), a radar transponder tracking system was used that measures distances by using the relatively constant velocity characteristics of X-band (9.4 GHz) energy. The system is therefore not limited by blowing snow, ice fog, or darkness. The base stations or master units were located on Gross and Narwhal Islands, separated by a distance of 19 774 m. The masters transmitted in sequence a coded series of pulses to activate each remote transponder. Once the proper code corresponding to a given transponder was received, the transponder returned a like series of pulses to the master, establishing an RF link. The time required for the RF energy to make the round trip, less any delays, was converted into a distance. To achieve accuracy and stability each reported distance was based on the average of 100 individual readings selected by digital filtering. A set of readings was taken every 4 h and comprised five separate distance determinations from each master station to each remote site. The system was anticipated to have an accuracy of ±2.5 m or better and a resolution of ±0.5 m. Inasmuch as the distance between the two masters was known, the location of the remote transponders was also known (three sides of a triangle).
The effective line-of-sight range of the unit was 80 km. However, the effective range drops significantly because of the curvature of the Earth and pressure ridges which act as transmission obstacles. The range required for this operation depended upon the distance to the fast-ice-pack-ice boundary from the islands, as it was necessary to monitor targets some distance within the pack. As the location of the boundary was unknown, we assumed that it would be at a water depth of 18 m as the boundary had characteristically been observed at approximately this depth at a number of sites farther west along the Beaufort Sea coast (Reference Stringer, Reed and SaterStringer, 1974). Considering that the 18 m isobath was located between 12 and 13 km north-east of the line between Narwhal and Cross Islands, a 30 km range was the minimum that could be contemplated and still have a reasonable area within which a transponder could be reached by both masters. A 40 km range was finally chosen which would allow data to be collected within an “arch-shaped" area located north-east of the 18 m isobath (the base of the arch was almost 60 km wide and the peak was 26 km north of the 18 m isobath). To achieve this range, 45.7 m (150 ft) towers were constructed on both Narwhal and Cross Islands and the outermost transponders were placed on 11 m (36 ft) towers.
Because the wind was believed to be the main environmental factor affecting the motion of both the fast and pack ice, meteorological observations were made at Narwhal Island. Information collected included wind speed and direction (measured at 10 m), barometric pressure and air temperature.
Analysis
Laser stations
The array of laser stations, shown in Figure 2, was operated for varying time periods during the experiment. In all cases, the data are simply the ranges from Narwhal Island to the laser targets. Later, in discussing the radar ranging results, we will use the Cartesian coordinate system oriented as indicated in Figures 1 and 2 with the line between Cross and Narwhal Islands serving as the positive abscissa. Because the abscissa is approximately parallel to the coast and to the 18 m isobath, positive y displacements are offshore while negative y displacements are onshore. Considering the locations of the laser targets in terms of this coordinate system, it is clear that some laser stations primarily measure y components of the motion while others measure x components. Figure 3 shows the motions measured at the five laser stations (L1, L2, L3, L4 and L6) which operated over the longest time period.
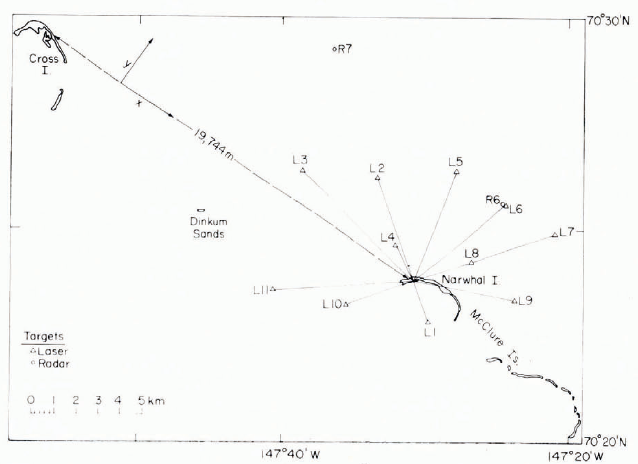
Fig. 2. Map showing the location of the laser targets located around Narwhal Island and the orientation of the x, y coordinate system used in the ice-movement study.
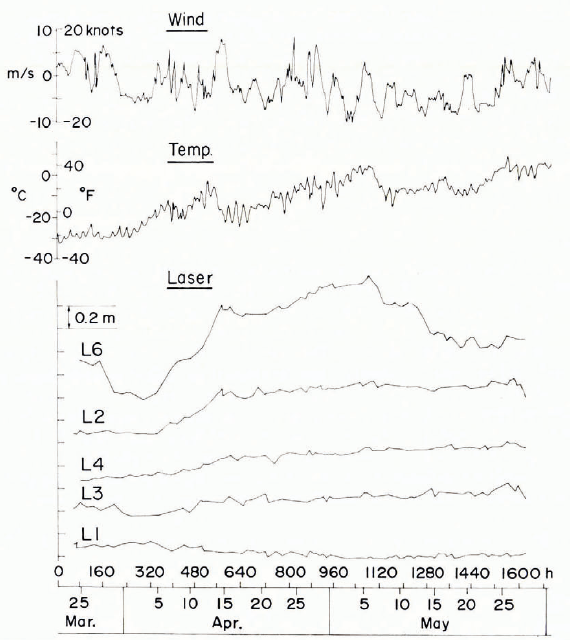
Fig. 3. Relative distances between laser targets and the control station on Narwhal Island, air temperature, and the y component of the wind.
Station L1, which was located on the “sheltered" lagoonal fast ice, showed virtually no detectable movement. Station L3, which primarily measured the x component of motion, showed a very slight increase in distance as a function of time. We consider this to be the result of the thermal expansion of the ice with increasing ice temperature. This thermal effect increases as the lines to the laser targets become more aligned with the y direction (i.e. in the sequence L3, L4, L2, L6) which is the direction of least physical constraint. A strain ellipse based on these data would have its major axis aligned parallel to y. Although L6 shows a major thermal effect, it is not a simple record and shows displacements which are clearly not thermal.
Regardless of the causes of the ice displacements, Figure 3 is believed to be indicative of the scale of motion that can be expected in a reasonably protected fast-ice environment during the early spring (in this case approximately 1 m over a 30 d period).
Radar transponder stations
The locations of the eight radar transponder sites are shown in Figure 1. Two stations were located south of and six stations north of the 18 m isobath which, as mentioned earlier, was expected to be near the pack-ice-fast-ice boundary. We anticipated that soon after our experiment was started gradual break-up of the ice would place one after another transponder in the westward-drifting pack until only R6 and perhaps R7 remained in the fast ice with the fast-ice boundary paralleling the large refrozen lead. These two radar sites would then supplement the information provided by the laser targets, particularly during periods of poor visibility. The movements of the six other radar transponders would characterize the behavior of the near-shore pack ice.
To develop a time series of ranges from the Narwhal and Cross Islands master sites to the different transponders, each individual set of five readings was averaged to give a single value representative of a given transponder at a given time. There are occasional gaps in all the time series for a variety of reasons, chief of which were polar bear attack and loss of propane from the thermoelectric generators. With the exception of stations R6 and R8, these data gaps were sufficiently short that linear interpolation could be used to estimate the missing values. The data were then translated into the Cartesian coordinate system described earlier. This same convention is used for the x and y components of wind.
Cursory inspection of the ice-motion data showed that the anticipated sequence of events relating to the location of the fast-ice-pack-ice boundary did not occur. When the transponders were installed, all sites proved to be within the fast ice. Roughly 15 d later, stations R2 and R3 became part of the pack because of the development of a wide flaw lead that initially ran just offshore of stations R1 and R4 and onshore of station R2. After 2 weeks of drift, showing movements of hundreds of meters, stations R2 and R3 again became part of the fast ice and remained as such until the measurements were terminated.
Fast-ice stations
In discussing the behavior of the fast-ice radar transponder stations; analysis will be confined to stations R1, R4, R5 and R7 because extensive temporal gaps exist in the data from stations R6 and R8, rendering them less useful. The data set consists of 427 x and y coordinates for each station taken at 4 h intervals over a period of 71 d. The apparent ice movements as recorded lay the transponder system consist of two components, real movements and system fluctuations. In turn, the system fluctuations include short- and long-term systematic thermal effects and random noise, while real ice movement includes long-term thermal effects, wind-induced movement, random movement and perhaps current-driven movement. To obtain an understanding of the limitations placed on the radar data by instrumental noise, a transponder was placed on Narwhal Island (providing a constant distance) and ranges were obtained to it from Cross Island. This record is shown as part of Figure 5 with the temperature trend removed (as the instrument becomes warmer, it reports slightly shorter distances). The de-trended record has a standard derivation of ±0.45 m. In the following we will be conservative and only consider deviations of >2 m from the trend of the data to be signal instead of noise.
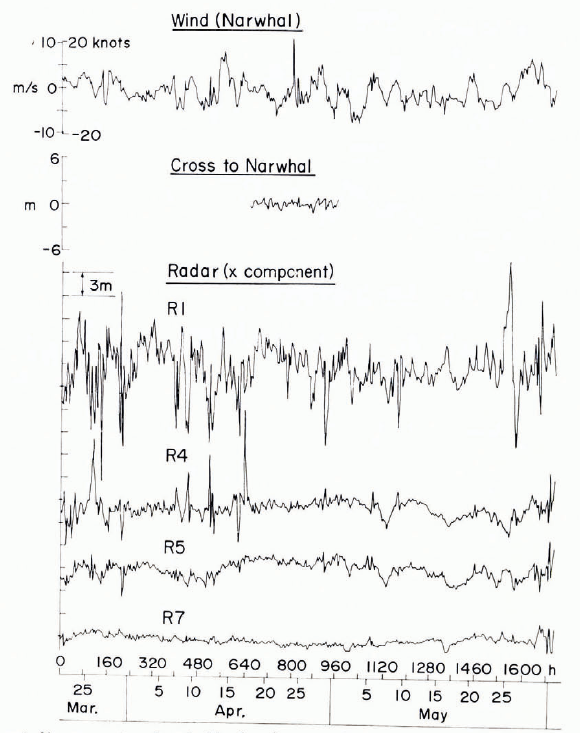
Fig. 5. x component of ice movements as determined by the radar system, the x component of the wind, and the radar record of a fixed distance, between Cross and Narwhal Islands.
Table I summarizes some statistical parameters calculated from the radar time series. The general negative slopes of the distance versus time plots are believed to be the result of the decrease in the apparent distance measured with increasing instrument temperature (there was a steady rise in ambient temperature during the study period (see Fig. 3 or 6)). Station R7 appears to be an exception in this regard.
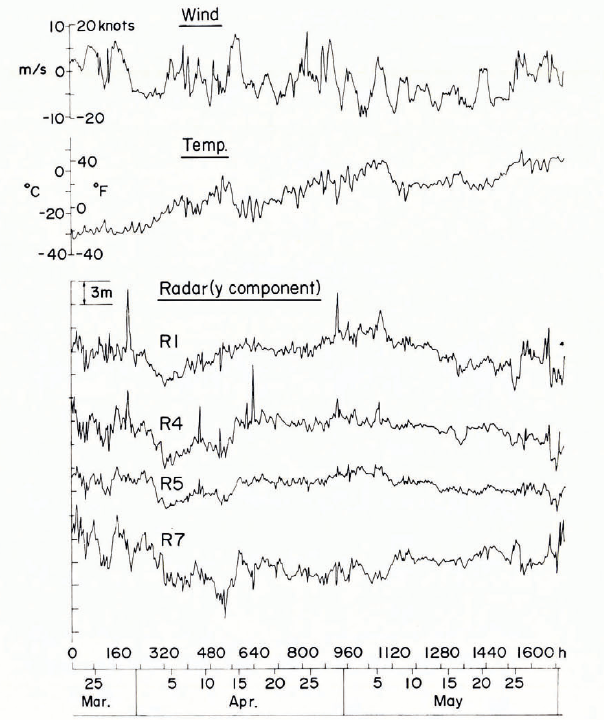
Fig. 6. y component of ice movements as determined by the radar system, they component of the wind, and the air temperature.
TABLE I. STATISTICAL INFORMATION ON FAST-ICE STATIONS AS DETERMINED BY THE RADAR TRANSPONDER SYSTEM
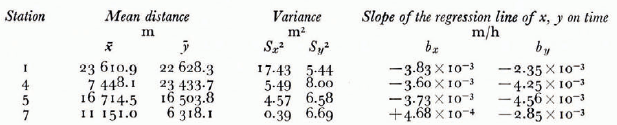
Figure 4 shows the power spectra of the x and y coordinates for station R1. Each spectrum shows a large peak at 24 h and a lesser peak at 12 h. The 24 h peak, which occurs in the spectra of all the fast-ice stations, is believed to be the result of the response of the measurement system to diurnal temperature changes. The 12 h peak is now believed to be the result of some other contributing factor such as the tidal cycle, because it does not follow the 24 h oscillation exactly either in phase or in amplitude and is not present on the power spectrum obtained from the measurements of the fixed-distance record between Cross and Narwhal Islands.
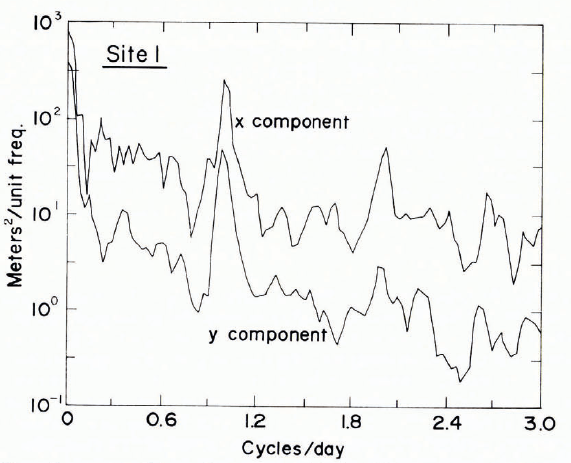
Fig. 4. Power spectra of the x and y components of the observed ice movements at station R1.
Figures 5 and 6 show the x and y components of motion for the fast-ice stations as well as the x and y components of the wind as recorded at Narwhal Island. Air temperature is also presented in Figure 6. Note that, although the time axis is plotted on the same scale used in presenting the laser data, the displacement is now in increments of 3.0 m as opposed to 0.2 m. The displacement data as shown have been de-trended and band-pass filtered to remove the 24 h cycle. The 12 h cycle, which is not strong in most records, has not been removed. Consider first the x component of motion shown in Figure 5. Clearly there is no striking correlation with the x component of the wind. There also do not appear to be any striking similarities between the records from the different stations. Although the correlation coefficients shown in Table II are uniformly low, the correlation coefficients that are in italics are significant at the 1% level.
TABLE II. CORRELATION COEFFICIENTS BETWEEN THE ICE MOTION AS DETERMINED BY THE RADAR TRANSPONDER SYSTEM AND THE WIND. VALUES IN ITALICS ARE SIGNIFICANT AT THE 0.01 LEVEL
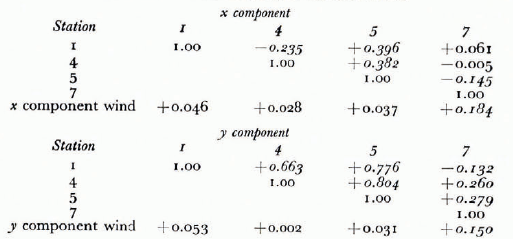
Two different types of motion are discernible in Figures 5 and 6, long-period movements occurring over periods of days and short-period movements occurring over periods of less than 4 h. The y components of the ice movements have a much higher correlation with each other than do the x components. However, despite these high internal correlations, there is no significant correlation with the wind except for station R7. This station is closer to Narwhal Island than the other stations with complete position records and therefore the higher correlation was not unexpected. The generally low correlations were, however, disappointing. It is our impression that many times during this study sharp meteorological gradients existed normal to the coastline.
When the plots of the y components are compared with the temperature data, it can be seen that in the central part of the study period the general increase in the values of y follows the general rise in temperature. This is believed to be due to the thermal expansion of the ice cover as was observed in the laser measurements. It should be noted that this trend is opposite in sense to the system’s response to the temperature rise. The observed expansion is on the order of 6 m at a range of up to 30 km over a time period of weeks. During the latter part of the radar records there is a reversal of this trend as the distance to the transponders decreases. This is also believed to be the result of the gradual warming of the ice cover inasmuch as the sign of the coefficient of thermal expansion changes from negative (expansion on warming) to positive (contraction on warming) as the ice temperature rises above roughly —8°C (Reference AndersonAnderson, 1960). This effect is not nearly so pronounced in the shorter laser lines, although there is also a general stop to the expansion in those data.
A particularly interesting aspect of the radar data is the sharp elastic-like events that occur at a number of places in the records. By this we mean that when an event occurs it is of short duration, with the ice rapidly returning to roughly its position prior to the excursion. As we discussed earlier, the smaller fluctuations in measured distances (less than ±0.5 m) are probably noise. However, we believe that the large deviations (>2 m) from the trend of the data are definitely real. The records contain one event with a 12 m displacement and several with 9 m displacements, Figure 7 shows that the standard deviation of the x component of the ice displacement increases sharply as the reporting station becomes further offshore. In this figure we have included the Sx values calculated from stations R2 and R3 for the time periods that they were part of the fast ice. The y component of the displacement does not show a similar trend; the standard deviation remains approximately constant with a value of 2.5 m.
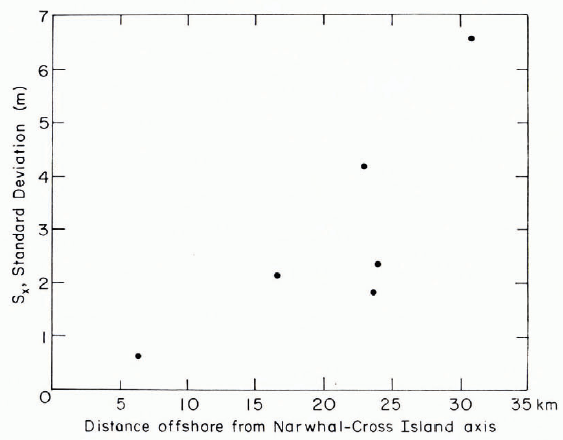
Fig. 7. Standard deviation of the x component of the ice movement versus the distance of the measurement site offshore from the Cross Istand-Narwhal Island axis.
Pack-ice stations
The x and y components of the observed displacements for stations 1 and 3 are shown in Figure 8 along with the y component of the wind. During much of the period both stations were part of the fast ice and showed movements similar to the other fast-ice stations. (These fast-ice movements are obscured in Figure 8 because of the compressed scale.) However, during a 3 week period in April, major ice movements did occur. The overall correlation of these observed displacements with the local wind was not significant. It should be noted that the major positive ice motion occurred near the end of a period of maximum positive winds and also that the major negative ice motion occurred during a maximum in the onshore winds. However, during other periods of almost equally strong winds, no permanent displacement occurred. This suggests that no adequate model for predicting the movement of the near-shore pack ice can afford to neglect the lateral transfer of stress through the ice. Therefore, local models can only succeed if handled as part of a regional model. This comment is particularly applicable to the time period covered by this study when the general ice conditions in the Beaufort Sea were very tight and maximum lateral transfer of stress was to be expected.
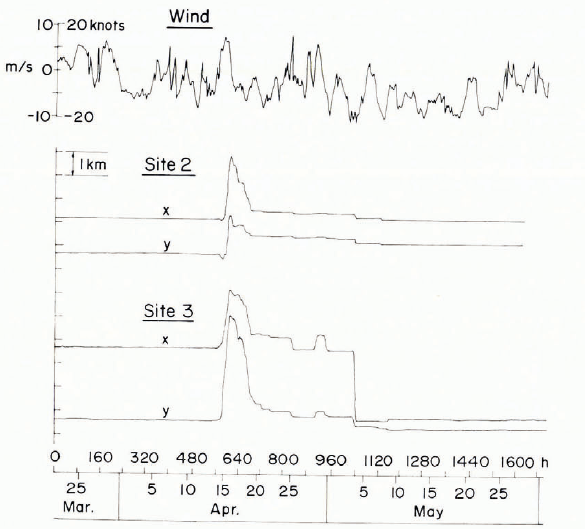
Fig. 8. x and y components of the movement of stations RI and R3 and the y component of the wind.
Surprisingly, the net ice drift during the period of study was negligible (we did not have to relocate a single tower). It was also interesting how stations 1 and 3 started out as part of the fast ice, transferred to the pack, and then returned to the fast-ice cover.
Finally, at no time during the study did the location of the fast-ice-pack-ice boundary correspond even approximately to the location of the 18 m isobath. The boundary was usually located over water that was 30 m of more deep.
Conclusions
Laser observations of the movement of fast ice at sites close to Narwhal Island show long-term changes in the distance to targets located on the ice that are believed to be primarily the result of the thermal expansion of the sea ice. The main displacements were outward normal to the coast (in the least constrained direction). The maximum net displacement was approximately 1 m with short-term changes of up to 40 cm occurring over 3 d periods.
Radar transponder records of the movement of fast-ice sites located farther offshore from the barrier islands do not permit the study of such small motions because of noise in the measurement system. However, these records show many large displacements, with the standard deviation measured parallel to the coast increasing systematically with distance offshore, reaching a value of ±6.6 m at 31 km. Short-term ice displacements of as much as 12 m occur at the sites farthest from the coast. The observations also show systematic changes in line length (up to 6 m over a distance of 30 km) that are also believed to be the result of thermal expansion of the ice. Correlations between the wind and the ice movement are only appreciable for movements normal to the coast.
Radar targets located within the pack ice show large short-term movements (up to 2.7 km) but negligible net displacement along the coast. There was no significant correlation between the movement of the pack and the local wind, suggesting that models for predicting coastal ice conditions can only succeed if they are handled as part of a regional model which incorporates the lateral transfer of stress through the pack ice.
Offshore from Narwhal and Cross Islands the fast-ice-pack-ice boundary was usually located (during March-May 1976) in 30-35 m of water as opposed to 18 m of water where it has commonly been observed at sites farther west along the Alaskan coast.
We stress that the results presented here are based on observations during only a 3 month period (March-May) in the spring of 1976. We caution against the generalization of these results to other times or locales.
Acknowledgements
This program was part of Research Unit No. 88 (Dynamics of Near-Shore Sea Ice) carried out by CRREL for the NOAA/BLM Outer Continental Shelf Environmental Assessment Program. We should like to thank Cecilia Dessert for her assistance in the data analysis and John Kelly for helping install and operate the Narwhal Island camp. We also should like to thank Jon M. Barnhill, Donald Winter, and Roy DeHart for the excellent helicopter support that they provided.
Discussion
H. ITO: What is the accuracy of the radar positioning system?
W. F. WEEKS: The accuracy appears to be roughly 0.5 m and would be expected to be largely independent of the length of the line surveyed.
ITO: How did you correct for tidal effects?
WEEKS: Tides in our study area are very small (≈0.25 m). Therefore we did not lake them into account.
ITO: What is the maximum range of the system?
WEEKS: The radar transponder system has a range of 80 km. However, because of the Earth’s curvature and the height of our towers, we were only able to range on targets that were within 37 km.
T. CARSTENS: There is a striking superficial similarity between the shear zones I have observed in lake “pack" ice originating from frazil, and the corresponding shear ridges along Arctic coasts such as the Alaskan Beaufort Sea coast. Do you feel that the analogy between this particular lake-ice process and the movement of Arctic pack can be made use of in a general model, in spite of the large differences in scale?
WEEKS: One undoubtedly can learn many useful things that are applicable to sea ice from the study of drifting lake or river ice. However, before we can begin to draw analogies with any sort of confidence, we need good observational data on all these ice types Therefore, I encourage you to collect any such data that you can obtain with the confidence that even if it does not prove to be directly applicable to sea ice it will ultimately prove to be useful in its own right.
P. R. KRY: The fact that absolute displacements increase with distance from the shore (or barrier islands) implies that perhaps the strain is constant; or that the fast ice may be considered to be a plate fixed at the shore. Is this reasonable?
WEEKS: The idea that the strain is roughly constant may prove to be correct. However, the fast ice does not act as a simple hinged rigid plate fixed at the shore inasmuch as the motions parallel to the shore are not particularly well correlated with each other.
K. R. CROASDALE: I am interested in your comments about the boundary of the fast ice. Could one define the edge of the fast ice to be where the lead opens up under the action of off-shore winds? If so, at what water depth was this? It may be of interest to note that off the Mackenzie Delta the edge of the fast ice follows the 20 m isobath fairly closely.
WEEKS: Some of the time there was quite a wide lead at the outer edge of the fast ice. At other times this lead was closed and the fast- and pack-ice areas were presumably separated by a zone of ridging. The boundary was commonly located at a water depth of 30-35 m.
J. W. GLEN: How do you reconcile your final recommendation that people with a sea-ice problem must go out to the site itself with Dr Weeks’ point in his review paper that sea-ice studies are usually best not conducted in the field?
WEEKS: It depends upon the type of problem. In the area of engineering properties one should do comprehensive sets of tests in the laboratory and determine how the state variables (temperature, composition, grain-size, etc.) influence the properties. Then all one need do in the field is roughly characterize the state variables and pick the correct property value off a graph. In other areas of interest such as ice drift we currently need good observational data. I see no way to predict from first principles or to model the sort of motions one might expect at the edge of a sheet of fast ice without first having observational data. Once we know what actually happens, then we can set out to develop models to explain and extrapolate our observations.
GLEN: Regarding your observations of ice motion; if it is not a strain phenomenon, is it a random-walk one ? There seemed to be less net motion than a square-root law would suggest, with some stations appearing to return home after their excursions. Was this fortuitous?
WEEKS: I believe that the return of the radar transponders to almost exactly their initial positions was largely fortuitous. This was, of course, favoured by the fact that the ice in the Beaufort Sea was tight, allowing very little motion.
L. W. GOLD: Has any progress been made in the development of a classification for sea ice?
WEEKS: The most detailed recent work on the overall structure of sea ice is by N. .V Cherepanov. However, he has not attempted a formal structural classification such as that of Ramseier and Michel for lake ice. I am not certain that it would prove profitable to propose such a classification until we know a bit more about what we are attempting to classify.


