Very high doses of fructose alter human hepatic insulin sensitivity and increase lipogenesis. However, the relevance of these data to population consumption is unclear. The objective of this work is to develop a predictive, multi-scale model of human hepatic monosaccharide transport, signalling and metabolism. This computational model will be used to predict the regulatory and metabolic outcomes to physiological levels of glucose and fructose in healthy and fatty liver.
Utilising quasi steady state Petri nets (QSSPN)(Reference Fisher, Plant and Moore1), the aim of this work is to build a multi-scale model composed of: (i) the HepatoNet1(Reference Gille, Bölling and Hoppe2) liver-specific genome-scale metabolic network constrained by in vitro flux measurements; (ii) a model of insulin signalling created by integration of published kinetic models; and (iii) prediction of monosaccharide transport and metabolism, and triacylglycerol production. Alongside this, an immortalised hepatocyte cell line, HepG2, was used to provide in vitro data to experimentally validate in silico predictions. Both insulin sensitivity (n 3–4) and sugar in culture medium (−/ + 100 nM insulin; n 3–5) were measured and analysed by one- and two-way ANOVA followed by Dunnett's and Sidak's test post hoc, respectively.
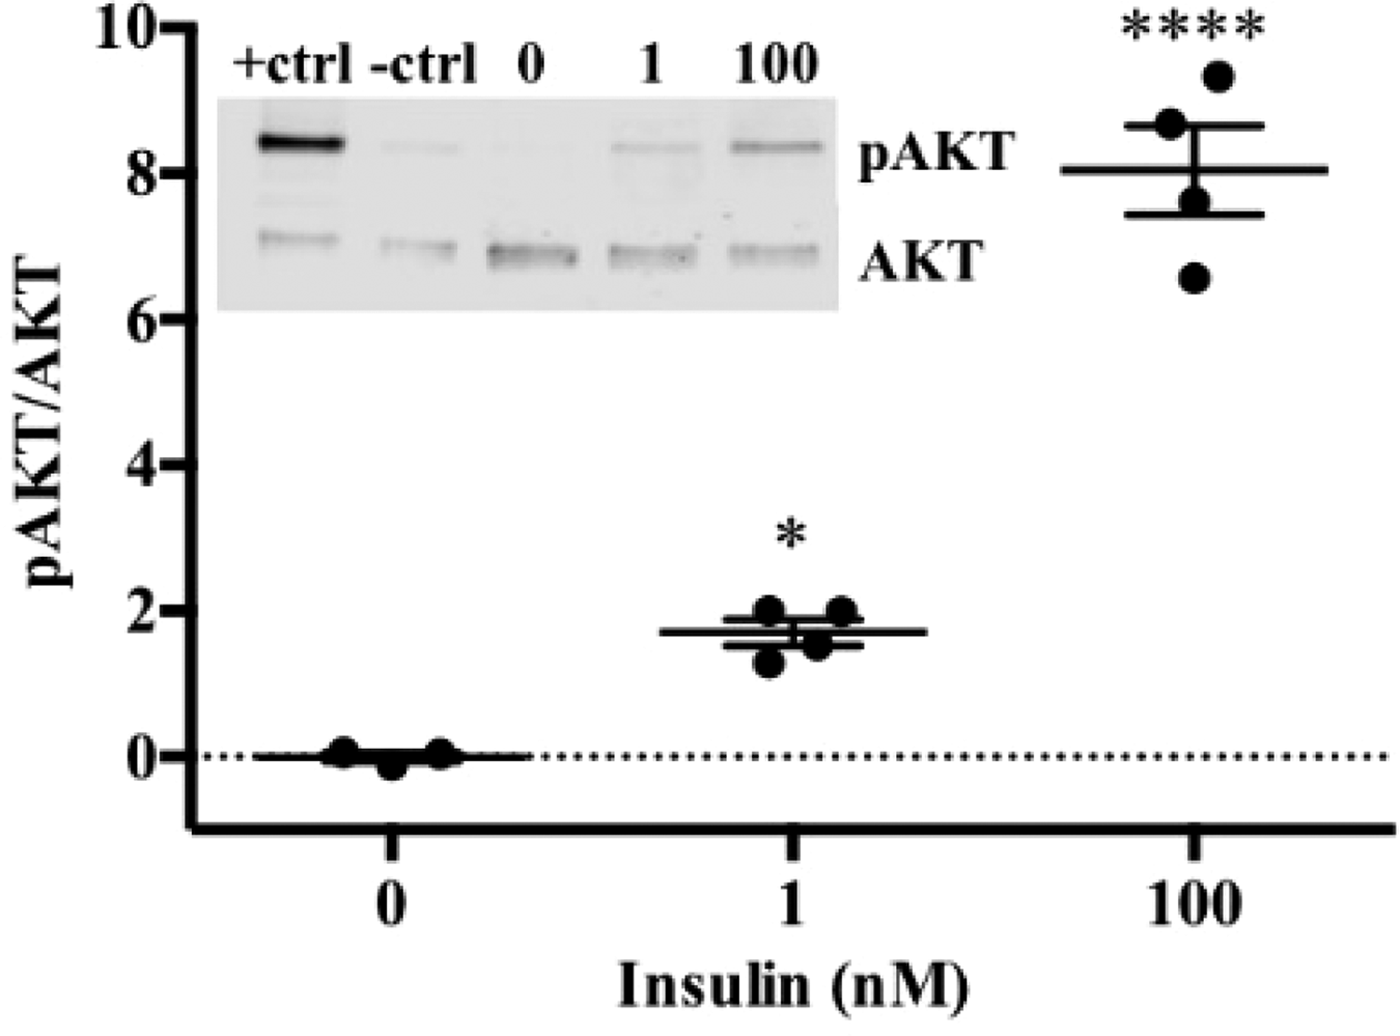
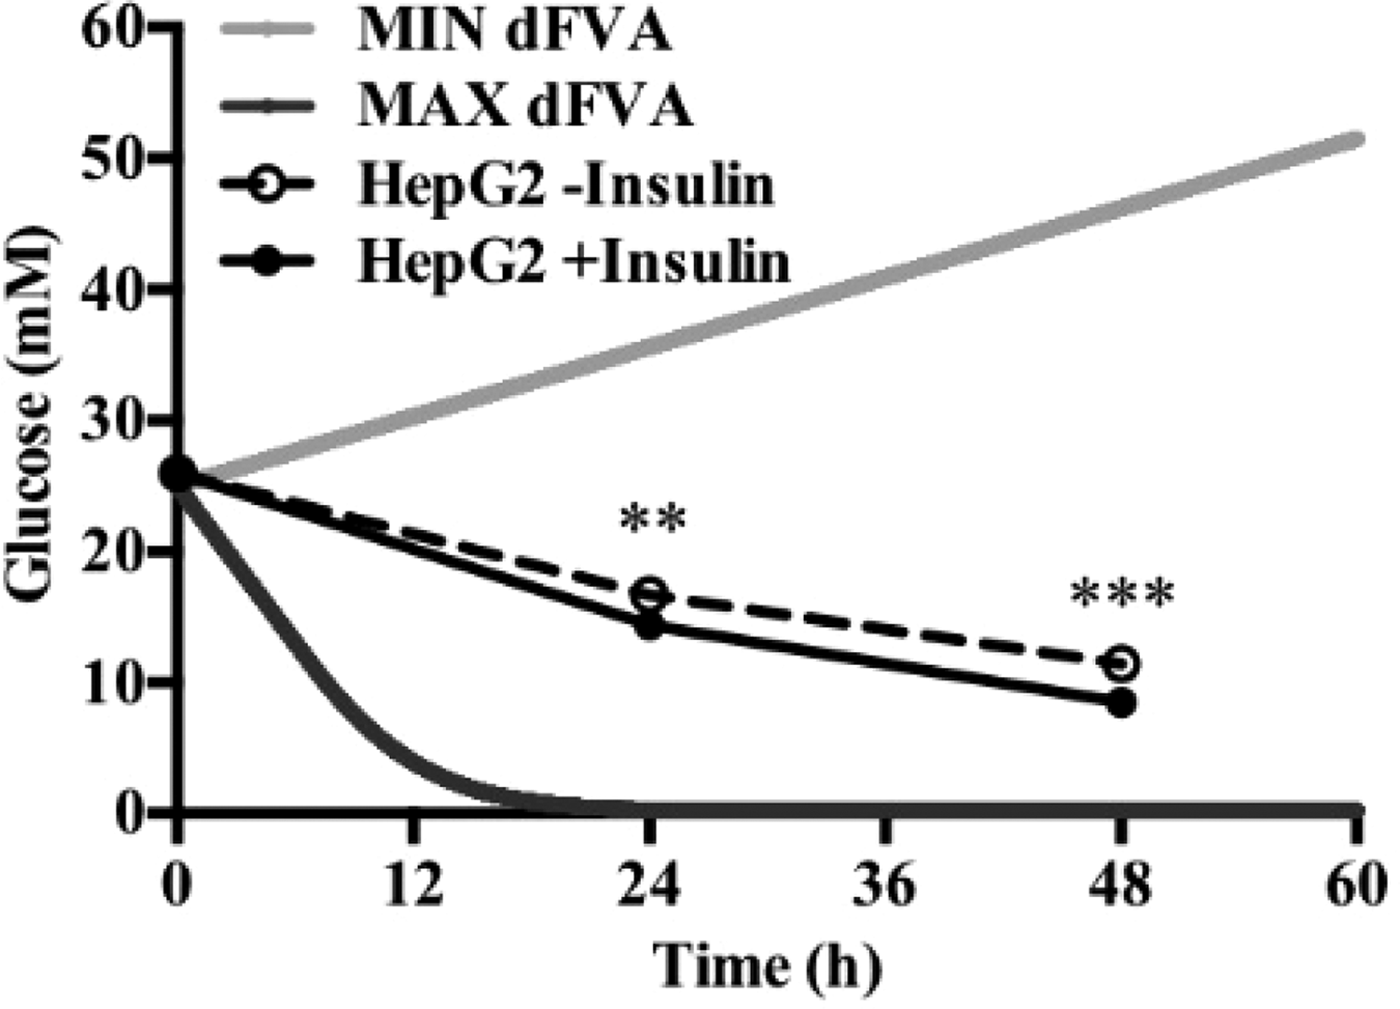
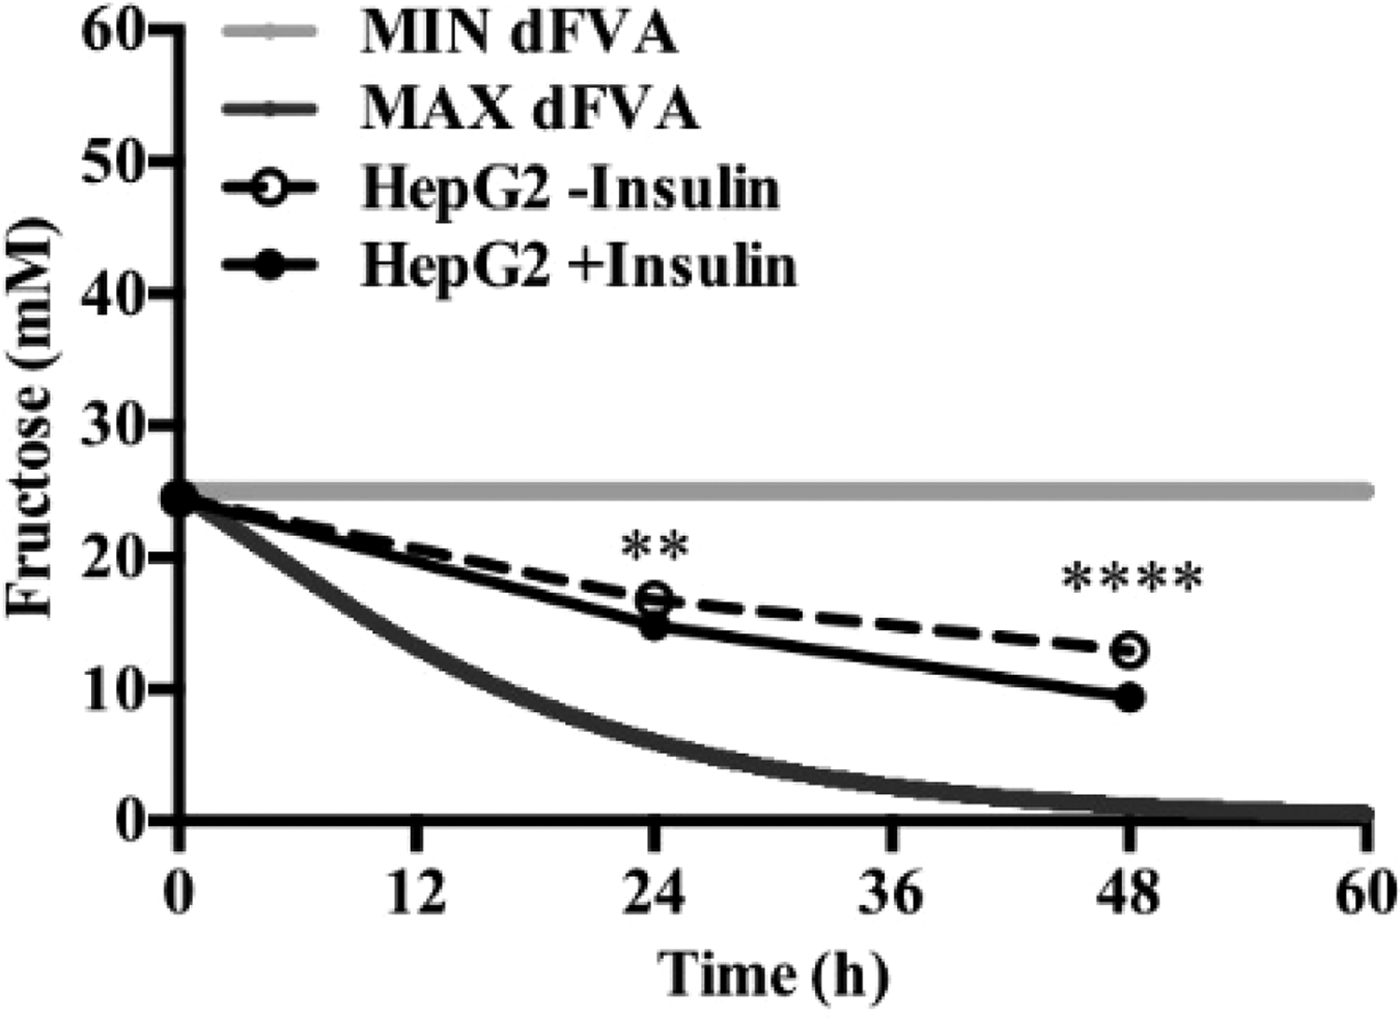
To date, we have reconstructed a dynamic regulatory network of hepatic glucose and fructose transport in Petri net formalism and integrated this with HepatoNet1 constrained by in vitro data(Reference Jain, Nilsson and Sharma3). Together with our newly proposed computational analysis approach, ‘dynamic flux variability analysis’ (dFVA), simulations have predicted minimum and maximum transport rates allowing the calculation of extracellular glucose (Fig. 2) and fructose (Fig. 3) concentrations over time, while also satisfying the demands of a ‘healthy hepatocyte’. Insulin sensitivity was confirmed in HepG2 cells with a 1·7-fold increase (P = 0·037) of pAKT/AKT expression in response to postprandial levels of insulin (Fig. 1). HepG2 medium glucose and fructose concentrations were found to be within the predicted dFVA range (Fig. 2–3). In addition, a significant increase of sugar uptake was seen in insulin-treated versus untreated cells. Preliminary QSSPN simulations have been successful at replicating the results of a published kinetic model of hepatic insulin signalling(Reference Kubota, Noguchi and Toyoshima4).

Fig. 1. HepG2 pAKT/AKT.

Fig. 2. Extracellular glucose.

Fig. 3. Extracellular fructose.
In conclusion, we reproduced in vitro hepatic monosaccharide uptake in our in silico model. Future work will integrate the regulatory insulin signalling network to the metabolic network to predict the outcomes of insulin regulation on sugar and lipid metabolism in response to physiological levels of glucose and fructose in healthy and fatty liver.


