


Introduction
When a floating ice cover acts against a structure it can be assumed that in certain circumstances the ice in the contact area is under a condition of plane strain. One such example is where an ice cover is in uniform contact with a long straight wall. Both model studies in the laboratory and field observations indicate that the zone in front of a pile is also in a confined loading state, if not in a perfect state of plane strain (Reference Hirayama, Hirayama, Schwarz, Wu and FrankensteinHirayama and others, 1975; Reference Croasdale, Reed and SaterCroasdale, 1974). Theoretical studies of ice forces on structures have indicated that the existence of the plane-strain condition would be a significant factor in determining design ice loads (Assur, [1972]). Information on failure strength under biaxial loading is also required in the evaluation of yield criteria postulated for ice (Reference Reinicke and RalstonReinicke and Ralston, 1976).
This paper presents results of observations on the strain-rate dependence of the plane-strain compressive strength of ice having both anisotropic (columnar-grained ice) and isotropic structure (granular snow ice). The strength and deformation behaviour of the two ice types for the plane-strain condition are compared with each other and with that for the uniaxial case. The apparatus used and special measures taken to simulate the idealized load condition are described.
Description of Tests
Apparatus
Plane strain has been defined as a condition where flow is everywhere parallel to a given plane and independent of position normal to that plane (Reference HillHill, 1950). Stated another way, the strain in one of the coordinate directions should be zero; but in practice this ideal is difficult if not impossible to achieve. For the present investigation the apparatus was constructed so that strain in the confined direction was one-tenth the value it would have in uniaxial loading.
The sub-press constructed to produce this condition of “plane-strain” compressive loading is shown in Figure 1. Passive confinement of a right rectangular prismoidal specimen on two opposite faces generated this loading condition. The actual degree of confinement achieved will be discussed in the following section.
The distance between the confining sides of the sub-press was fixed at 101.2 >mm; they were parallel to better than 0.02 mm, perpendicular to the bottom surface of the portal, and finished by surface grinding. Actual dimensions of the sub-press are shown in Figure 2.
A universal test machine of 100 kN capacity was used to apply loads to the sub-press. The machine has a stiffness of about 100 MN/m and is capable of cross-head rates ranging from 0.83 X 10⁻⁵ to 0.83 mm/s. Linearly variable differential transformers were used to measure motion of the upper platen and lateral expansion between the confining columns.

Fig. 1. Plane-strain compression sub-press in test machine.
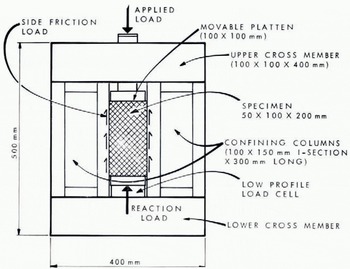
Fig. 2. Schematic of plane-strain compression sub-press.
The load cell in the test machine measured the load applied to the upper platen. Continuous records of load and deformation were made during each test.
A previous study (Frederking, unpublished) had indicated that friction between the specimen and the confining columns could affect the observed strength values, and a technique was developed to determine whether this was so. It involved placing a low-profile load cell at the bottom of the sub-press opening (Fig. 2) to measure the load applied to the bottom of the specimen independently of that applied to the top. The difference between the two loads would equal the net friction force developed on the confined sides of the specimen. These observations showed that friction influenced the results, and measures were therefore devised to reduce its effect. Thin sheets of various polymer materials placed between the specimen and the confining sides of the sub-press proved to be satisfactory in reducing friction effects to an acceptable level.
Specimen preparation
Tests were performed on columnar-grained ice, with axes of crystallographic symmetry tending to be perpendicular to the long axis of the columnar grains, and on granular-snow ice with random orientation of the crystallographic symmetry axis. The two ice types are referred to as S-2 and T-1, respectively, according to the classification of Reference Carter and MichelMichel and Ramseier (1971). S-2 ice was grown from the local drinking-water supply in a cold room with an air temperature of — 10°C. Average grain diameter on a plane perpendicular to the long direction of the columnar grains was 5 mm; density was in the range 910 to 917 kg/m3. The T-1 ice was recovered from a naturally formed ice cover of a local water body. Because of the manner in which snow ice is formed there was some banding, i.e. the grain size was uniform in the plane of the ice cover but varied with depth. Grain diameter was 1 to 2 mm, and density in the range 860 to 890 kg/m3. Small grain-size was generally associated with higher density. Specimens that did not fall within these ranges of density were rejected.
Specimen preparation, storage, and testing all took place in a cold room in which the temperature was maintained at —10±0.1°C. The specimens were right rectangular prisms with nominal section of 50 mm X 100 mm and length 200 mm. Two types of specimen were prepared: A-type in which the loading and confining directions were in the plane of the surface of the ice cover, and B-type in which the loading direction was in the plane of the ice cover and the confining direction was normal to that surface (Fig. 3). The confined sides of the specimen had to be machined precisely (to better than 0.02 mm) so that they would fit exactly into the sub-press portal. This was accomplished on a large commercial milling machine with special jigging techniques and, most important, skill and care on the part of the machinist.

Fig. 3. Schematic of two specimen types (the 1- and 3-coordinate directions are perpendicular to the direction of growth).
Test procedure
The sub-press was used in two modes: a confined one yielding plane-strain compression and an unconfined one yielding uniaxial compression. In the plane-strain mode the 50 mm X 200 mm faces of the specimen were in contact with the side walls of the sub-press opening. For the uniaxial mode the specimens were rotated 90° about their long axis in order to avoid contact with the sides of the cavity. The uniaxial mode provided base-line data so that plane-strain and uniaxial compressive strength could be compared. In both the plane-strain and uniaxial mode no rotation of the loading platens was permitted, i.e. the platens were initially parallel and remained so during the test. Load was applied to the specimen at a nominally constant rate of cross-head motion until the specimen was crushed, in cases of brittle failure, or until a strain of about 2% was reached in cases of ductile failure.
Results
Treatment of data
Very simple definitions of stress, strain and strain-rate were used for analysing the results. Stress is given by
where P is the applied load and A the initial cross-sectional area on which it is applied. Strain is given by
where u is the deformation and l 0 is the initial length over which deformation was measured. Strain-rate is given by
where ![]() it is the deformation-rate and 1
0 the initial length over which the deformation-rate was measured. The coordinate directions for stress, strain and strain-rate are indicated in Figure 3. Strength is defined as the maximum stress measured during a test and strain-rate at yield is defined as the corresponding strain-rate at maximum stress.
it is the deformation-rate and 1
0 the initial length over which the deformation-rate was measured. The coordinate directions for stress, strain and strain-rate are indicated in Figure 3. Strength is defined as the maximum stress measured during a test and strain-rate at yield is defined as the corresponding strain-rate at maximum stress.
To evaluate friction effects, load on both top and bottom of the specimen was measured (Fig. 2). The average stress applied to the top of the specimen is σa and the average stress on the bottom, σr. Strength and stress values in this paper are the average of σa and σr, unless otherwise noted. The average shear stress developed on the sides of the specimen as a result of friction with the confining columns of the sub-press is determined from the difference between stresses σa and σr.
Columnar-grained ice, type S-2
Figure 4 presents the results of an earlier investigation during which the effect of friction was not taken into account. Five preliminary measurements to demonstrate this effect are also included. Each result involves two data points joined by a curved line; the lower point is σr and the upper, σa. The difference between the two stresses increased with increasing strain-rate from about 15% to about 40% of the applied stress.

Fig. 4. Preliminary results of strain-rate dependence of strength; S-2 columnar-grained ice, — 10°C (Frederking, unpublished).
A series of tests was carried out to evaluate the effectiveness of various friction-reducing materials. Polytetrafluoroethylene of 0.20 mm thickness and polyethylene of 0.15, 0.10 and 0.05 mm thicknesses were tried (Table I). It may be seen that polyethylene is more effective in reducing friction (to less than 5% of the total applied load), but that film thickness in the range investigated has no significant effect. Surprisingly, polytetrafluoroethylene is less effective. Based on these evaluations a 0.15 mm thick polyethylene film was used as the friction-reducing material for the plane-strain compressive loading condition in the current series. Two other conclusions can be drawn. First, the average stress where no friction-reducing material is used is a reasonably accurate measure of the average plane-strain compressive strength. Second, the strength of the small-grained (1-2 mm) S-2 ice is about 15% greater than the medium grained (5 mm) S-2 ice.
Two types of specimen were used to obtain the results presented in Figure 4: A-type and B-type as described earlier. They were tested under two loading conditions: uniaxial compression and plane-strain compression. The strength for the A-type specimen with loading and confining directions in the plane of the ice cover was substantially greater for plane-strain compression than for uniaxial compression. For the B-type specimen (loading direction in plane of ice cover and confining direction normal to the surface of ice cover) there was no difference in strength for the two loading conditions. The results for plane-strain compression of the A-type specimens can only be considered in a qualitative fashion because no corrections for the effect of friction can be made on them. It is clear, however, that the anisotropic structure of type S-2 ice has a substantial effect on its plane-strain compressive strength.
Table I. Evaluation of Friction-Reducing Materials, S-2 Columnar-Grained Ice, 3.33 X 10⁻³ mm/s Cross-Head Rate

The strain-rate dependence of strength (mean of σa and σr) for type A specimens in the current test series is presented in Figure 5. Plane-strain compressive strength is greater than uniaxial compressive strength by a factor of about four at a strain-rate of 10-7 S-1 and a factor of two at a strain-rate of 10-4 S-1. In this range of strain-rates the deformation behaviour was ductile, with the exception of one test result noted in Figure 5. Uniaxial compression tests at - 10°C indicate that as strain-rate increases from 10-4 S-1 to 10-3 S-1 behaviour changes from ductile to brittle, and that maximum measured strengths occur in this range (Reference GoldGold, 1973).

Fig. 5. Strain-rate dependence of strength (friction corrected); S-2 columnar-grained ice, A-type specimens, -10°C.
Although it was not possible to carry out plane-strain compression tests at strain-rates higher than 2 X 10⁻⁴ S-1 owing to limitations in the power capacity of the test machine, it is probable that the transition from ductile to brittle failure occurs at about the same strain-rate as for the uniaxial load condition.
The equation

where ?0 is an arbitrary constant and σ0, and α are constants (determined from a regression analysis), was fitted to the data. Figure 5 presents the best-fit lines for the two sets of data. The equation of the line, for the uniaxial case (with a correlation coefficient of r = 0.99), is

and for the plane-strain case (with a correlation coefficient of r = 0.96)

These expressions are applicable only for the range over which they have been determined, i.e. strain-rates from 10-7 S-1 to 10-4 S-1.
Stress-strain curves for plane-strain compressive loading at several strain-rates are presented in Figure 6. As strain-rate increases there is an increase in the strain associated with yield stress. For purposes of comparison a uniaxial compression loading curve for strain-rate 1.67 X 10⁻⁵ S-1 is also plotted. It shows that the strain at failure for the plane-strain case was about three times that for the uniaxial case. In general, at all strain-rates the plane-strain yield strain was greater.
Visual and auditory observations of crack formation were made during the course of each test. For both uniaxial and plane-strain compression, cracking activity in S-2 columnar-grained ice during the initial portion of load application was similar, i.e. vertically aligned cracks running parallel to the direction of the long axis of the grains formed and eventually coalesced in shear bands running between opposite corners of the specimen. Audible sound was associated with the formation of each crack. The appearance of these shear bands coincided with the maximum stress in uniaxial compression. For plane-strain compression, however, the lateral confinement of the sub-press forced the ice to deform in the long direction of the grains. As stress increased, cleavage cracks formed and propagated in a plane perpendicular to the long axis of the columnar grains; the sound associated with their formation was distinctly different from that of the initial cracking. The maximum compressive stress observed was associated with extensive development of such cracks. Similar cleavage cracks have been observed in the field (Reference Haynes, Haynes, Nevel and FarrelHaynes and others, 1975; Szhwarz, unpublished). At this point the specimen was no longer transparent but had a uniform, white, translucent appearance. At very low strain-rates, less than 10-6 S-1, it developed a cobble-stone appearance that could be explained by slip on the crystallographic planes within individual columnar grains. Figure 7 shows the extremely textured surface of a specimen that has undergone a 1.5% strain at a rate of 1.67 x 10⁻⁷ S-1.

Fig. 6. Plane-strain compression deformation behaviour; S-2 columnar-grained ice, A-type specimens, — 10°C (dashed line indicates uniaxial compression, ? = 1.67 × 10⁻⁵ S-1).

Fig. 7. Textured surface produced by plane-strain deformation of S-2 columnar-grained ice, strain-rate 1.67 X 10⁻⁷ S-1 strain 0.015.
As mentioned earlier, the sub-press was designed to reduce strain in the confined direction to one-tenth the value it would have in unconfined compression (assuming isotropic elastic behaviour for the ice and a Poisson ratio of 0.33). During tests to evaluate the effect of varying thicknesses of polyethylene sheets, displacement transducers were mounted across the confining columns of the sub-press (Fig. 1). Deformation in the confined direction (1-coordinate direction) was measured at the mid-point so that the average value of ε1 would be somewhat less. The results of these measurements are presented in Table II. Both strength (i.e. maximum stress) and corresponding strain at yield were very similar for the four cases. The confined strain, ε1, was about three times that predicted from the original assumptions. The following could account for the discrepancy: (1) The sub-press was not so stiff as had been assumed because the confining columns were attached to the cross-members by bolts that deformed elastically during the test. (2) The ice did not behave as had been assumed and probably had a higher effective Poisson ratio than 0.33.
Table II. Measurements of Confinement Achieved by Sub-Press, S-2 Columnar-Grained Ice, 3.33 X 10⁻³ mm/s Cross-Head Rate

Granular-snow ice, type T-1
Twenty tests were carried out on T-1 ice: eight uniaxial and twelve plane-strain compression. For all the plane-strain compression tests 0.15 mm polyethylene sheets were used to reduce friction on the confining sides of the sub-press. The difference between σa and σr was in all cases less than 4% and generally less than 1%; results of the tests are presented in Figure 8. Both A- and B-type specimens were used, but too few data were obtained to establish any significant differences between specimen types.
Fitting Equation (4) to the observations gave, for the plane-strain compression results (with a correlation coefficient r = 0.82)

and for the uniaxial compression observations (with a correlation coefficient r = 0.97)

The difference between uniaxial and plane-strain compressive strength is small, about 25% at a strain-rate of 10-4 s-1 and zero at a strain-rate of 10-6 S-1.

Fig. 8. Strain-rate dependence of strength (friction corrected); T-I granular-snow ice, - 10°C.
The opacity of the T-1 ice made it difficult to observe crack formation during the course of the tests. For strain-rates greater than 10-5 S-1 small cracks were observed. At these high strain-rates for plane-strain loading, examination of the specimen after the test revealed small cleavage cracks in the plane perpendicular to the direction of ice growth. For strain-rates less than 10-5 S-1 there was little visible evidence of either crack or deformation features for either loading condition. Deformation behaviour over the range of strain-rates investigated was ductile, with the exception of the one test result noted on Figure 8.
Because of the inhomogeneity of the T-1 ice there was considerable scatter in the strength results. Variability was even more evident with respect to deformation behaviour. It is difficult to generalize regarding strain at the maximum stress other than to note that for the uniaxial case it was slightly less than 1% and for the plane-strain case slightly more than 1%.
Discussion of results
Differences in the strength and deformation behaviour of S-2 and T-1 ice under uniaxial loading have been the subject of a number of studies (Reference Carter and MichelCarter and Michel, 1971; Ramseier, unpublished) and will be discussed only briefly here. For plane strain the anisotropic structure of S-2 ice results in behaviour sharply different from that observed for T-1 ice with its more isotropic structure.
Strain-rate dependence of the uniaxial compressive strength in the range of ductile behaviour has been compared in Table III with Ramseier's (unpublished) results. Strengths of both T-1 and S-2 ice at a strain-rate of 10-4 were quite comparable, as were the relative strain-rate effects of the two ice types. The strain-rate effect found in the current study was not, however, so pronounced as that obtained by Ramseier (unpublished).
Table III. Comparison of Strain-Rate Effects on Tjniaxial and Plane-Strain Compressive Strengths at —10°C

The anisotropic grain and crystal structure of S-2 ice is characterized by a preferred basal-plane orientation such that ductile deformation is essentially two dimensional (i.e. in the plane of the ice cover). In plane-strain compression where loading and confining directions lie in the plane of the ice cover, this deformation mode is inhibited and the ice is forced to deform in the long direction of the columnar grains. As very few basal planes are oriented to accommodate this deformation, most of it must be accommodated by some type of non-basal glide. From studies of ice single crystals it is known that the stresses associated with non-basal glide are much higher than those associated with basal glide (Reference Higashi and OuraHigashi, 1967). The results of this study showed that at strain-rates of 10-7 S-1 (essentially ductile deformation) the plane-strain compressive strength was four times the uniaxial compressive strength. For increasing strain-rates, behaviour became less ductile and there was a corresponding decrease in the ratio of plane-strain to uniaxial compressive strength. The plane-strain compressive behaviour at strain-rates of about 10-4 S-1 was characterized by formation of cleavage cracks and strength about two and a half times uniaxial strength (Table III).
T-1 ice, with its more isotropic structure, would not be expected to show so great a difference in strength with the two modes of loading. Plastic theory predicts a plane-strain compressive strength 15% greater than the uniaxial compressive strength for an isotropic material with a von Mises yield criteria. The results of this study showed equal strengths at a strain-rate of 10-6 S-1 and a plane-strain compressive strength 25% greater than the uniaxial compressive strength at a strain-rate of 10-4 S-1.
Reference Carter and MichelCarter and Michel (1971) showed that the maximum uniaxial compressive strength for S-2 ice at -10°C was attained at a strain-rate of 10-4 S-1, and for T-1 at a strain-rate of 10-3 S-1. In the current test series the maximum strain-rate attained was about 2 X 10⁻⁴ S-1. In S-2 ice, therefore, the strain-rate was sufficiently high for the maximum strength for plane-strain loading to have been attained.
The results of this investigation have specific application to the engineering problem of estimating maximum ice forces developed on a long straight wall. In this case a plane-strain compression loading condition can be assumed to exist in the ice cover. These laboratory tests indicate the significance of the structural anisotropy of ice with respect to the plane-strain compressive strength. The strength anisotropy of the ice cover must, therefore, be considered in determining ice forces on a long straight wall.
These findings also have more general implications for the problem of estimating ice forces on structures. In most cases the stress conditions in the ice cover are more complex than those considered here, i.e. they involve a combination of compression, flexure and shear. Until more experimental data are available on the strength and deformation behaviour of ice under complex stress, particularly with respect to its anisotropic structure, caution should be exercised in making predictions of ice forces based on analytical models and uniaxial strength data.
Summary
A condition of plane-strain compression has been satisfactorily produced in an ice specimen by loading it in a confining sub-press and utilizing 0.15 >mm polyethylene film to reduce friction effects on the sides. The confinement of the ice required for the plane-strain condition inhibits the mode of failure occurring under uniaxial loading. The resulting plane-strain failure mode for S-2 ice is associated with the formation of cleavage cracks that propagate at right angles to the long axis of the columnar grains. This behaviour was not observed for uniaxial loading.
For the plane-strain condition the compressive strength of columnar-grained S-2 ice is at least two and a half times greater than that for the uniaxial loading condition. For granular T-1 ice, however, plane strain strength is at most 25% greater than uniaxial strength. Results for the columnar-grained S-2 ice show the large effect structural anisotropy has on strength behaviour under a plane strain loading condition.
Acknowledgements
The skill and care of D. Wright, Technical Officer, DBR/NRC, in machining the specimens and setting up the tests is gratefully acknowledged.
This paper is a contribution from the Division of Building Research, National Research Council of Canada, and is published with the approval of the Director of the Division.


