


I. INTRODUCTION
Traditionally qualitative phase analysis, quantitative phase analysis by calibration methods, and crystal structure determinations were separate fields. This all changed when the Rietveld method became the dominant tool for QPDA at the end of the previous century (Rietveld, Reference Rietveld1967, Reference Rietveld1969). Since then quantitative phase analysis has required crystal structures and fitting rather than calibrations. At the same time an increasing number of reference patterns for phase identification were completed by adding crystal structure data, and reference powder patterns calculated from single-crystal structure data were rapidly filling the databases.
Phase identification as the first step in X-ray diffraction (XRD) powder analysis is one of the main tasks of the HighScore software. The user can do the identification based on the peak positions (d spacing and relative intensities) and/or based on the full net profile of the experimental pattern. However, often the combination of both methods obtains the best results, covering major and minor phases. When possible, several commercial reference databases (Bergerhoff and Brown, Reference Bergerhoff, Brown and Allen1987; Belsky et al., Reference Belsky, Hellenbrandt, Karen and Luksch2002; Villars et al., Reference Villars, Cenzual, Daams, Hulliger, Massalski, Okamoto, Osaki, Prince and Iwata2002, Reference Villars, Berndt, Brandenburg, Cenzual, Daams, Hulliger, Massalski, Okamoto, Osaki, Prince, Putz and Iwata2004; Downs and Hall-Wallace, Reference Downs and Hall-Wallace2003; Gražulis et al., Reference Grazulis, Chateigner, Downs, Yokochi, Quiros, Lutterotti, Manakova, Butkus, Moeck and Le Bail2009, Reference Gražulis, Daškevič, Merkys, Chateigner, Lutterotti, Quirós, Serebryanaya, Moeck, Downs and LeBail2012; ICDD) plus own user databases can be combined for one search-match task.
That means that the modern powder pattern analysis software must not only deal with peaks, background, profile, and reference data, but must also handle crystal structures, support transformations of space groups, and all kinds of fits, and should facilitate related methods such as microstructure analysis. New one- and two-dimensional detectors allow faster and better data collection and the large amount of collected data asks for statistical methods and a pre-selection of “interesting” data for an analysis. At the same time automation and data throughput have become increasingly important.
Occasional or less advanced users expect a seamless integration of all these different methods, a maximum of automation and a minimum of necessary user actions to achieve a certain result. Advanced users, on the contrary, demand flexibility, customization possibilities, and a full integration into the Windows environment such as previews, explorer extensions, reporting, and more. Finally, production control needs a complete, self-starting, and unsupervised automation with no interface at all (with the exception of a status screen). Ease of use and a steep learning curve will become even more important in the future, whereas mobile devices will supersede desktop and laptop computers, and all data are expected to be visible and available anywhere immediately.
Modern powder analysis software should be open, reading virtually all and writing at least many important scan formats. All (intermediate) results and all graphics must be available in high quality for export and documentation. The HighScore suite uses a completely customizable graphical user interface under Windows operating systems, which is loosely based on the widespread MS-Office applications. The same is true for the HighScore document structure, which contains different data types and graphics as well as the document history and many more properties.
Preprogrammed and user-definable “desktops” are used to change the appearance of the software completely and to streamline it for specific operations. Batch operations allow the analysis of hundreds of scans in exactly the same, repeatable way. HighScore offers cluster or similarity analysis limited to a maximum of 50 scans. The Plus option handles crystal structure data and phases, and contains crystallographic analysis, transformations, and a space group explorer as well as unlimited cluster analysis. Additionally, the Plus option enables Pascal scripting. Automation is possible in both versions either by the command line interface or by the fitting routines in RoboRiet.
RoboRiet is a stand-alone automation interface for Rietveld analyses as well as for phase and profile fits in a production environment. It is designed to run unattended and without any operator interference. The recipes for the fits are encrypted; the output is defined by scripting and can be encrypted as well, if needed.
II. A NEW KERNEL
Up to HighScore 3.0e, the Rietveld kernel was based on the Fortran source code of the LHPM program from Hill and Howard (Reference Hill and Howard1986), which was a successor of the public domain program DBW 3.2 from Wiles and Young (Reference Wiles and Young1981).
For HighScore version 4.0, the fitting kernel was rebuilt from scratch in platform-independent, templated C + +. This is an essential step to fully utilize the ever increasing number of processors and graphics cores in modern PCs, and to easily extend future functionalities with more sophisticated algorithms and scripting. The new C ++ kernel has no fixed array sizes and allows us to fully exploit all resources of a PC.
A proprietary-bound constraints parameter estimation algorithm is used to solve problems in general with a non-linear least-squares form. A Levenberg–Marquardt method (Levenberg, Reference Levenberg1944; Marquardt, Reference Marquardt1963) is used and resulting subproblems are solved by a modified conjugate-gradient method taking bounds into account. This approach guarantees speed and stability in comparison with the previous kernel which was based on the Fortran code.
Furthermore, the new kernel allows executing all-known refinement modes such as Rietveld, Le Bail et al. (Reference Le Bail, Duroy and Fourquet1988), Pawley (Reference Pawley1981), HKL file fits, and single-peak profile fits simultaneously on one single pattern. Principally, for each phase in a multi-phase model the user can now select a different fitting routine and can thus create very complex and individual refinement models.
III. IMPORTANT FUNCTIONALITIES
A. Quantification of phases with partially known or unknown crystal structures
The classical Rietveld method can deal with a broad range of materials using the known crystal structure information. However, it becomes more difficult when these materials contain crystalline phases with unknown crystal structures, or when they contain even completely amorphous phases. To quantify these phases, an alternative method complementing the classical Rietveld approach is required. The idea is to characterize such materials, one by one, in a simple binary mixture with a well-known crystalline standard. This characterization is performed with a unit cell describing an unknown crystalline phase, which requires indexing first. Alternatively, it is performed with an arbitrary unit cell describing the whole profile of an amorphous phase. Empirical structure factors are extracted via a Pawley or a LeBail fit and are used for HKL file fit (together with a pseudo-formula mass derived from the known concentration in the binary mixture) for further quantifications following the Rietveld formalism. This method was first described by Scarlett and Madsen (Reference Scarlett and Madsen2006) and is now implemented in HighScore with the Plus option (HighScore Plus).
This is particularly important for complex materials of industrial relevance such as blended cement containing slag, pozzolana, and fly ash (Fuellmann et al., Reference Fuellmann, Witzke and van Weeren2013). The example, shown in Figure 1, contains up to 18 phases either amorphous or crystalline, which are treated by a mixed approach using classical Rietveld and HKL file fits using the HighScore Plus package. The issues that may arise while trying to quantify complex mixtures are out of the scope of the present contribution. We refer the reader to the appropriate literature for further reading (see Madsen et al., Reference Madsen, Scarlett, Lachlan Cranswick and Lwin2001).
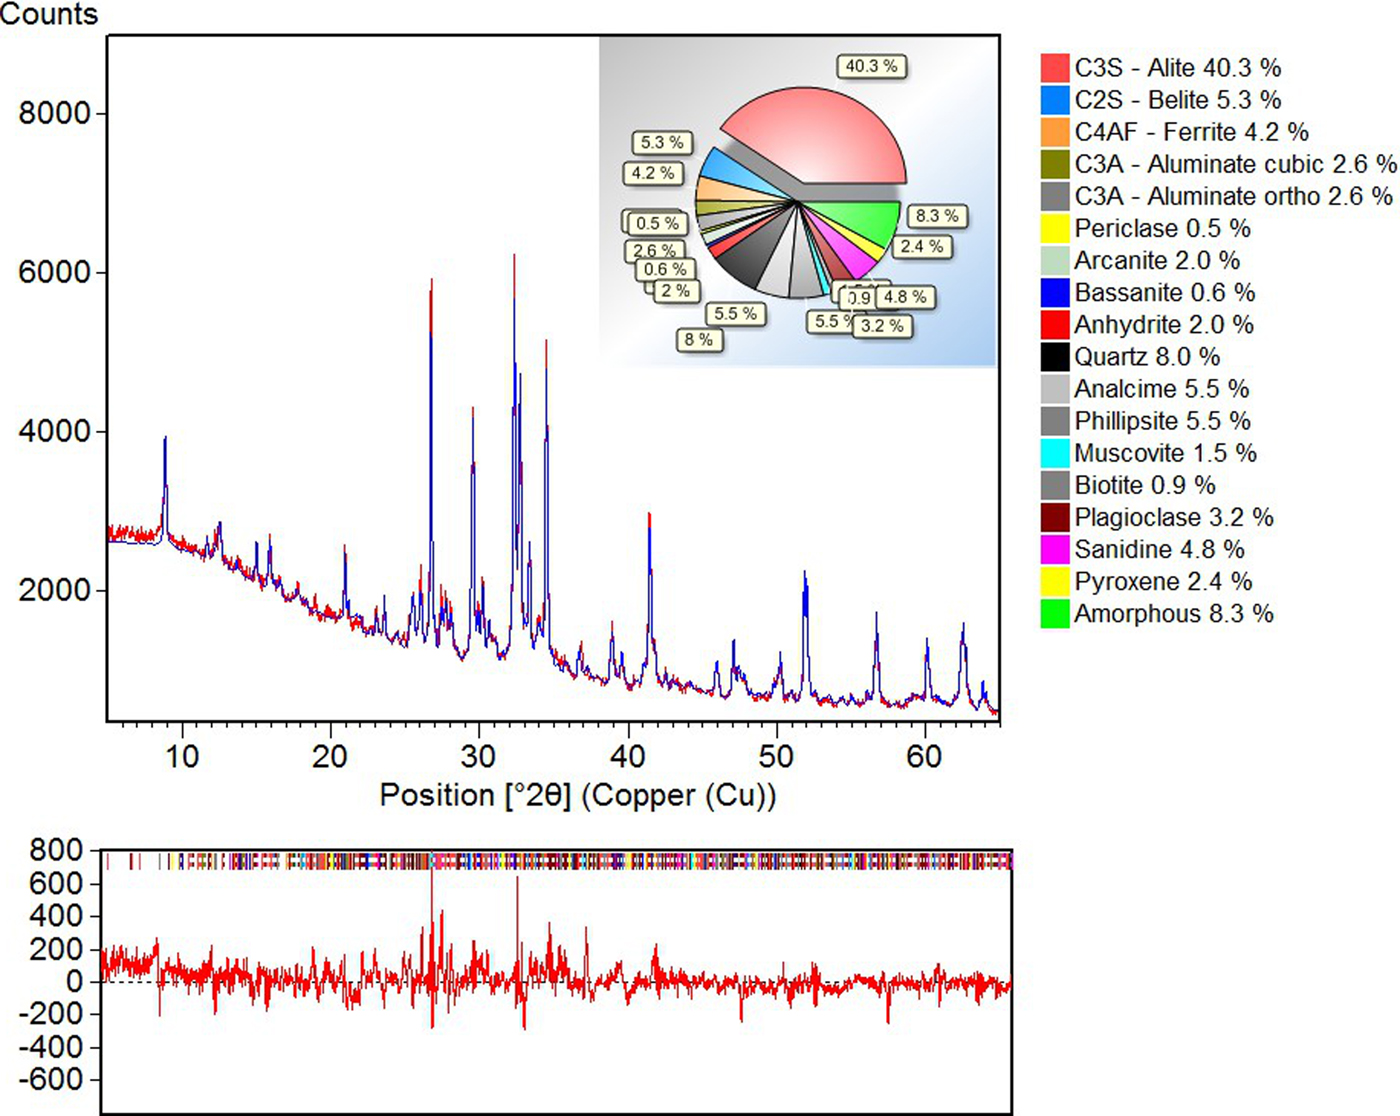
Figure 1. (Color online) Rietveld quantification using HighScore Plus of a pozzolana cement applying HKL file fit and classical Rietveld fit [adapted from Fuellmann et al. (Reference Fuellmann, Witzke and van Weeren2013)].
B. Partial least-squares regression (PLSR)
PLSR is a popular data-mining method with many diverse applications, for example in spectroscopic methods (NIR, FTIR, and NMR). As added in version 4.0 of HighScore, PLSR can be used as a soft-modeling tool to discover and to predict “hidden” correlations directly from the XRD raw scans. The implementation of the SIMPLS algorithm (de Jong, Reference de Jong1993; Lohninger, Reference Lohninger1999) in HighScore is easy to use; the evaluation and optimization of the regression model is semi-automatic and requires little knowledge of the method itself. However, PLSR can only deliver good results if the property of interest affects the diffractogram and the calibration data sets cover all possible variations in the system. Owing to the fact that PLSR is a statistical method, the number of standard samples (usually more then 20) is the most limiting factor for the development of a reliable and accurate calibration model.
PLSR as developed by Wold (Reference Wold and Krishnaiaah1966) is able to predict any defined property Y directly from the variability in a data matrix X. In the case of XRD data, the rows of the data matrix used for calibration are formed by the individual scans, and the columns are formed by all measured data points at a certain diffraction angle. PLSR is particularly well-suited, when the X-matrix of predictors has more variables than observations, and when multi-collinearity among X-values exists. In fact, with PLSR we have a full-pattern approach that totally dismisses profile shapes but still uses the complete information present in the XRD data sets.
XRD enables the analysis of a wide variety of material properties. Information in XRD patterns not directly related to crystallography can be based on physical, chemical, or structural properties such as crystallinity, temperature, hardness, or oxidation state. Even more material parameters that are important for industrial processes can be derived directly from the XRD pattern by PLSR, not asking for pure phases or crystal structures being available. PLSR requires a set of samples for calibration.
One example is the quantification of Fe2+ in iron sinter (König et al., submitted), an intermediate product made from iron ore fines to be fed into the blast furnace. The concentration of Fe2+ is crucial for the process and must be determined. Traditionally, the Fe2+ content is determined by wet-chemical methods, which are time- and cost-consuming.
In this example, 35 iron sinter samples with Fe2+ content varying from 4.3 to 5.3% were analyzed by wet chemistry and also measured by the XRD. The Fe2+ concentration in the samples has a small effect in peak intensities and background that can be analyzed with PLSR. The samples were used as standards to develop the PLSR model. Cross-validation was used to estimate the errors of the PLSR calibration model. Cross-validation is integrated in the software and can be performed automatically by entering the number of test sets and the required repetitions.
For the Fe2+ content of the 35 samples analyzed by PLSR, a root-mean-square error of prediction (RMSEP) of 0.16% was calculated. The RMSEP value is an estimate for the prediction quality. It represents ±1 sigma error of the predicted values. This value has the same unit as the prediction values, in this example it is in % of predicted Fe2+. The quality of the calibration can be monitored in several evaluation plots as illustrated in Figure 2.
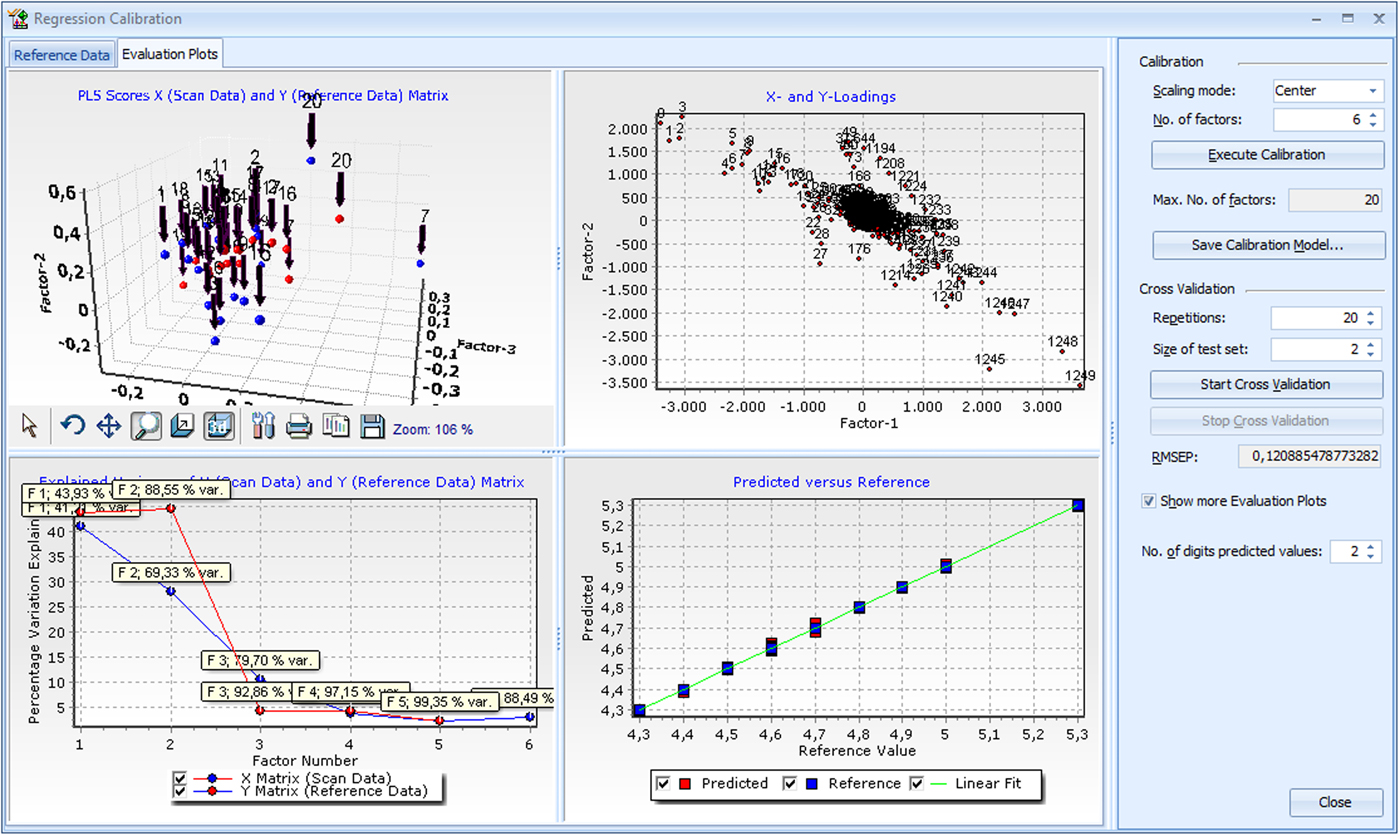
Figure 2. (Color online) Screenshot of PLSR plot as implemented in version 4.0 of HighScore.
Figure 3 shows a comparison of Fe2+ content obtained from wet chemistry and from PLSR. It clearly shows that the XRD in combination with PLSR is a robust and fast alternative to time- and cost-consuming wet-chemical methods. Most importantly, this method allows getting access to non-crystallographic information, in this case the Fe2+ content, which is not directly accessible from a diffraction experiment. The example also demonstrates the great potential of XRD for controlling and monitoring processes and material properties in industrial environments.

Figure 3. Comparison of wet chemistry and PLSR results for Fe2+ in iron ore sinter, absolute errors (below) in % [adapted from König et al. (submitted)].
IV. ADDITIONAL FUNCTIONALITIES
In addition to the major functions, the HighScore suite contains an extensive online help system with examples for self-instruction, a complete description of the applied methods and an up-to-date literature list. Auxiliary functions such as a periodic table of elements, a space group explorer (230 standard and about 150 additional non-standard settings), and a calculator turning QPDA results into elements or oxides or other XRF quantities are also available with a mouse click.
Furthermore, the HighScore suite enables scripting: the possibility for users to program their own functions and dedicated interfaces in the standard Pascal programming language. A small IDE with debug facilities, intelligent code completion, and drag & drop user interface design is part of the Plus option.
Below, we present some of the latest unique additions to the suite such as the semi-automatic bitmap-to-scan converter, and the charge flipping algorithm.
A. Bitmap-to-scan converter
HighScore's bitmap-to-scan converter generates an XRD scan from a graphic file or from a picture printed on paper. One can either load a bitmap from a file or copy a bitmap from the clipboard. A press-button option does the actual work and tries to find the scan data inside a rectangular box. This is done by analyzing the black levels at each pixel position. It is possible to restore the original, unchanged bitmap at any time. The user enters the 2θ and intensity ranges, and selects a linear, square-root, or logarithmic intensity scale. The resulting pattern can either be stored, copied, or opened as a new HighScore document (.HPF) using the toolbar possibilities.
As an example of this new feature, we have reinvestigated the analysis of the patina of the Statue of Liberty published in the first volume of Powder Diffraction (Matyi and Baboian, Reference Matyi and Baboian1986). This is illustrated in Figure 4 where we present respectively the scan of Figure 4 from Matyi and Baboian (Reference Matyi and Baboian1986), the converted scan and the phase quantification by the Rietveld analysis of the sample, which was not done at that time.
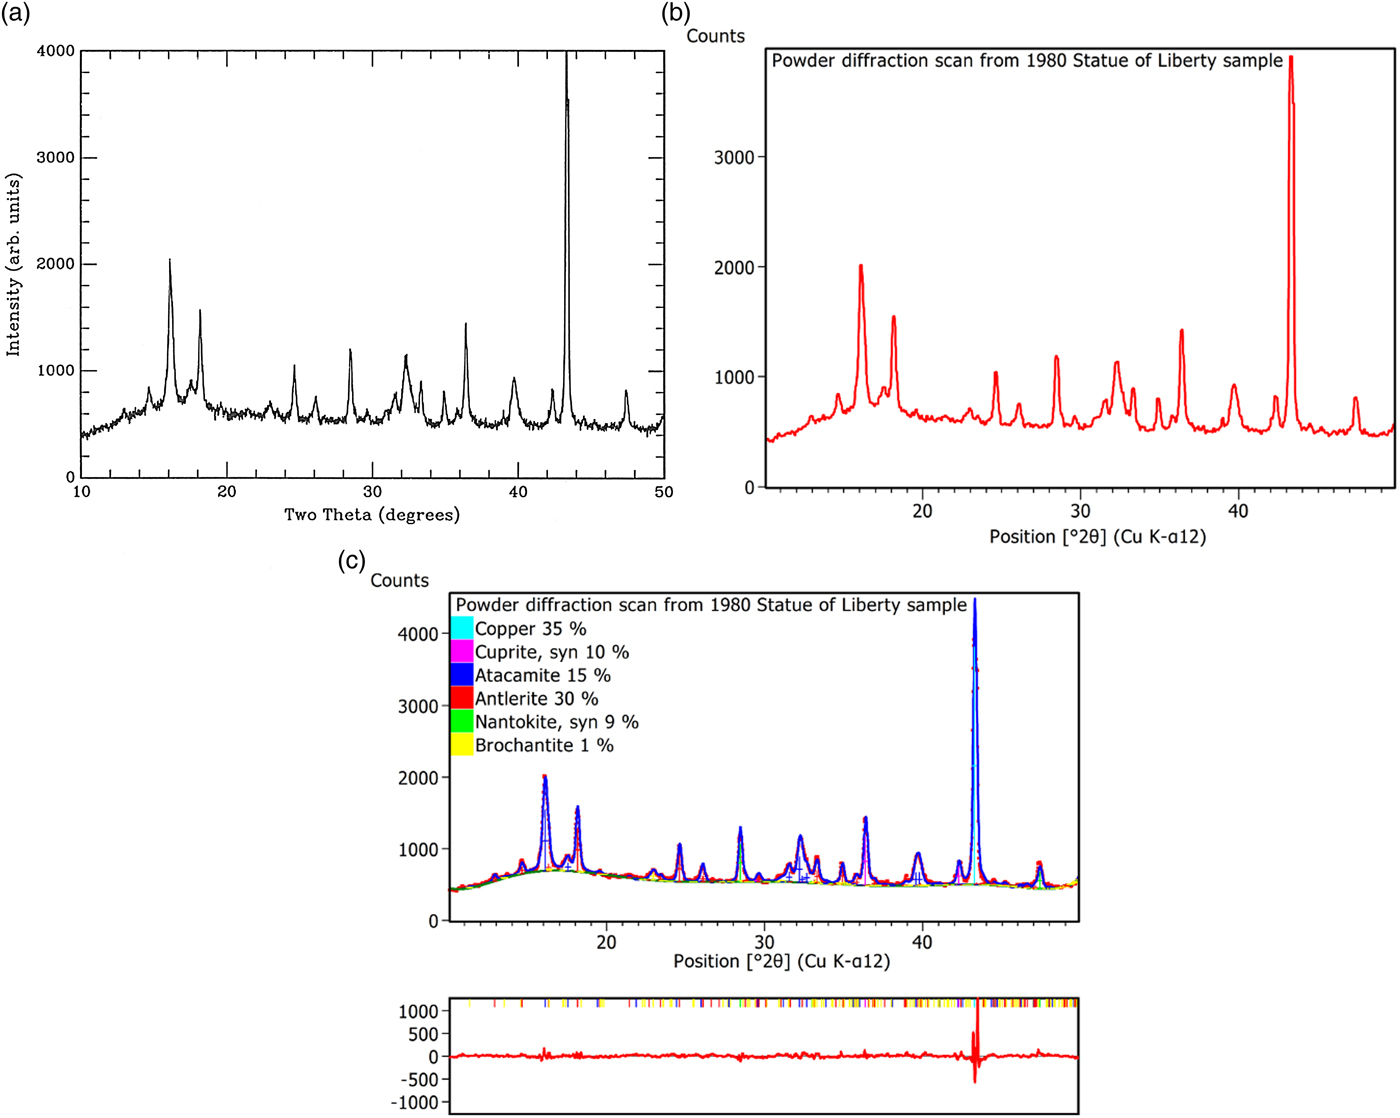
Figure 4. (Color online) Illustration of the bitmap-to-scan converter in HighScore 4.0: (a) scanned picture of the powder pattern taken by Matyi and Baboian (Reference Matyi and Baboian1986), (b) converted scan from the bitmap, and (c) resulting quantitative Rietveld analysis.
The quantitative Rietveld analysis reveals the patina being composed of 35% copper, 10% cuprite (Cu2O), 15% atacamite [Cu2Cl(OH)3], 30% antlerite [Cu3(OH)4SO4], and 9% nantokite (CuCl). The presence of a small amount of an additional phase, namely brochantite [Cu4SO4(OH)6], of the order of 1%, is possible. This additional phase explains the reflection around 2θ = 23.2°, which otherwise would not be indexed.
B. Charge-flipping algorithm
Charge flipping is a modern method to overcome the phase problem and to solve crystal structures from powder diffraction data (Oszlányi and Sütő, Reference Oszlányi and Sütő2004, Reference Oszlányi and Sütő2005). HighScore Plus has included the Superflip algorithm by Palatinus and Chapuis (Reference Palatinus and Chapuis2007). This is actually an extension of the original ideas from Oszlányi and Sütő covering incommensurately modulated structures, but has now become an all-purpose tool. The problem of strong overlapping peaks in powder diffraction can be tackled with a histogram-matching algorithm by Baerlocher et al. (Reference Baerlocher, McCusker and Palatinus2007). Finally, the resulting electron density map is analyzed with the program EDMA by van Smaalen et al. (Reference van Smalen, Palatinus and Schneider2003) and is displayed graphically.
V. CONCLUSION
In this paper, we briefly presented the HighScore suite, PANalytical's commercial powder diffraction analysis software. One single program enables the user to carry out the whole range of possible crystallographic analyses and more. Phase identification, indexing, classical, and non-classical Rietveld refinements, up to solving crystal structures from powder diffraction data and application of statistical methods and automatic analysis of large datasets are possible within the HighScore suite. Beginners and standard users can easily start data evaluation, whereas advanced users are still able to customize refinement routines using the full range of the various complex subroutines within the suite. The HighScore suite is under constant development.


