


Introduction
Metal amorphous nanocomposite (MANC) alloy systems are of significant interest for a range of emerging soft magnetics applications which include, but are not limited to, inductors, transformers, and rotating electrical machinery such as motors [Reference Leary, Ohodnicki and McHenry1]. As compared with bulk alloys such as electrical steels and permalloy, higher effective resistivity and thinner laminations permit the operation to higher switching frequencies with relatively low losses. When combined with higher saturation inductions attainable as compared with high-frequency ferrite core materials, these materials show ideal technical performance characteristics for medium frequency (1–100 kHz) and medium to high power (kW+) applications. MANC alloy systems are typically produced through a rapid solidification process such as planar flow casting to generate an amorphous metal ribbon (AMR) followed by a thermal annealing treatment to partially devitrify the ribbon and form a stabilized nanocomposite MANC microstructure. Existing commercial alloy systems produced in bulk quantities are based upon the quaternary FeNbSiBCu system and contain only a single transition metal ferromagnetic element (Fe) such that the MANC microstructure ultimately obtained is comprised of a nanocrystalline BCC-derivative Fe–Si DO3 phase surrounded by an amorphous matrix [Reference Yoshizawa, Oguma and Yamauchi2]. Newer alloy systems are being explored that have substantially modified compositions with a significant content of other ferromagnetic transition metal elements such that other close-packed nanocrystalline phases (e.g., FCC, HCP) become similar or lower in free energy as compared with BCC-derivative phases. These alloys are based upon (i) high Co-containing alloys in which nanoscale BCC, FCC, and HCP (as well as highly faulted close-packed) grains can be found in varying proportions and (ii) FeNi alloys for which nanoscale FCC grains become a significant or dominant crystalline phase after optimized annealing treatments [Reference Aronhime, Zoghlin, Keylin, Jin, Ohodnicki and McHenry3, Reference Aronhime, DeGeorge, Keylin, Ohodnicki and McHenry4, Reference Ipus, Herre, Ohodnicki and McHenry5, Reference Ohodnicki, Park, Laughlin, McHenry, Keylin and Willard6, Reference Kernion, Ohodnicki and McHenry7, Reference Ohodnicki, Long, Laughlin, McHenry, Keylin and Huth8, Reference Goswami and Willard9]. These alloy systems are attractive for numerous applications, as they exhibit unique mechanical and magnetic properties which make them highly scalable from a manufacturing perspective and exceptionally tunable in terms of magnetic properties through the application of field and mechanical strain during thermal annealing [Reference Aronhime, DeGeorge, Keylin, Ohodnicki and McHenry4, Reference Ohodnicki, Long, Laughlin, McHenry, Keylin and Huth8, Reference Daniil, Ohodnicki, McHenry and Willard10, Reference Kernion, Ohodnicki, Grossman, Leary, Shen, Keylin, Huth, Horwath, Lucas and McHenry11, Reference Krimer, Keylin, Leary, Ohodnicki, Byerly, Wise, Clark and McHenry12, Reference Leary, Keylin, Ohodnicki and McHenry13].
A significant body of work has been focused on the Co-rich alloy system such that detailed microstructural and local chemical composition analysis has been performed and thermodynamic models have been proposed to describe and rationalize phase evolution and compositional partitioning during crystallization [Reference Ohodnicki, Laughlin, McHenry and Widom14, Reference Ohodnicki, Qin, Laughlin, McHenry, Kodzuka, Ohkubo, Hono and Willard15, Reference Ohodnicki, Qin, McHenry, Laughlin and Keylin16]. More specifically, isothermal annealing experiments of CoFeZrB-based alloy systems were explored in detail across the entire range of (Fe,Co)-content for fixed glass former compositions (i.e., an FeCo pseudo-binary system) illustrating a number of trends [Reference Goswami and Willard9, Reference Ohodnicki, Laughlin, McHenry and Widom14, Reference Ohodnicki, Qin, Laughlin, McHenry, Kodzuka, Ohkubo, Hono and Willard15, Reference Ohodnicki, Park, McWilliams, Ramos, Laughlin and McHenry17]:
(1) Body-centered cubic nanocrystalline phases tend to dominate across the pseudo-binary composition until Fe:Co ratio approaching 9:1 where significant volume fractions of close-packed nanocrystalline phases are identified (FCC, HCP, and highly faulted).
(2) At lower temperatures and shorter annealing times, BCC nanocrystallites tend to form first followed by an increased volume fraction of close-packed nanocrystals at higher temperatures and longer annealing times in compositions where BCC, FCC, and HCP mixtures are observed.
(3) Compositional segregation can be observed between various nanocrystalline phases and trends could be rationalized using classical nucleation arguments and the parallel tangency condition.
Trends reported were further verified and confirmed through a detailed high-temperature X-ray diffraction study that allowed for in situ confirmation of initial BCC phase nucleation followed by close-packed phase formation at higher annealing temperatures [Reference Kernion, Ohodnicki and McHenry7]. More recent work based upon CoNbSiBCu alloy systems with small additions of Fe, Mn, and other transition metal elements has also demonstrated the presence of close-packed nanocrystalline phases and multi-phase nanocrystalline mixtures within an amorphous matrix [Reference Leary, Keylin, Ohodnicki and McHenry13]. Mechanistic explanation remains elusive and current theories suggest enhanced ductility is predominantly associated with the intergranular amorphous phase composition [Reference Daniil, Ohodnicki, McHenry and Willard10], but enhanced ductility of Co-rich alloy systems are qualitatively correlated with a substantial volume fraction of close-packed nanocrystalline phases such that nanocrystal phase identity may also play a role.
In the case of FeNi-based alloy systems, interesting observations have also been reported in the literature regarding the interplay between BCC and FCC based nanocrystals forming during primary crystallization processes. A detailed high-temperature X-ray diffraction study of an (Fe70Ni30)88Zr7B4Cu1 alloy demonstrated initial nucleation of BCC nanocrystals during the early stages of crystallization followed by the formation of FCC nanocrystals at higher annealing temperatures [Reference Ipus, Herre, Ohodnicki and McHenry5], with retention of FCC metastable nanocrystals upon cooling to room temperature. In a detailed study of the (Fe1-xNix)80Nb4Si2B14 alloy system with varying Fe and Ni content, the x=0.3 composition was found to lie approximately at the transition between predominantly FCC as compared with BCC nanocrystals with BCC phase dominating in the more Fe-rich compositions as would be expected [Reference Aronhime, Zoghlin, Keylin, Jin, Ohodnicki and McHenry3, Reference Aronhime, DeGeorge, Keylin, Ohodnicki and McHenry4]. And as observed for the FeNiZrB-based alloys, a greater volume fraction of BCC relative to FCC nanocrystals could be observed at lower annealing temperatures. Despite these initial studies reporting the structural characterization of multi-phase crystallization processes, detailed high-resolution transmission electron microscopy (HRTEM) and compositional segregation analysis has not been reported for FeNi-based MANC alloys to date. To further understand microstructural and compositional segregation in alloys of x = 0.3 composition for which a significant volume fraction of both phases can be found, HRTEM and atom probe tomography (APT) analysis was performed on an optimally annealed sample as described in detail in subsequent sections.
Experimental Results and Discussion
As reported in prior studies, the samples investigated here exhibit a mixture of BCC and FCC nanocrystals within the sample bulk (greater than approximately 500 nm from the ribbon surfaces) after the optimized annealing treatment. A bright-field transmission electron microscopy (TEM) image is presented in Fig. 1 along with a selected area diffraction pattern, confirming the multi-phase nanocrystalline microstructure. Detailed HRTEM studies were also performed to better understand the microstructure of the multi-phase nanocomposite alloy systems. Individual nanocrystals surrounded by an intergranular amorphous phase were identified and could be indexed as either BCC or FCC phase. In Fig. 1(c), a BCC nanocrystal oriented along a [111]-type zone axis is identified with a diameter of approximately 10 nm. In Fig. 1(d), an FCC nanocrystal oriented along a [110]-type zone axis was found with a diameter of only approximately 3 nm.
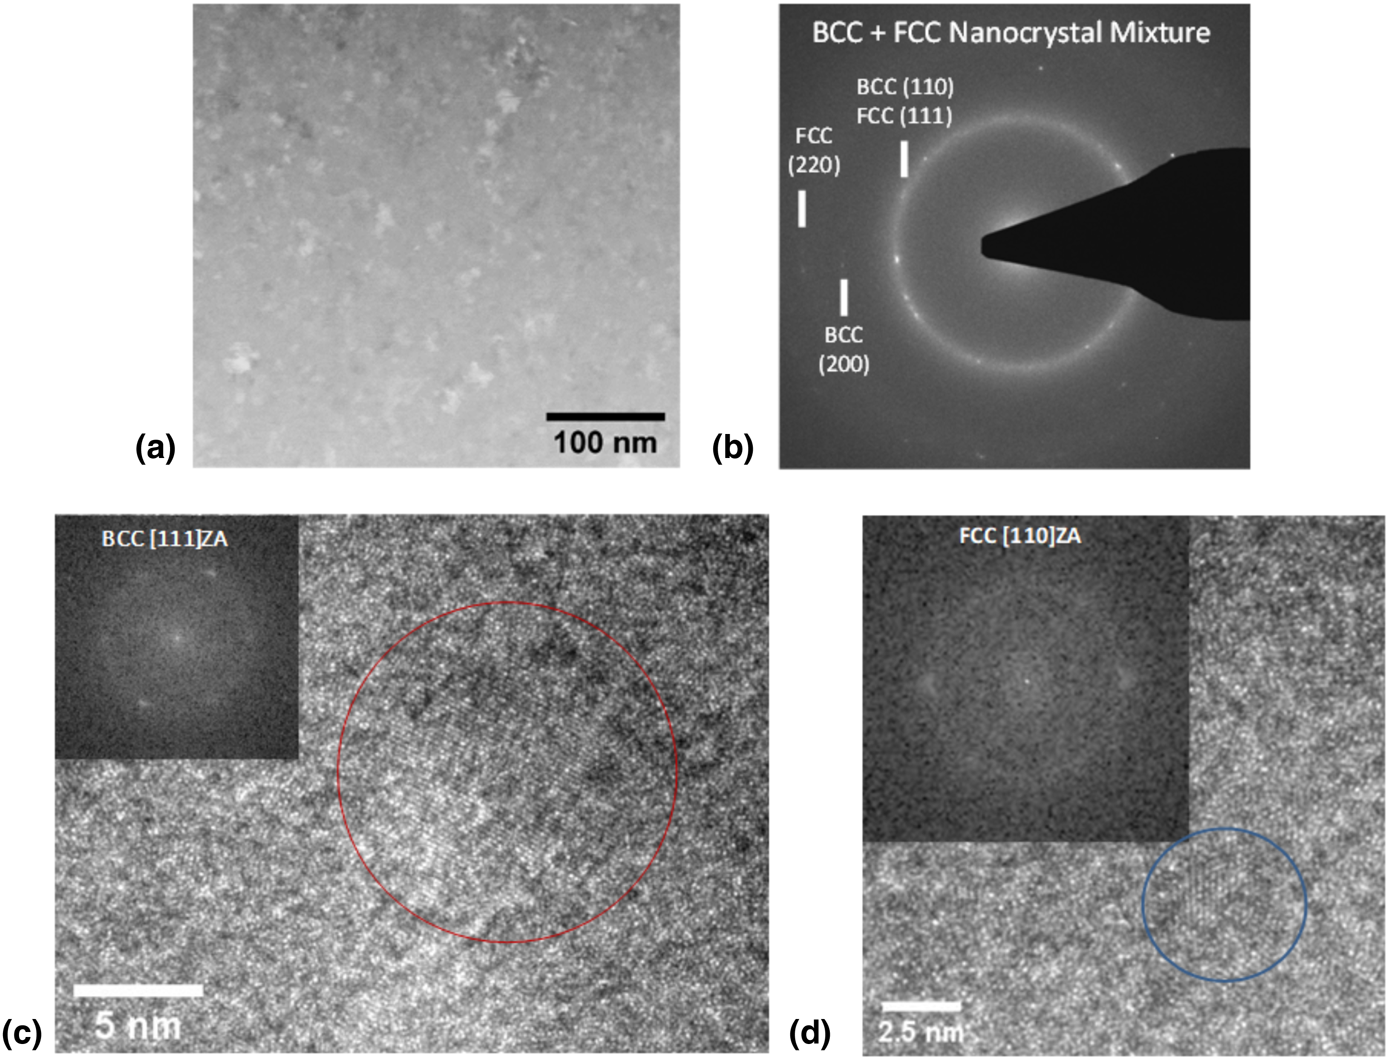
Figure 1: (a) Conventional bright-field TEM image and (b) selected area diffraction pattern confirming a nanocrystalline microstructure comprised of a mixture of BCC and FCC nanocrystals within the bulk of the annealed ribbon sample. HRTEM images are also presented for regions in which (c) BCC and (d) FCC nanocrystals are identified in zone axis orientation ([111]-type and [110]-type, respectively).
In addition to individual nanocrystals separated by an amorphous matrix, observations were also made for regions in which BCC and FCC nanocrystals were found to be in intimate contact and displayed one of the well-known orientation relationships reported previously in the literature [Reference Barcelo, Bechade and Fournier18]. Several examples of these regions are presented below in Fig. 2. Such observations have also been detailed in a prior Co-rich alloy [Reference Ohodnicki, Qin, McHenry, Laughlin and Keylin16]. In Fig. 2(a), two individual BCC and FCC nanocrystalline grains are found to be in direct contact with one another and exhibit a Nishiyama–Wassermann orientation relationship with the BCC in a [001] zone axis and the FCC in a [0-1-1] zone axis orientation [Reference Nishiyama19, Reference Wassermann20]. In Fig. 2(b), two individual BCC and FCC nanocrystalline grains are found to be contact with a Kurdjumov–Sachs orientation relationship with the BCC in a [1-11] zone axis and the FCC in a [110] zone axis orientation [Reference Kurdjumov and Sachs21]. Cube-on-cube orientation relationships have also been observed. Nanostructured BCC and FCC grains in direct contact with orientation relationships suggest heterogeneous nucleation of one phase on another and/or a cooperative nucleation process between the multiple crystalline phases.
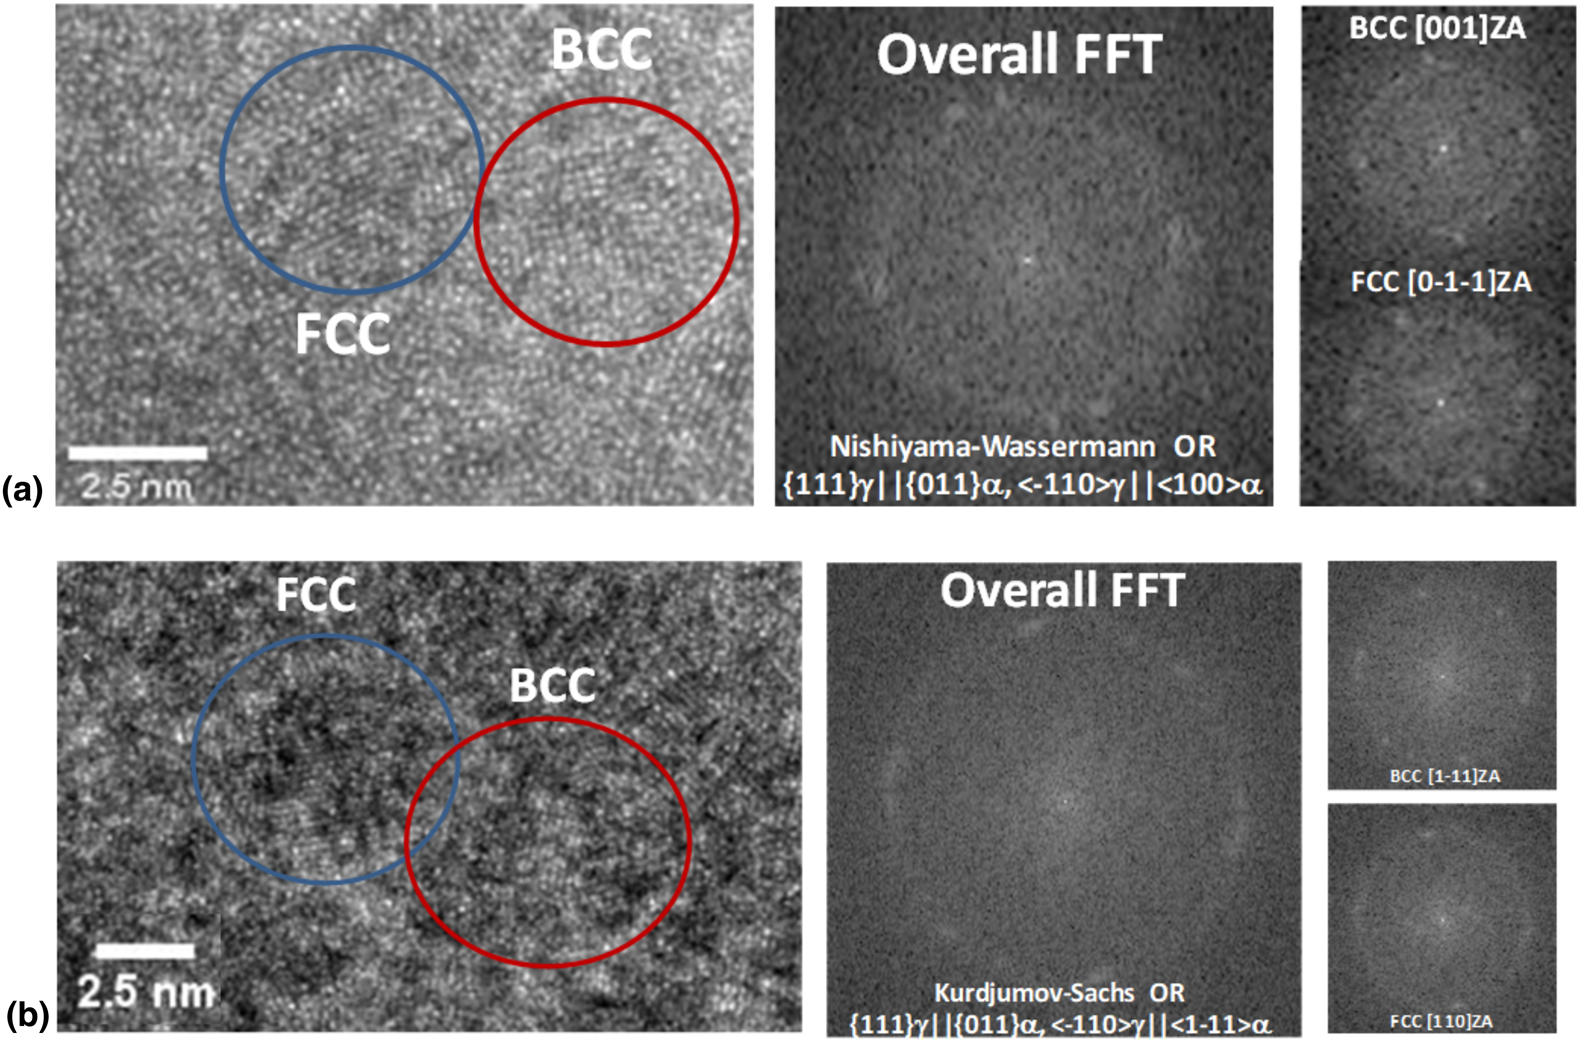
Figure 2: (a) HRTEM image and selected fast Fourier transforms showing a BCC and FCC grain on a zone axis orientation ([001] and [0-1-1], respectively) with a Nishiyama–Wassermann orientation relationship. (b) Corresponding HRTEM image and selected fast Fourier transforms showing a BCC and FCC grain on a zone axis orientation ([1-1-1] and [110], respectively) with a Kurdjumov–Sachs orientation relationship.
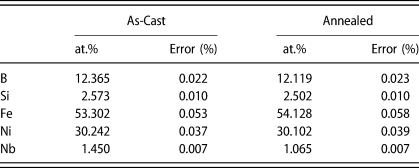
To explore compositional segregation associated with the multi-phase nanocrystallization process, APT was performed for both as-cast and annealed samples. The average estimated composition of both as-cast and annealed samples determined via APT is presented in Table 1 and is in reasonable agreement with one another and generally consistent with the expected nominal alloy composition of (Fe70Ni30)80Nb4Si2B14, although estimated Nb content is smaller than expected by approximately 2.5–3 at.%.
TABLE 1: Composition of as-cast and annealed (Fe70Ni30)80Nb4Si2B14 analyzed via APT.
The extent of element segregation after annealing was investigated by performing frequency distribution analysis for both as-cast and annealed conditions, with results provided in Fig. 3. Both as-cast and annealed data sets were partitioned into bins containing 200 ions (corresponding to a volume of 2.36 nm3), where composition in each bin was determined and plotted as a histogram. In the as-cast sample [Fig. 3(a)], the frequency distribution of Fe, Ni, B, Si, and Nb agrees well with the binomial distribution, whereas the annealed sample shows a clear deviation from random distribution [Fig. 3(b)]. Additionally, Pearson correlation coefficients (μ) were calculated to quantify the extent of deviation from binomial distribution, with results presented in Fig. 3(c) [Reference Gault, Moody, Cairney and Ringer22, Reference Moody, Stephenson, Liddicoat and Ringer23, Reference Moody, Stephenson, Ceguerra and Ringer24]. The Pearson correlation coefficient is a statistical metric that has a value between 0 and 1, where 0 indicates random distribution and 1 indicates a complete association between solute atoms [Reference Gault, Moody, Cairney and Ringer22]. We find that μ is <0.1 for all elements in the as-cast condition, indicating near random distribution. In contrast, after annealing the μ-values increased by a factor of 3–10 for all elements pointing to the increased extent of elemental segregation after annealing.
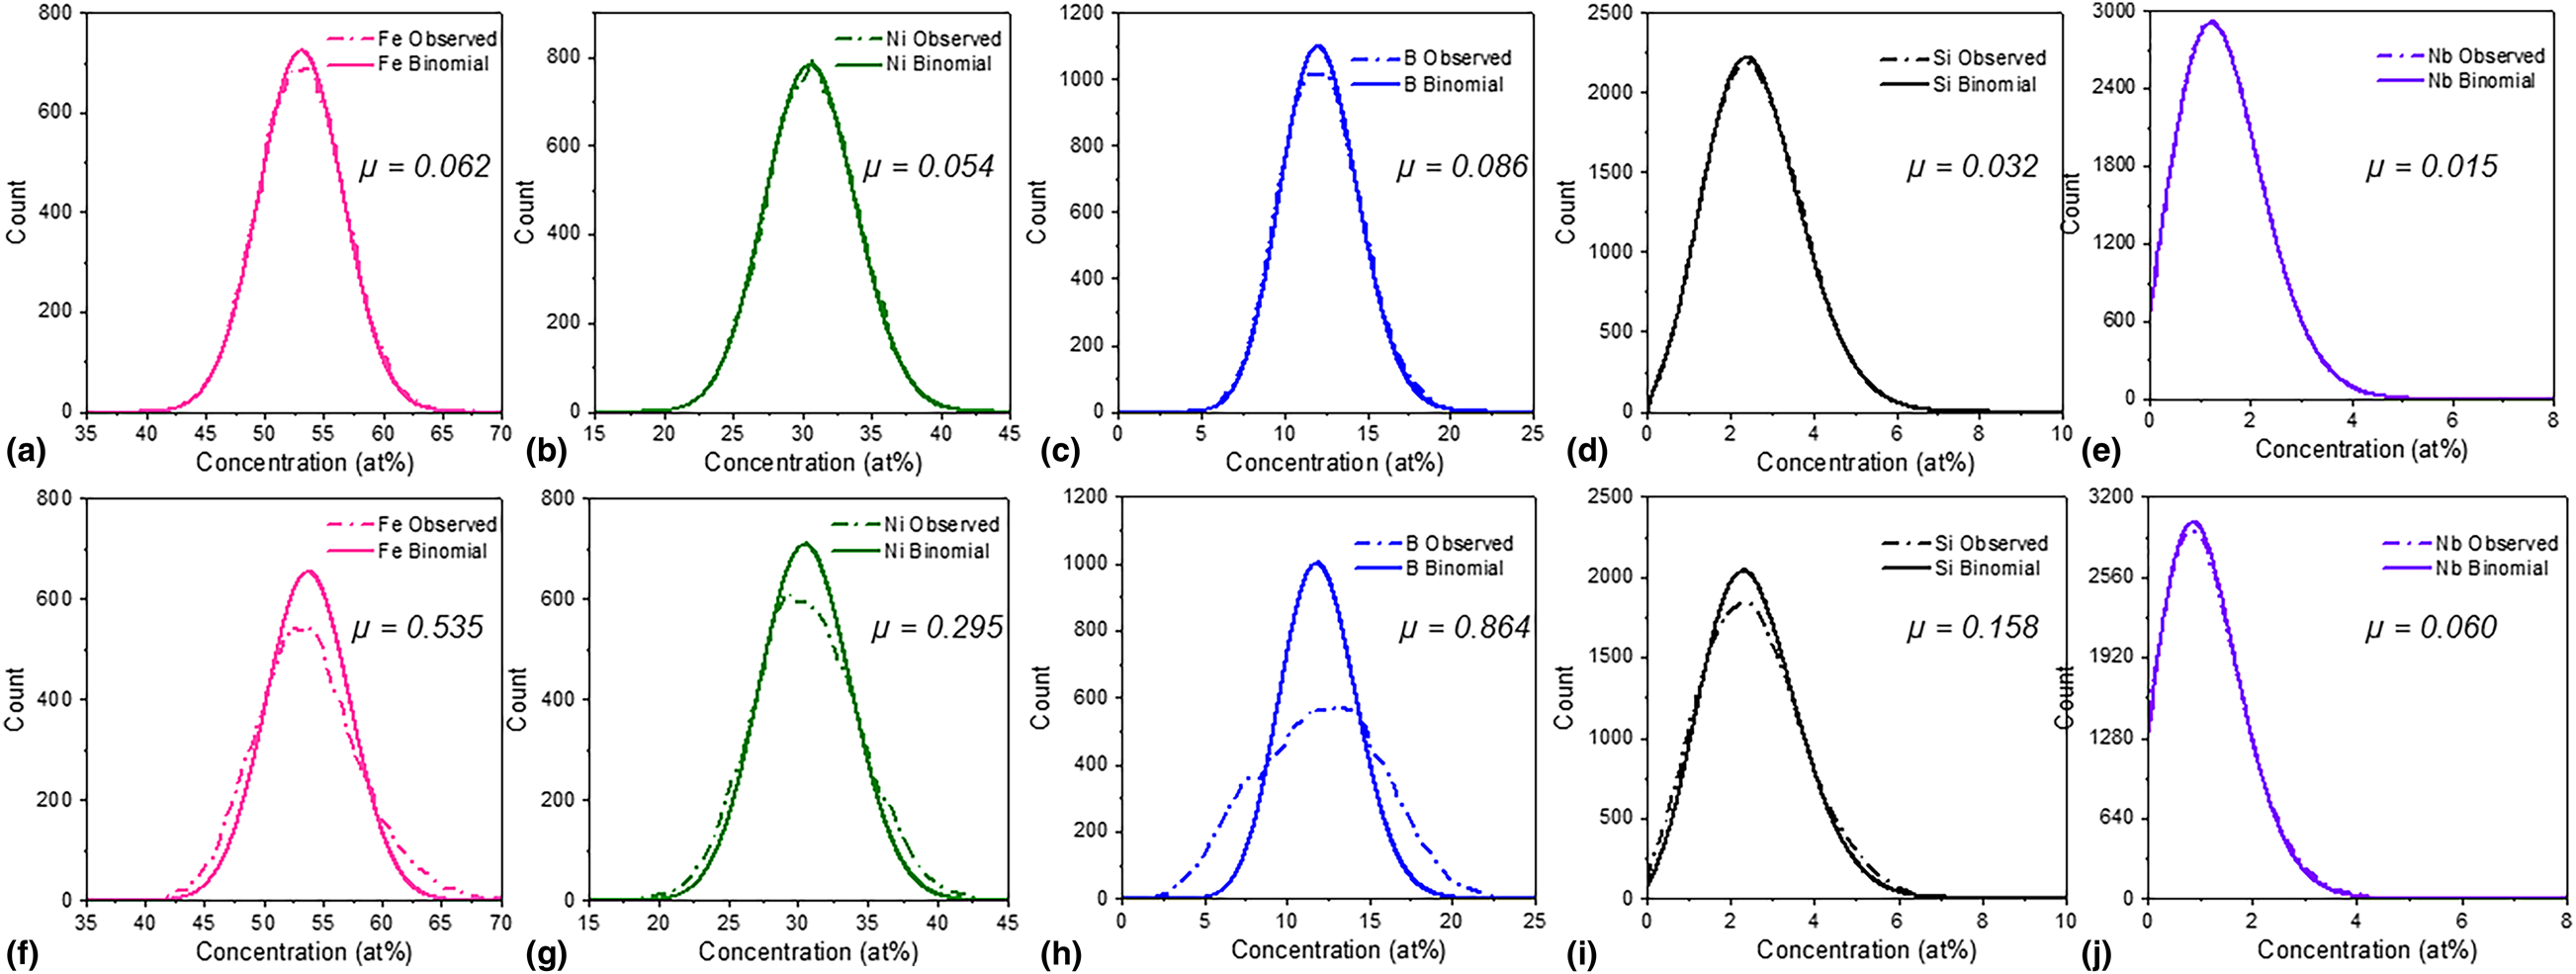
Figure 3: Statistical analysis of element segregation in as-cast versus annealed (Fe70Ni30)80Nb4Si2B14. Frequency histograms are provided for all alloying elements for (a–e) as-cast, and (f–j) after 1 h annealing at 440 °C. A binomial distribution is plotted as a solid line, and given with frequency distribution measured for each element (shown in a dashed line). Corresponding Pearson correlation coefficients (μ) are reported in each sub-plot. A 200-ion bin size was used for frequency distribution analysis.
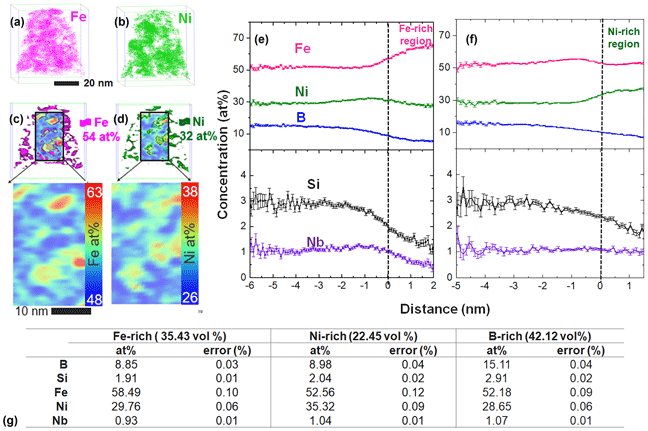
By visually analyzing 3D element distribution in APT reconstructions, three distinct regions of enrichment were identified: (i) Fe-enriched, (ii) Ni-enriched, and (iii) B-enriched regions. 3D element distribution maps shown in Figs. 4(a) and 4(b) illustrate regions in which either Fe or Ni is enriched. The Fe and Ni enriched regions are also highlighted in Figs. 4(c) and 4(d), in which 54 at.% Fe and 32 at.% Ni iso-concentration surfaces are shown with corresponding 2D contour plots for Fe and Ni, respectively. 2D composition contour plots were generated from a rectangular region of interest placed inside the reconstruction, with a thickness of 1 nm and varying height and width dimensions, where composition was analyzed along the thickness direction. Compositions across the Fe and Ni rich regions were analyzed using proximity histograms [Reference Hellman, Vandenbroucke, Rusing, Isheim and Seidman25] across 54 at.% Fe and 32 at.% Ni iso-concentration surfaces and are presented in Figs. 4(e) and 4(f), respectively. Error reported in tables and composition profiles represents point-counting error. Concentration profiles show a clear reduction in B, Si, and Nb content within the Fe and Ni-rich regions. Slight enrichment in Ni can also be observed at the interface of Fe-rich regions in Fig 4(e), and similarly an enrichment of Fe adjacent to the Ni-rich region is shown in Fig. 4(f). The composition of each Fe, Ni, and B enriched region was estimated using regions enclosed by a 54 at.% Fe, 32 at.% Ni, and 12 at.% B iso-concentration surfaces, with results given in Fig. 4(g). The corresponding volume fraction of each region is given in parentheses. Based on expectations for phases identified through TEM (Figs. 1 and 2) Fe-enriched regions can be identified as BCC nanocrystals, Ni-enriched regions are identified as FCC nanocrystals, and B-enriched regions are identified as the intergranular amorphous phase.
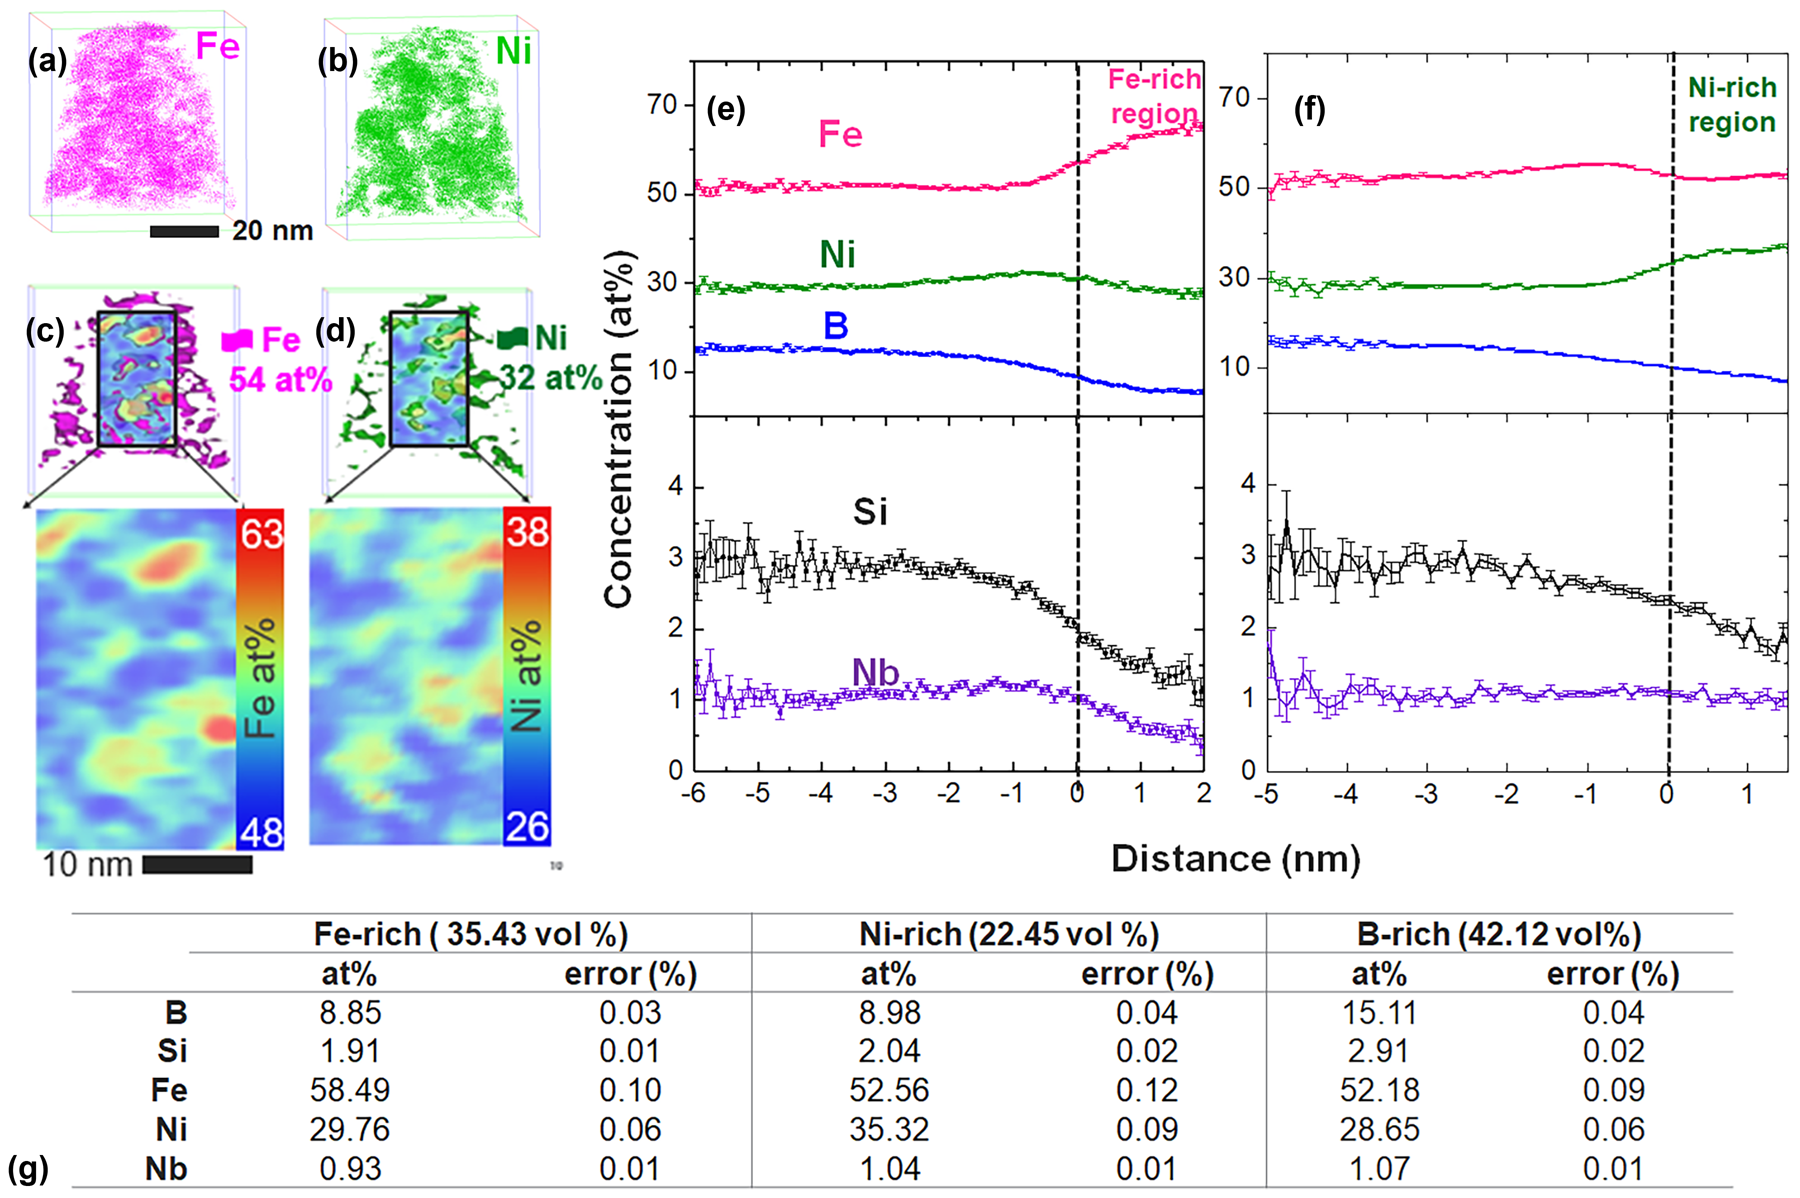
Figure 4: Compositional analysis of Fe–Ni–B–Si–Nb annealed at 1 h at 440 °C performed via APT. (a) Fe-enriched regions defined by a 54 at.% iso-concentration surface and (b) Ni-enriched region defined by a 32 at.% iso-concentration surface. Iso-concentration surfaces overlaid on a 2D contour plot with the stand-alone 2D contour plot shown in a larger view, for (c) Fe and (d) Ni. Proximity histograms across (e) 54 at.% Fe and (f) 32 at.% Ni iso-concentration surface. (g) Compositions of volumes encapsulated by 54 at.% Fe, 32 at.% Ni, and 12 at.% B iso-concentration surface with estimated volume percent of each region identified in parentheses. The total volume analyzed was 3.0295 × 10⁴ nm3.
From the Fig. 4 concentration profiles, Fe-enrichment clearly corresponds to Ni depletion and vice versa. Fe and Ni enriched crystalline regions are also found to be depleted in B, Si, and Nb. This observation suggests that B, Si, and Nb may encompass the Fe and Ni-rich crystalline regions which are found to be in direct contact with each other via HRTEM (Fig. 2). By investigating sub-volumes of the annealed data set via APT, we find adjacent Fe and Ni-rich regions in direct contact with each other, consistent with Fig. 2 HRTEM results. This observation is shown in Figs. 5(a) and 5(b) 2D contour plots, where Fe and Ni rich regions are highlighted with a dashed line. A corresponding Nb enrichment on the periphery of these adjacent Fe and Ni-enriched regions can also be seen in the Fig. 5(c) Nb contour plot. The Nb enrichment is indicated by several black arrows and appears to be a discontinuous shell around the Fe and Ni nanocrystals. Corresponding concentration profiles for Fe, Ni, and Nb [Figs. 5(d)–5(f)] indicate Fe and Ni depleted regions correspond to the Nb enrichment above the 1.07 at.% average in the entire reconstructed volume. The Nb enrichment above the average 1.065 at.% is labeled as the Nb-shell in Fig. 5(f) and is approximately 4 nm wide in the sub-volume analyzed here. The Nb enrichment shown in Figs. 5(c) and 5(f) can also be correlated with an increase in B and Si concentration. It is interesting to note that the location of the Nb enrichment on the periphery of the Fe and Ni rich nanocrystals is consistent with previous discussions of an Nb-shell which tends to surround the growing nanocrystals and acts to inhibit further crystalline growth [Reference Kernion, Keylin, Huth and McHenry26].
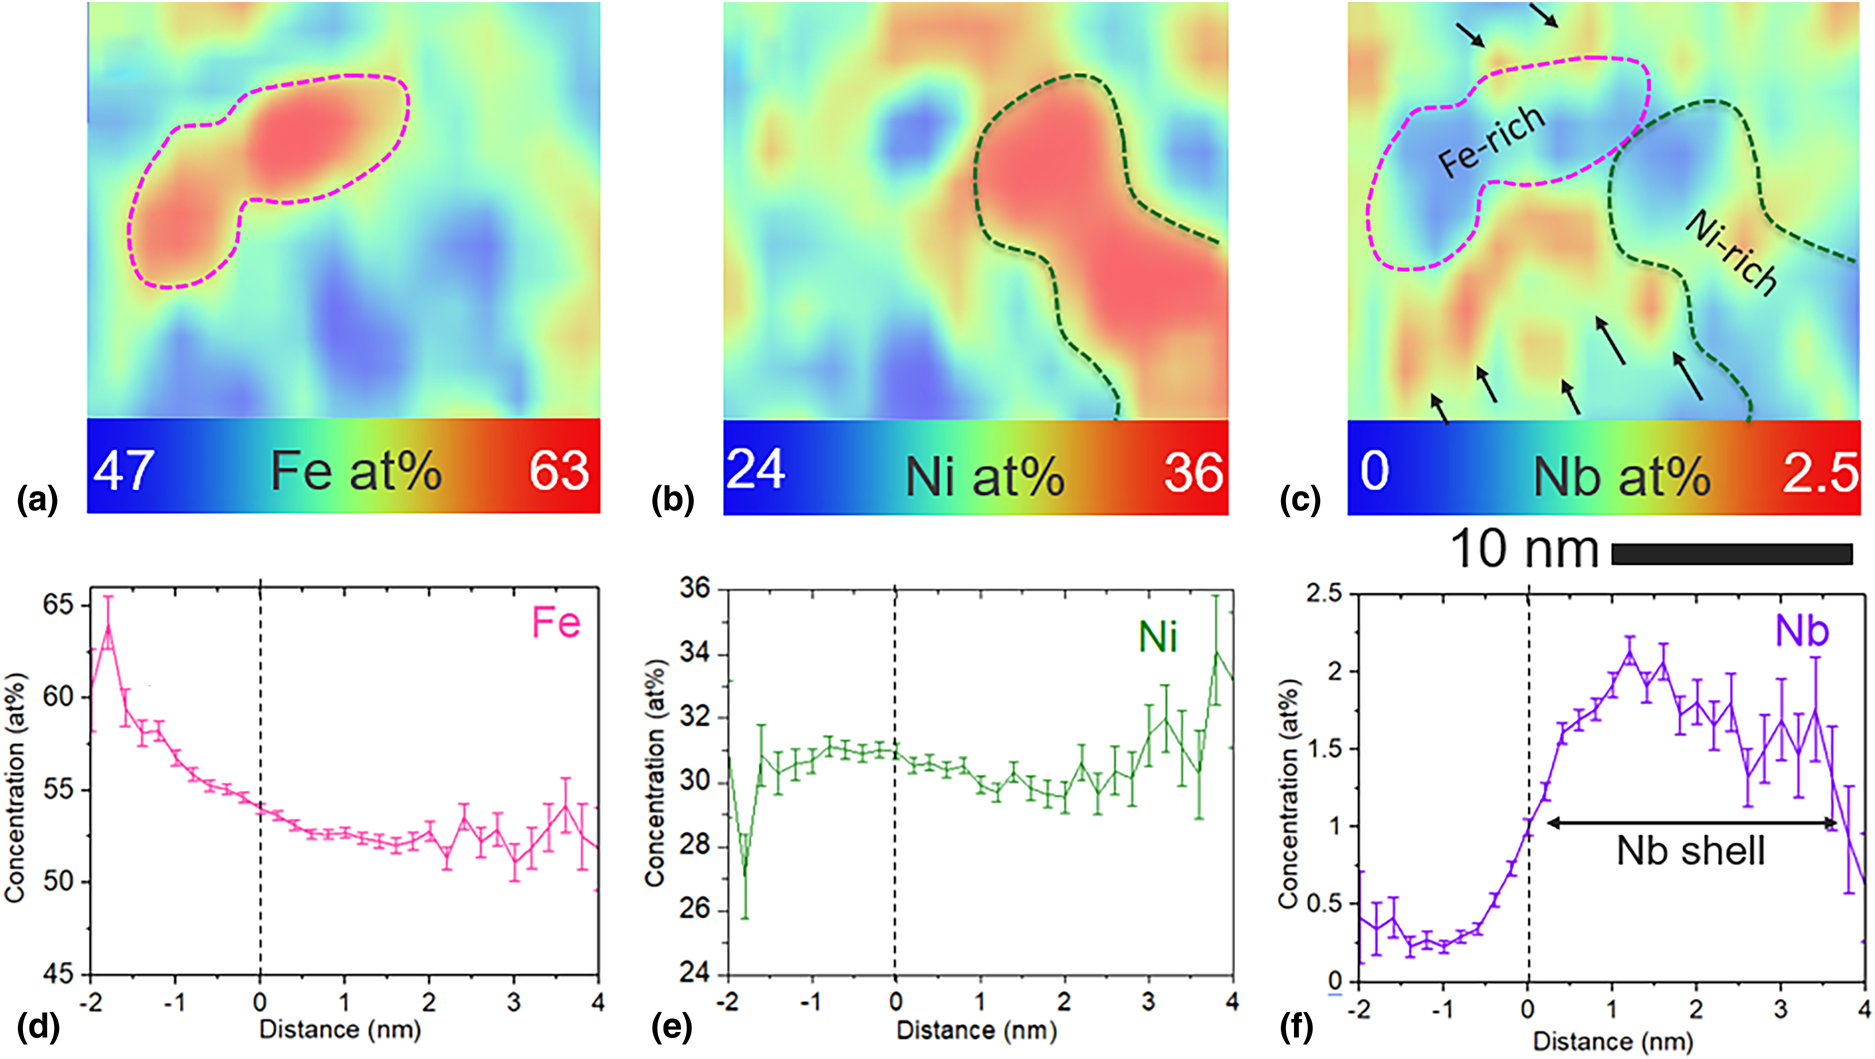
Figure 5: Elemental segregation in a sub-volume of the annealed alloy analyzed via APT. 2D contour plots for (a) Fe, (b) Ni, and (c) Nb are provided with Fe and Ni-rich regions outlined in pink and green, respectively. In (c), black arrows point toward regions of Nb enrichment at the surface of crystalline regions. Corresponding concentration profiles for Fe, Ni, and Nb are given in (d–f), respectively for a 1 at.% Nb iso-concentration surface. The vertical dashed lines in the concentration profiles indicate the location of the 1 at.% Nb iso-concentration surface. 2D contour plots were generated from a volume of 18 nm × 19 nm × 1 nm. Concentration of each element was analyzed in the thickness direction. Color scale bars provide the concentration of the selected element in at. %.
To illustrate and explain the tendency for Fe-segregation to the BCC nanocrystalline phase and Ni-segregation to the FCC nanocrystalline phase, Gibbs free energy versus composition curves were extracted from Thermocalc and plotted at the crystallization temperature for binary FeNi alloys in the BCC, FCC, and liquid phase as well as for more realistic compositions in the liquid phase. Free energy curves are presented in Fig. 6 as well as tangent lines which help to indicate the BCC and FCC compositions for a nominal binary alloy composition of Fe0.7Ni0.3 which satisfy both the (i) common tangency condition corresponding to phase equilibrium (circles) and (ii) parallel tangency condition corresponding to the composition of each phase with the highest probability to nucleate from the liquid (arrows) [Reference Ohodnicki, Laughlin, McHenry and Widom14]. It can be observed that for both conditions, Ni-enrichment of the FCC phase and Fe-enrichment of the BCC phase would be expected, and the predictions for both are similar in terms of the compositions identified. While the predicted enrichment of Ni in the FCC phase is reasonably consistent with the experimentally determined compositions of the Ni-enriched regions from a quantitative perspective (~38–40% Ni predicted, ~42% experimentally) that of Fe in the BCC phase is greatly overestimated (~95–97% Fe predicted, ~68% experimentally) by the predictions. In the case of Co-rich alloys, more realistic thermodynamic predictions for the amorphous phase by incorporating experimentally derived enthalpies of crystallization and/or first-principles calculations improved quantitative agreement using the parallel tangency condition [Reference Ohodnicki, Laughlin, McHenry and Widom14]. Such improvements may also be needed in the case of the FeNi alloys as well but are beyond the scope of the current study. As a first approximation, free energy versus composition curves of more realistic liquid phase chemistries were extracted from Thermocalc as presented in Fig. 6(b) and compared with the binary FeNi-liquid phase. Similar slopes of all free energy curves across the composition range of interest surrounding Fe:Ni ratios of 70:30 would not explain the deviation between experiment and theory for the Fe-enriched BCC regions. In contrast, kinetic limitations may preclude compositional segregation of Fe to such a large extent during the crystallization process. More rigorous analysis of the thermodynamic driving forces for compositional segregation may also be required and can be the subject of future research and investigations.
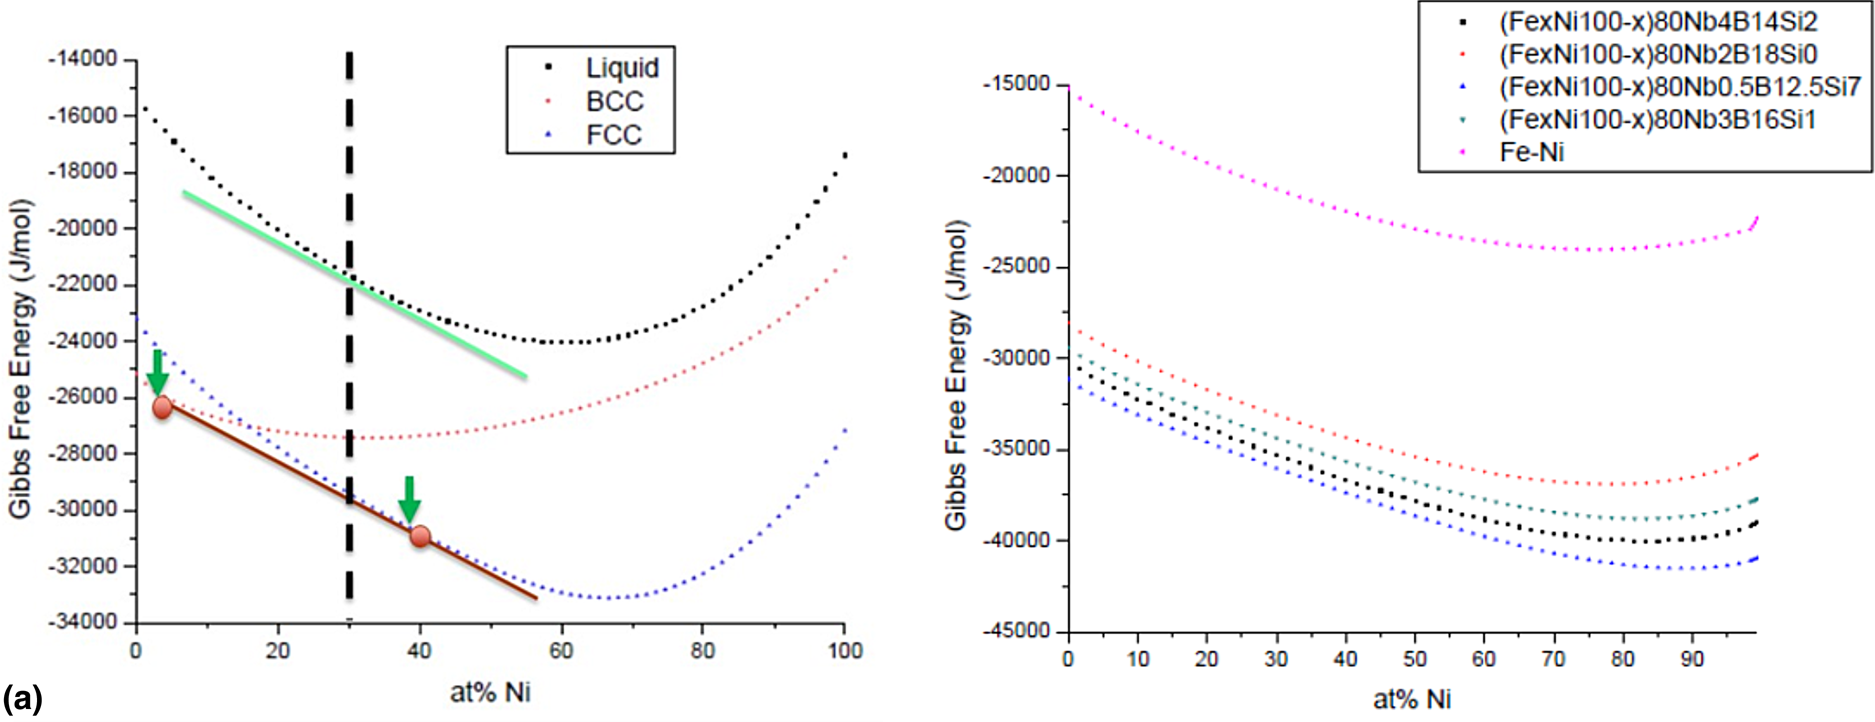
Figure 6: (a) Free energy versus composition curves for BCC, FCC, and liquid binary FeNi alloy at 440 °C (crystallization temperature) and (b) corresponding free energy versus composition curves for realistic liquid phase compositions. (Green arrows/line = parallel tangency condition to maximize driving force for nucleation, red circles/line = common tangency condition for equilibrium, following the methods described previously [Reference Ohodnicki, Laughlin, McHenry and Widom14]).
Conclusions
A detailed, nanoscale experimental investigation of a (Fe70Ni30)80Nb4Si2B14 MANC alloy with multiple nanocrystalline phases is presented using a combination of TEM and APT to explore both microstructure and compositional segregation at the nanoscale. HRTEM confirms that both individual BCC and FCC nanocrystals are embedded within an amorphous matrix, and BCC and FCC nanocrystals are in direct contact with one other exhibiting well-known BCC/FCC orientation relationships. Complementary APT results confirm compositional segregation associated with the crystallization process which occurred after casting and annealing. Results also show evidence for three distinct types of regions within the microstructure: (i) Fe-enriched, (ii) Ni-enriched, and (iii) B-enriched regions which are attributed to the BCC, FCC, and amorphous intergranular phases, respectively. Evidence for Nb enrichment (i.e., the “Nb-shell”) surrounding crystalline regions is also experimentally observed via APT. The Nb-shell is hypothesized to play an important role in limiting the characteristic microstructural feature size to the nm-range for MANCs by acting as a diffusion barrier which prevents grain coarsening. The application of both the common and parallel tangency condition to describe BCC and FCC composition of the thermodynamically stable and highest thermodynamic driving force, respectively, show similar results and a tendency for Fe-enrichment of BCC and Ni-enrichment of FCC phases, further confirming experimental results. Results presented here provide an enhanced understanding of the nanoscale structural and compositional evolution of emerging alloys for power and energy applications spanning electric motors, transformers, and others.
Materials and Methods
Bulk alloy ingots of composition (Fe70Ni30)80Nb4Si2B14 were prepared from constituent elemental materials through arc melting techniques and used as feedstock for rapid solidification processing with an Edmund Buehler MSP 10, employing a Cu wheel with a surface speed of 35 m/s. Amorphous metal ribbons were confirmed after rapid solidification processing through X-ray diffraction and bend-tests which showed excellent ductility. Ribbons were then wound into a toroidal core and subjected to an annealing treatment of T = 440 °C for 1 h to produce a partially devitrified MANC alloy. The temperature was selected to produce optimized magnetic properties as reported in prior work [Reference Aronhime, Zoghlin, Keylin, Jin, Ohodnicki and McHenry3, Reference Aronhime, DeGeorge, Keylin, Ohodnicki and McHenry4]. A sample was prepared for TEM analysis through standard lift-out techniques using a NOVA Focused Ion Beam (FIB) based scanning electron microscope (SEM). Samples were approximately 10 μm in width and 5–10 μm in depth after the final thinning stages to successfully realize electron transparency. High-resolution and high-angle annular dark-field imaging were then performed using both an FEI Tecnai F20 and an aberration-corrected FEI Titan G2 80–300 TEM/STEM from a region farther than 500 nm from the top surface to ensure a microstructure representative of the ribbon bulk.
Needle specimens for APT analysis were prepared from Fe–Ni as cast and annealed ribbons. Bulk FIB lift-outs were performed to shape APT needles from as-cast and annealed samples. A CAMECA LEAP 4000× HR system was used for data collection in the voltage pulsing mode. User-selected parameters for data collection included: 200 kHz pulse repetition rate, 20% pulse fraction, 45 K specimen temperature, and 0.005 atoms/pulse detection rate. Data reconstruction and analysis was performed using IVAS version 3.8.2.
Gibbs free energy curves were generated using Thermocalc 2018b using the TCFE9 Steel/Fe-Alloys v9.0 database. Gibbs free energy was plotted for the crystallization products, and the liquid as Ni content was varied from 0 to 100% in an Fe–Ni binary alloy. The Gibbs free energy curves were also plotted versus %Ni for the liquid phase in pseudo-binary alloys containing different glass former compositions.
Acknowledgments
APT sample preparation and analysis was conducted using facilities at the Environmental Molecular Sciences Laboratory, a national scientific user facility sponsored by the DOE's Office of Biological and Environmental Research and located at the Pacific Northwest National Laboratory (PNNL). PNNL is operated for the U.S. DOE by Battelle Memorial Institute under contract no. DE-AC05-76RLO1830).


 Open access