


Impact Statement
While an accurate and all-encompassing characterization of descent aerodynamics has been a key focus in previous rotorcraft research, the significance of rotor–rotor interactions in this flight stage has so far been largely unaddressed. Potential application areas of this work include design strategies for multirotor configurations and operational guidelines, for instance the maximum safely allowable descent rate, among others. The experimental analysis, furthermore, demonstrates that the mean aerodynamic performance of multirotor vehicles with rotor separation distances of greater than 1.5 times the rotor diameter is relatively insensitive to the number of rotors and their separation in descent, confirming that their descent behaviour can be modelled in single-rotor tests without significant loss of accuracy, which greatly simplifies future experimental and computational investigations. At the same time, we find that the global rotor flow field in axial descent undergoes considerable changes when introducing a second, nearby rotor, providing a deeper fundamental understanding of vortex ring state aerodynamics.
1. Introduction
Previous research efforts to better understand rotorcraft performance across various flight stages, including axial descent, have largely been limited to the analysis of single-rotor systems. Informed by studies that evaluated the aerodynamic performance of large-scale, variable-pitch rotors (Reference Castles and GrayCastles & Gray, 1951; Reference Washizu, Azuma, Koo and OkaWashizu, Azuma, Koo, & Oka, 1966b) and small-scale, fixed-pitch rotors in axial descent (Reference Shetty and SeligShetty & Selig, 2011; Reference Stack, Caradonna and SavaşStack, Caradonna, & Savaş, 2005) as well as qualitative and quantitative flow visualizations (Reference Drees and HendalDrees & Hendal, 1951; Reference Green, Gillies and BrownGreen, Gillies, & Brown, 2005; Reference Stack, Caradonna and SavaşStack et al., 2005), single-rotor aerodynamics in axial descent are reasonably well understood: when descending in a vertical trajectory, a rotorcraft inherently enters its own rotor downwash, which leads to a recirculation of the rotor flow. At descent rates close to the induced rotor flow velocity, the flow field becomes highly unsteady and is characterized by the deflected downwash forming a vortex ring system engulfing the rotor disk (Reference LeishmanLeishman, 2000, pp. 53–63). This flow state is commonly known as vortex ring state (VRS) (Reference JohnsonJohnson, 1980, pp. 93–122). Rotorcraft entering the VRS are subject to significant reductions in the net thrust output and a strong low-frequency oscillatory behaviour of the airloads (Reference Bangura, Melega, Naldi and MahonyBangura, Melega, Naldi, & Mahony, 2016; Reference Shetty and SeligShetty & Selig, 2011) caused by operation in the recirculating wake. These aerodynamic losses and vibrations can be of significant magnitude, and can potentially lead to unrecoverable flight conditions.
To date, the descent characteristics of multirotor systems and the effect of rotor–rotor interactions in axial descent have only been sparsely explored. However, with the steadily growing use of multirotor platforms in research, industrial and private settings, a closer examination of potential rotor–rotor interaction across all flight stages, including descent, becomes increasingly significant. The key parameters that are introduced in this context compared with single-rotor systems include not only the number of rotors in the flow field but also their separation. Furthermore, it has to be considered that these unmanned rotor systems typically operate in much lower Reynolds number regimes ( $Re<10^6$) compared with manned helicopters.
Previous efforts specifically investigating the effect of rotor–rotor interactions have so far predominantly been focused on hover scenarios, generally suggesting that non-overlapping rotors essentially operate at isolated performance, without any appreciable interference (Reference Shukla and KomerathShukla & Komerath, 2018; Reference SweetSweet, 1960). In-depth studies, closely examining the significance of separation distance between closely arranged rotors without overlap in hover (Reference Yoon, Lee and PulliamYoon, Lee, & Pulliam, 2016; Reference Zhou, Ning, Li and HuZhou, Ning, Li, & Hu, 2017), noted a single-digit percentage performance deterioration when rotors were separated by less than two diameters.
Meanwhile, the effects of rotor–rotor interactions in axial descent is currently much less established and the few existing studies were primarily done on experimental set-ups with fixed rotor separation. For instance, early experimental efforts (Reference Washizu, Azuma, Koo and OkaWashizu, Azuma, Koo, & Oka, 1966a) on semioverlapping rotors found that the overall performance of tandem rotors remained comparable to single rotors (Reference JohnsonJohnson, 2005), but changes to the oscillatory behaviour of the airloads were observed. Other studies measuring the descent performance of non-overlapping twin-rotors associated with tiltrotor arrangements utilized an image plane to simulate the effect of a second rotor in wind tunnel tests (Reference BetzinaBetzina, 2001). Results showed that the image plane significantly changed the descent characteristics compared with an isolated, single rotor, suggesting considerable rotor–rotor interactions in descent. The largest discrepancies between single rotor tests and rotors with image plane were, however, found at non-axial descent angles of  $50^{\circ }$ to $70^{\circ }$, while results at $90^{\circ }$ (i.e. axial descent) were much closer to one another. Furthermore, the authors of the study acknowledged that using an image plane may not be an accurate aerodynamic representation of a two-rotor system, which would be confirmed in later experiments (Reference Abrego and LongAbrego & Long, 2002), where results were considerably different for a dual-rotor vehicle compared with a single rotor with image plane. This study also indicated a considerable difference in the overall descent characteristics of a two-rotor system compared with that of a single, isolated rotor. True free-flight experiments on a V-22 tiltrotor showed the typical thrust deficit and thrust fluctuations experienced by all rotorcraft in descent, while simultaneously observing pronounced VRS-induced roll rates due to thrust asymmetry between the two rotors (Reference Brand, Kisor, Blyth, Mason and HostBrand, Kisor, Blyth, Mason, & Host, 2004), confirming that previous models for the VRS boundary developed for conventional helicopters also apply to tiltrotors.
To date, only few computational efforts have been dedicated to the investigation of non-overlapping, twin-rotors (Reference Takii, Yamakawa and AsaoTakii, Yamakawa, & Asao, 2020) or multirotors (Reference McQuaid, Kolaei, Bramesfeld and WalshMcQuaid, Kolaei, Bramesfeld, & Walsh, 2020; Reference Veismann, Wei, Conley, Young, Delaune, Burdick and IzraelevitzVeismann et al., 2021) in descent, which similarly indicated severe aerodynamic losses and strong vehicle oscillations while providing a closer look into the flow field properties of these rotor systems in the VRS. It is worth noting that all aforementioned studies exclusively considered counter-rotating rotor arrangements, as this is typically used in practice for torque balancing. Given the sparsity of available data regarding twin-rotors or multirotors in axial descent and the, at times, conflicting findings of previous experimental and computational studies, more research is clearly needed to fully establish the significance of the rotor spacing in descent and to comprehensively characterize inter-rotor effects within this flight stage.
This study, therefore, aims to better understand the aerodynamic coupling between two closely arranged, small-scale rotors in steady axial descent and assess the extent to which a rotor's performance in the VRS is affected by the operation of a close neighbour. Experiments were performed on a small-scale, dual-rotor system with adjustable rotor separation in a low-speed, open-jet vertical wind tunnel. Aside from the rotor separation, secondary effects of the rotor size (and geometry) as well as rotor rotation rate (and Reynolds number) were also considered. Load cell measurements were used to quantify the combined mean thrust and thrust fluctuations of both rotors as a function of the simulated descent velocity. While the static mean thrust is a critical metric that directly reflects a rotorcraft's capability of remaining airborne, measurements of thrust fluctuation allow indirect assessment of the vehicle's stability and controllability in this flight regime. By comparing the obtained dual-rotor data with single-rotor experiments, the validity of characterizing multirotor VRS behaviour by means of single-rotor experiments was examined. Two-dimensional particle image velocimetry (PIV) flow field analysis was conducted alongside the aerodynamic tests to determine the underlying flow patterns around two closely arranged rotors in axial descent and to identify potential interactions.
2. Rotor aerodynamics in vertical descent
A brief overview of rotor aerodynamics in vertical flight is provided in the following. Readers are encouraged to consult the available literature for further reading (Reference JohnsonJohnson, 1980, pp. 93–122, Reference Johnson2005; Reference LeishmanLeishman, 2000, pp. 53–63).
The critical axial flight regime of a rotor can fundamentally be determined using the definitions of the momentum theory, which is a basic mathematical model describing the flow field of an ideal actuator disk (see figure 1). By approximating the rotor as an infinitely thin disk with a pressure discontinuity across its face in a perfect, steady and incompressible fluid, an analytic expression for the induced velocity at the disk can be derived (Reference JohnsonJohnson, 1980, pp. 93–122). For hover conditions ( $v_c=0$), often serving as reference conditions, the momentum theory expression yields
 \begin{equation} v_h = \sqrt{\frac{T}{2\rho A}} , \end{equation}
where  $T$ is the rotor thrust, $A$ the disk area and $v_c$ the climb velocity ( $v_c<0$ in descent). The momentum theory further states that flow contraction in the far field results in an increase in wake velocity, to a theoretical maximum of twice the velocity at the rotor disk ( $2v_i$). Thus, for rapid descent rates of a rotor system ( $v_c<-2v_i$), all flow in the flow field is nominally directed upward and the flow field is assumed to be well behaved. In this case, known as the windmill brake state, the rotor flow is outlined by a clearly defined slipstream.

Figure 1. Normalized induced velocity of a rotor in axial flight derived from momentum theory (adapted from Reference LeishmanLeishman (2000, pp. 53–63)) and corresponding schematic rotor flow fields for the different rotor working states in axial flight prescribed by the momentum theory.
However, due to non-physical flow conditions of the model at moderate descent rates (i.e. upward directed flow at the rotor disk while the far wake flow is still directed downward according to the model), the momentum theory loses validity within the range  $-2v_i< v_c<0$, where the slipstream is no longer clearly identifiable (Reference LeishmanLeishman, 2000, pp. 53–63). This critical region of $-2v_i< v_c<0$, characterized by both upward and downward directed flows in the rotor near-field, is further divided into two states based on the directionality of flow through the rotor. The VRS ( $v_c+v_i>0$) is described by nominally downward directed flow at the rotor disk which is subsequently reingested. The developing vortex ring system in this state results in high levels of unsteadiness and leads to pronounced aerodynamic losses. As descent rates increase and the flow direction at the rotor changes sign ( $v_c+v_i<0$), the rotor operates in the turbulent wake state (TWS), which is defined by nominally upward directed flow at the actuator disk, leading to reduced recirculation and vibrational loads compared with the VRS.
Even though the aforementioned momentum theory model is merely a first-order approximation with numerous simplifying assumptions that do not capture local flow physics and loses validity at moderate descent rates, it provides a valuable assessment of the critical axial descent velocity range for a rotorcraft ( $-2v_i< v_c<0$), where its performance is expected to be compromised due to unfavourable descent aerodynamics.
In the past, many researchers have sought to better understand the complex aerodynamics of single rotors in axial descent. Since the momentum theory is not valid within  $-2v_i< v_c<0$, their efforts have particularly been focused on expanding the model into this regime using various experimental approaches (e.g. Reference Castles and GrayCastles & Gray, 1951; Reference Washizu, Azuma, Koo and OkaWashizu et al., 1966b). Therefore, the induced velocity of a rotor, $v_i$, is commonly used as the metric to describe a rotor's performance across all descent stages and previous findings show a strong increase in the induced velocity in the VRS compared with hover conditions (see figure 1). The acquired data has led to empirically derived expressions describing the induced velocity within the VRS (Reference LeishmanLeishman, 2000, pp. 53–63),
 \begin{equation} v_i = {-}v_h\left[\kappa + k_1\left(\frac{v_c}{v_h}\right) + k_2 \left(\frac{v_c}{v_h}\right)^2 + k_3\left(\frac{v_c}{v_h}\right)^3 + k_4\left(\frac{v_c}{v_h}\right)^4\right], \end{equation}
with  $k_1=-1.125$, $k_2=-1.372$, $k_3=-1.718$, $k_4=-0.655$, or alternatively (Reference JohnsonJohnson, 1980, pp. 93–122)
 \begin{equation} \frac{v_i}{v_h} = \kappa\frac{v_c}{v_h}\left[0.373 \left(\frac{v_c}{v_h}\right)^2-1.991\right], \end{equation}
for the range of  $-2< v_c/v_h<-1$).
Due to the profound unsteadiness and the high levels of turbulence in the rotor flow field in axial descent, the average rotor-induced velocity is rarely directly measured as this cannot be done reliably. Instead, one approach for estimating the induced velocity of a rotor across all descent stages is provided by the blade element theory, which requires knowledge of the rotor blade geometry and operating state (Reference JohnsonJohnson, 2005; Reference Shetty and SeligShetty & Selig, 2011),
 \begin{gather} \frac{3}{2}(B^2-r_c^2)\lambda = {-}\frac{6 C_t}{\sigma C_{L_\alpha}} + \theta_{.75}(B^3-r_c^3) \left(1 + \frac{3}{2}\mu^2\right), \end{gather}
 \begin{gather} \lambda = \frac{v_c + v_i}{\varOmega R}, \end{gather}
where  $r_c$ is the root cutout, $R$ is the rotor radius, $\lambda$ is the non-dimensional rotor inflow, $C_t$ is the thrust coefficient, $\sigma ={N_bcR}/{A}$ is the rotor solidity, $C_{L_\alpha }$ is the two-dimensional lift-curve slope, $\theta _{.75}$ is the geometric pitch at 75 % of the rotor radius, $\mu$ is the advance ratio ( $\mu =0$ for vertical flight) and $\varOmega$ is the rotor rotational rate. The tip loss factor B is estimated with (Reference Bramwell, Done and BalmfordBramwell, Done, & Balmford, 2001)
 \begin{equation} B = 1-\frac{\sqrt{C_t}}{N_b} \end{equation}
and is typically found to be in the range of 0.95–0.98 for large-scale rotors (Reference LeishmanLeishman, 2000, pp. 53–63). Frequently, the lift-curve slope,  $C_{L_\alpha }$, is assumed to be constant within the range of $5.7$– $2{\rm \pi}$ (Reference JohnsonJohnson, 1980, pp. 93–122). For a given rotor geometry ( $\sigma$, $\theta _{.75}$, $R$,
$R$,  $r_c$) and experimentally measured operational parameters ( $\varOmega$, $C_t$, $v_c$), (2.4) and (2.5) can be solved for $v_i$ and be compared with existing, single-rotor models.
3. Methodology
3.1 Experimental apparatus
The aerodynamic interference of closely arranged rotors in axial descent was evaluated for pairs of counter-rotating rotors utilizing a dual-rotor set-up with adjustable separation. Static wind tunnel tests were performed in a vertical, open-jet, multifan wind tunnel (see figure 2, left) for establishing the rotor performance as a function of simulated descent rate. This wind tunnel is composed of 121 individual direct current (DC) fan units with a total test section size of approximately  $1054\ {\rm mm} \times 1054\ {\rm mm}$, which is much greater than the largest rotor dimension and, therefore, edge effects should be insignificant. The wind tunnel can achieve velocities within the range of $0.8\ {\rm m}\ {\rm s}^{-1}$ to $9.6\ {\rm m}\ {\rm s}^{-1}$ with a turbulence intensity of approximately $0.4\,\%$ when all integrated flow manipulation devices, including flow straightener, perforated plates and wire meshes are installed. Velocity and turbulence intensity measurements were performed prior to testing in the part of the flow where the rotors were located but without the rotor assembly installed. The velocity sign convention used throughout this work is that the positive axis is oriented downward (i.e. the vertically rising flow of the wind tunnel, $v_c$, is negative, while the direction of the rotor flow, $v_i$, is positive, refer to figures 1 and 3).

Figure 2. Experimental wind tunnel set-up (flow manipulators and structural elements not displayed for illustration purposes) and schematic PIV set-up in air using soap bubbles as tracer particles.

Figure 3. Physical designs of the dual rotor systems (electronics and wiring not displayed) and investigated rotors.
The dual-rotor system (see figure 3) was mounted to a one-dimensional load cell above the wind tunnel via a load cell coupler, measuring the combined rotor thrust force of both rotors at a sampling frequency of  $2000$ Hz. To minimize flow interference, the structure supporting the rotors consisted of streamwise-oriented carbon fibre tubes above the rotors which were rigidly mounted to the load cell via a downstream, horizontal cross-member. Additionally, the rotors operated in a pusher configuration (i.e. the motors were located wind-tunnel-downstream of the rotors) to ensure a completely unobstructed rotor wake and clean, undisturbed rotor inflow conditions. The motors were supplied with continuous DC power and their rotational speed was set by a microcontroller in open-loop control via a pulse-width modulation (PWM) signal, ensuring a highly accurate and repeatable input. Using optical revolutions per minute (r.p.m.) sensors for continuous recordings, the motor input signals were adjusted prior to wind tunnel testing such that both motors operated at near-identical rotation rates. Measurements also showed that the open-loop control strategy provided consistent rotor rotation rates throughout test runs, independent of the simulated climb velocity and rotor operating state (see figure 4). Baseline measurements of single rotor configurations for comparison were obtained by removing the downstream cross-member and directly mounting the streamwise-oriented tube to the load cell.

Figure 4. Time histories of a representative test run (configuration: 6 in. rotors;  $S=2$; $\sim 10410$ r.p.m.). Incrementally increasing simulated descent velocity (a), raw measured combined thrust of both rotors (b), mean thrust and thrust standard deviation of both rotors over 10 second intervals (c) and rotor rotation rates (d). Note that the descent velocity, $v_c$, (i.e. the wind tunnel velocity) is negative. To emphasize the increase in wind tunnel velocity, the absolute value, $|v_c|$ is used in (a).
Three sets of commercially available small-scale, fixed-pitch rotors (6 in., 5 in., and 4 in. two-bladed rotors) were investigated (see figure 3, right). Geometric and operational properties of the three different rotors are listed in table 1 under the designation (diameter  $\times$ pitch). While these rotors were chosen as they presented a similar planform shape, their airfoil selection and pitch differed from one another. Geometric parameters were obtained by manual measurements and the $C_t$-coefficients were established on a dedicated RC Benchmark Series 1580 thrust stand. For each size, a pair of rotors, one designed for clockwise and one for anticlockwise rotation, was mounted on the dual-rotor set-up. For practical reasons, this study only considered counter-rotating systems, as this is generally required on multirotor vehicles for torque balancing (note that adjacent rotors on multirotor vehicles are typically designated as counter-rotating). Commercial products were chosen as opposed to custom three-dimensionally printed rotors, because they are precisely manufactured as geometrically matched pairs, which is typically difficult to achieve with custom-made designs. A further incentive was to examine how readily available commercial products are affected by the VRS characteristics. The adjustable, normalized separation between rotors, $S$, was defined by the ratio of distance between rotation axes to rotor diameter, with values examined within the range of
 \begin{equation} S = \frac{d}{D}, \quad S = [1.0, 1.5, 2.0]. \end{equation}
This range of rotor separations was selected as it is largely consistent with the majority of commercially available recreational and industrial multirotor platforms.
Table 1. Measured geometric and operational parameters of the investigated rotor models.

3.2 Experimental procedure
The key focus of the experimental campaign was understanding the performance and interaction of two rotors with varying separation in steady, axial descent. Particularly, the mean and variance of the thrust as a function of simulated descent rate (i.e. wind tunnel free stream velocity) were of interest. The approach for testing each combination of rotor size, separation, and thrust level followed the same procedure: initially, a prespecified PWM signal was sent to both motors, spinning the pair of installed rotors up to a given rotational speed, which was maintained constant throughout the test run. With the wind tunnel at rest, the thrust force for the given rotation rate was measured, corresponding to the hover thrust,  $T_h$, which was used in the following as a reference value. Subsequently, while maintaining a constant rotational speed and power input, the wind tunnel free stream velocity was incrementally increased from 0.8 m s $^{-1}$ to 9.6 m s $^{-1}$, in approximately 0.44 m s $^{-1}$ steps. For each velocity increment, the mean and standard deviation of the thrust history was recorded over 10 s periods. Accordingly, these measurements correspond to quasi-steady-state descent performance for a given rotor rotational rate. This procedure was repeated for multiple combinations of rotor rotation rates, rotor separations and rotor size. Note that $T'$ represents the continuous thrust measurements in the following while $T$ denotes the average measurement ( $T(v_c)=\overline {T'}(v_c)$). It is also worth noting that prior to calculating the standard deviation, $\sigma (T')$, the raw thrust signal was low-pass filtered to 50 Hz, which is explained in more detail in § 4. A representative time history of a single test run shown in figure 4 illustrates the testing process with incrementally increasing simulated descent velocity (figure 4a). The thrust history (figure 4b) shows the raw thrust measurements of the rotor pair for a constant rotation rate over time, clearly demonstrating a loss in mean thrust and the presence of severe vibrations introduced by the VRS aerodynamics with increasing wind tunnel velocity. This can be confirmed by the 10 s mean measurements and the calculated standard deviation (figure 4c). To account for the parasitic drag of the supporting structure (i.e. motors, structural tubing, electronics), the drag forces generated by the dual-rotor and single-rotor set-up were measured in separate test runs by removing the rotor blades. These tests also followed the aforementioned test procedure, where the wind tunnel velocity was incrementally increased and the load cell measurements of the drag values of the support structure were averaged over 10 s intervals for the given wind tunnel velocity. The same wind tunnel velocity steps that were selected to establish the drag baselines were also selected in each rotor test (see steps in figure 4a). The drag baselines were later subtracted from the raw rotor thrust measurements for each discrete wind tunnel velocity during post-test data processing.
3.3 PIV setup
The PIV flow field analysis was performed alongside the vertical wind tunnel experiments for visualizing the underlying flow patterns around two interacting rotors in axial descent. The PIV set-up is schematically depicted aside the experimental wind tunnel set-up in figure 2. A double-pulsed Nd:YAG laser and light sheet optics generated a two-dimensional laser sheet with a usable region of interest (ROI) of approximately  $490\ {\rm mm} \times 255\ {\rm mm}$. The wind tunnel free stream flow was seeded with microscopic soap bubbles as tracer particles, which were introduced upstream of the wind tunnel. Because the rotor support structure (motors and streamwise tubes) obscured direct optical access for the laser between the rotors, the laser plane was shifted in front of these components (see figure 2, bottom view) to achieve illumination across the full image plane, enabling observation of the rotor flow of both rotors as well as the flow in the inter-rotor region. Sets of image pairs, shifted by ${\rm \Delta} t=100\ \mathrm {\mu }{\rm s}$ were recorded at various descent rate ratios at the maximum laser pulsing frequency of $15\ {\rm Hz}$ and subsequently processed in a PIV software. Wind tunnel velocities and thrust measurements were recorded alongside for determining the descent rate ratio, $v_c/v_h$, and for correlating the flow field with the measured thrust losses. It is worth noting that, given the maximum laser pulse frequency of $15\ {\rm Hz}$, which is far lower than the rotational frequencies of the rotors, this PIV study only provides ensemble-averaged (time-averaged) results, without the possibility of observing dynamic behaviour.
4. Discussion of results
Wind tunnel tests for counter-rotating pairs of all three rotor sizes with varying separation and rotation rates (i.e. thrust level) were performed in accordance with the procedure described in § 3.2, where the rotor performance (i.e. mean and standard deviation of the measured thrust) was evaluated as a function of simulated descent rate. To facilitate a comparison between test runs, the measured mean rotor thrust,  $T$, corresponding to the combined thrust of both rotors, and the simulated descent velocity, $v_c$, were normalized by the initial hover thrust, $T_h$, and the initial hover induced velocity $v_h=\sqrt {(T_h/2\rho A)}$, respectively. Figure 5, showing the combined mean thrust of two rotors as measured by the load cell for a representative configuration (6 in. rotors, $S=2.0$), illustrates the process of data normalization. Note that the simulated descent velocity $v_c$ is negative, and as a result the descent rate increases from right to left in the figures. The normalized thrust values are all brought into close alignment to a characteristic mean-thrust-curve for this rotor geometry and separation with an inherent thrust minimum independent of the rotor rotation rate. The ratio-scaling, therefore, helps to eliminate the influence of the initial thrust level (i.e. rotation rate for these fixed-pitch rotors) and rotor size, and proves that thrust losses in vertical flight for constant rotor rotation rate are proportional to the hover thrust (i.e. relative losses are independent of the hover thrust).

Figure 5. Representative raw and normalized mean thrust measurements for three test runs at different rotation rates (6 in. rotors,  $S=2.0$). (a) Non-normalized measurements and (b) normalized measurements.
Figure 6 shows the normalized mean thrust of the dual-rotor system for all obtained data sets of varying rotor size, separation and rotation rates (i.e. hover thrust levels) as a function of descent rate ratio,  $v_c/v_h$. Single rotor measurements were also included for comparison, which were obtained using a separate, single-rotor assembly, as described in § 3.1. Remarkably, despite a wide range of investigated rotor separations, rotation rates and number of rotors, the thrust response of all data sets for each rotor size generally displays a non-dimensional character, where the measurements of single and dual-rotors follow a similar curve. Under consideration of these results, it appears that the mean thrust generation in axial descent is largely independent of the rotor separation and the number of rotors in the flow field as well as the thrust level or rotor rotation rate for fixed-pitched rotors. This is strictly speaking, however, only true on a general level, as certain discrepancies in the data sets for each rotor can be observed. Most notably is that the critical descent rate ratio, $v_c/v_h$, where $T/T_h$ is lowest, appears to be shifted towards higher descent rate ratios for small rotor separations ( $S=1.0$). The greatest increase in $(v_c/v_h)_{crit}$ of 5.9 % compared with the other rotor separations was recorded for the 4 in. rotor. Furthermore, $min(T/T_h)$ decreases an additional 2 % at $S=1.0$ for the 5 in. and 4 in. compared with $S=1.5$ and $S=2.0$, further increasing VRS losses compared with larger separations and single rotors. Even though a certain degree of data scattering is expected due to turbulent flow conditions in descent, this observation holds for each of the investigated rotor sizes, which is why it is believed that these are physical differences in the descent performance and as opposed to random data scatter.

Figure 6. Normalized mean thrust of two counter-rotating rotors with varying separation distances and hover thrust as a function of descent rate ratio.
Meanwhile, more evident discrepancies in the characteristic thrust-descent-rate-curve and magnitude of the peak thrust losses for a constant rotation rate can be observed across the different rotor sizes investigated here with maximum thrust reductions ranging from  $0.67T_h$ to $0.76T_h$. These discrepancies in the general shape of the characteristic curves are assumed to be due to changes in the rotor blade geometry, which has been shown to be a deciding factor determining the magnitude of maximum thrust losses in axial descent (Reference Veismann, Yos and GharibVeismann, Yos, & Gharib, 2022). Out of the investigated rotors, the greatest thrust reduction of up to 33 % compared with hover conditions was recorded on the 6 in. rotor pair and it can be shown here that a greater geometric pitch, $\theta _{.75}$ (compare with table 1) reduces variation of the mean thrust with descent rate. This is consistent with previous studies of large-scale (Reference Brown, Leishman, Newman and PerryBrown, Leishman, Newman, & Perry, 2002) and small-scale rotors (Reference Langkamp and CrowtherLangkamp & Crowther, 2010; Reference Shetty and SeligShetty & Selig, 2011; Reference Veismann, Wei, Conley, Young, Delaune, Burdick and IzraelevitzVeismann et al., 2021). Another noteworthy observation from figure 6 is that the critical descent rate ratio appears to remain largely unchanged at approximately $-1.2>v_c/v_h>-1.3$ for all test runs and rotor sizes, confirming that $v_c/v_h$ is the primary scaling for VRS aerodynamics. Similar critical descent rate ratios for axial descent conditions have previously been identified (Reference BetzinaBetzina, 2001; Reference Stack, Caradonna and SavaşStack et al., 2005).
Based on the here-obtained measurements, the mean thrust response of the dual-rotor (and single rotors) shows three distinctive features over the descent regime: (1) an initial thrust rise for a constant rotation rate at low descent rates  $(0>v_c/v_h>-0.75)$; (2) the VRS with severe reductions in rotor thrust $(-0.75>v_c/v_h>-1.8)$; and (3) the TWS at higher descent velocities where aerodynamic loads of the rotors recover and exceed hover conditions $(v_c/v_h<-1.8)$. Flow field results corresponding to each of these states are described in more detail in the subsequent section. It should be noted, that the here-obtained results, showing a relatively similar mean thrust performance for different rotor separations, contradict findings of some previous studies (Reference Abrego and LongAbrego & Long, 2002; Reference BetzinaBetzina, 2001), where the descent performance of a twin-rotor system deviated considerably from the isolated rotor results. Meanwhile, other studies determined that rotor–rotor interactions only play a secondary role in the VRS (Reference Brand, Kisor, Blyth, Mason and HostBrand et al., 2004), which is in line with the presented results. One may note that in one of the former studies (Reference BetzinaBetzina, 2001) an image plane was used to simulate the effect of a secondary rotor, which later proved to be an inadequate approach. Another explanation as to why the twin-rotor studies showed large differences between single and dual-rotor tests may be that the interference introduced by any supporting structure (i.e. a wing structure) that was present in these studies can be a critical factor, which is substantiated by their experimental data, showing considerable changes in the descent performance due to structure-related interference.
According to the rotorcraft literature, a low-frequency oscillatory behaviour of the rotor airloads is a further indicator of VRS conditions (Reference JohnsonJohnson, 1980), which is the result of a periodic collapse and subsequent reestablishment of the rotor wake. The time periods of these thrust oscillations have been reported of the order of multiple revolutions (Reference BetzinaBetzina, 2001; Reference Stack, Caradonna and SavaşStack et al., 2005). Figure 7 displays the recorded normalized standard deviation (coefficient of variation),  $\sigma (T')/T$, of the measured thrust history as a function of descent rate. The raw thrust-time histories were digitally low-pass-filtered after obtaining the measurements and prior to calculating the standard deviation for isolating the specific low-frequency content introduced by the VRS aerodynamics from the rotor rotational frequencies. A low-pass frequency cutoff of $50\ {\rm Hz}$ was selected, which was lower than the lowest rotor rotational frequency. Note that varying the frequency cutoff within the range of 10– $100\ {\rm Hz}$ did not change the results of figure 7 appreciably, which validates the low-frequency nature of the VRS induced vibrations and that these vibrations are distinct from those introduced by the rotation of the rotors itself. It can be seen in figure 7 that, as descent rate increases, the coefficients of variation for all data series grow near-linearly by an order of magnitude compared with hover conditions: from $\sigma (T')/T<0.02$ at $v_c=0$ to peak values of $0.14\unicode{x2013}0.20$. Peak fluctuations can be consistently found again at the same critical descent rate ratios of $-1.2>v_c/v_h>-1.3$, where peak mean thrust losses in figure 6 were recorded. As was the case for the measurements of the arithmetic mean, the fluctuations as a function of descent rate generally show a characteristic curve for each of the investigated rotors. Particularly at low descent rates, all data sets show a similar linear increase. However, the data in figure 7 shows a larger amount of scatter, compared with figure 6, particularly at higher descent rates after the VRS has been fully established ( $v_c/v_h<-1.2$). The fluctuation values for the rotor separation $S=1.0$ stands out once more, generally showing much elevated levels during the fully established VRS. Considerable increases in peak fluctuations of up to 42 % can be observed for instance for the 4 in. rotor pair when comparing greater rotor separations ( $S=1.5$ and $S=2.0$) to $S=1.0$. Interestingly, the single rotor set-up shows consistently high peak fluctuations compared with $S=1.5$ and $S=2.0$. One explanation may be that the set-up was changed slightly to accommodate a single rotor instead of two rotors, which may contribute to different vibrational characteristics. The rotor geometry can again be seen to assume a secondary, non-negligible role in figure 7, determining the extent of the maximum thrust fluctuations, which appears to be correlated to the maximum mean thrust losses in figure 6.

Figure 7. Normalized standard deviation of measured thrust of two counter-rotating rotors with varying separation distances as a function of descent velocity. The thrust data was low-pass filtered to  $50\ {\rm Hz}$ prior, which is sufficiently below the rotor rotational frequencies of all tests.
The observations obtained in the wind tunnel tests suggest that, despite the turbulent flow conditions in steady axial descent, the averaged performance parameters of two, closely arranged rotors follow a general curve for each rotor size, with  $v_c/v_h$ being the primary scaling. However, changes in the descent behaviour could be observed when rotors were closely arranged ( $S=1.0$), with slightly higher mean thrust losses and critical descent rate ratios and significantly increased levels of fluctuations. A fully developed VRS can be expected consistently at a critical descent rate ratio of $-1.2>v_c/v_h>-1.3$ with thrust losses of up to 33 % for a constant r.p.m. for the here-investigated, fixed-pitch rotors. These thrust reductions coincide with increased low-frequency vibrations, reaching their highest extent at similar descent rates. Because constant rotor rotational speeds were enforced throughout test runs, the observed thrust reductions and increased vibrational loads must derive purely from aerodynamic effects. Meanwhile, the rotor geometry was found to have a non-negligible, secondary effect on the VRS behaviour, determining the magnitude of maximum thrust losses and peak fluctuations in axial descent (i.e. rotors with higher mean thrust losses also generally show higher levels of vibrations), while the critical descent rate ratio remained largely unchanged for all rotor geometries. This significance of the rotor geometry was previously shown in similar studies (Reference Veismann, Yos and GharibVeismann et al., 2022).
A clue as to why these rotors appeared to operate nearly unaffected by each other for  $S\ge 1.5$ might be provided by the fact that the induced velocity is the predominant scaling for VRS aerodynamics. In this context, previous studies investigating rotor–rotor interaction in hover scenarios (Reference Veismann and GharibVeismann & Gharib, 2020; Reference Yoon, Lee and PulliamYoon et al., 2016; Reference Zhou, Ning, Li and HuZhou et al., 2017) found that the thrust output (and induced velocity) is only affected when rotors operate in close proximity ( $1.0< S<1.5$), with performance losses of the order of single digit percentage compared with isolated performance. Thus, it is believed that, similar to hover conditions, rotors operate in a highly localized area of influence in VRS without affecting each other's inflow considerably at medium and larger separations. Only at very small separations for $S<1.5$, rotor interference becomes relevant.
Given that the mean thrust data from single and dual-rotor tests for each rotor size follows a similar curve (see figure 6), one may also examine how measurements of these small-scale rotors compare with established VRS models for larger-scale, single rotors. For this, the induced velocity of the rotor was calculated as a function of descent rate based on experimental measurements via (2.4) and (2.5). Figure 8 shows the experimentally determined induced velocities of all rotor tests in comparison with an empirically obtained vortex ring model for large-scale systems as suggested by Reference JohnsonJohnson (2005, Table 3) using a  $\kappa =1.15$. The computed values based on experimental data in figure 8 are generally lower than the established model at low descent rates. However, noteworthy is that the obtained induced velocity ratios from all data sets of single as well as dual-rotors with different separations and different rotor diameters are following the same trend and are close to one another. While the overall trends of the model and the computed values agree, the data diverges more significantly at higher descent rates $(v_c/v_h'<-1.8)$. These discrepancies at higher descent rates were largely attributed to the parasite drag of the support structure, since a simple subtraction of the drag force from the mean measurements, as was done in this study, may not be particularly accurate. That is, at higher descent rates, the rotors extract momentum from the fluid and the support structure, therefore, experiences reduced free stream drag compared with a no-rotor case. Reducing the drag compensation at higher descent rates has shown to yield lower values of $(v_i+v_c)/v_h$, which are much more closely aligned with the established model. Thus, future studies should target decoupling the rotors from the structure more effectively, either by placing the load cells directly at the motors, which could not be done using the available load cell, or by increasing the ratio of rotor thrust over structure drag. It is worth mentioning that the expression of (2.4) for calculating $v_i$ is highly sensitive to the geometric pitch, $\theta _{.75}$ and therefore, imprecise geometry measurements, which were done by hand, can have a large effect.

Figure 8. Comparison of an empirical VRS models for large-scale, single rotors (Reference JohnsonJohnson, 2005) with calculated induced velocity values for single and dual rotors as a function of descent rate based on experimental mean performance measurements via (2.4) and (2.5).
5. Flow field analysis
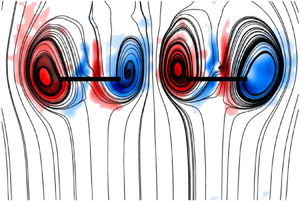
Two-dimensional PIV flow visualization was performed alongside the aerodynamic force measurements using the set-up described in § 3.3 to identify the underlying flow patterns around two closely arranged rotors in axial descent. Figure 9 displays representative, ensemble-averaged flow fields of two 4 in. rotors at different rotor separations ( $S=1.0$ and $S=2.0$) in simulated axial descent, showing the streamline patterns and vorticity contours at selected descent rate ratios. These descent rate ratios were chosen as representatives for low descent rates, VRS and TWS. Additional streamline patterns spanning the full descent regime are provided in the supplementary material, which is available at https://doi.org/10.1017/flo.2022.31.

Figure 9. Ensemble-averaged flow fields (streamlines and vorticity contours) of two counter-rotating rotors at selected simulated descent rates (4 in. rotors,  $10\,314$ r.p.m.). Additional flow fields spanning the full descent regime can be found in the supplementary material. Here (a) $S=1.0$ and (b) $S=2.0$.
At low descent rates, both rotor near-wakes are fully established for both separations with the axial velocity component of the rotor flow being able to overcome the opposing free stream within the ROI. The trailed vorticity at the rotor tips is transported away from the rotors along the rotor flow slipstream. The wakes are slightly inclined towards each other (which is a typical observation for multirotor wakes in near-hover conditions), but they are not redirected by the free stream flow. Instead, the wind tunnel free stream flow is entrained into the rotor wakes. The vortex ring patterns can be observed to form at the bottom of the ROI, far downstream of the rotors. Since the rotor wakes start to merge downstream for both separations, only one vortex ring system forms on the outside of the merged rotor wake. Slight asymmetries in the streamline pattern can be observed for  $S=2.0$ at $v_c/v_h=-0.47$, which may be due to insufficient data set size used in the averaging process or due to slight differences in the rotors’ operational state.
In the VRS ( $v_c/v_h=-1.33$), the streamlines of the ensemble-averaged flow fields of both rotor separations, similarly, clearly outline the anticipated vortex ring system forming around the rotor disks. As the descent velocity increases starting from hover, the cores of these vortex rings can be observed to move upward, closer to the rotor disks (see collection of all streamline patterns in the supplementary material). In accordance with single-rotor studies from the rotorcraft literature (Reference CastlesCastles, 1958; Reference Liangquan, Guohua and YongjieLiangquan, Guohua, & Yongjie, 2018; Reference Veismann, Yos and GharibVeismann et al., 2022; Reference ZalewskiZalewski, 2016), the cores of the vortex ring systems can be seen to be located within the rotor plane and close to the rotor blade tips during the fully established VRS, where thrust losses and fluctuations peak ( $v_c/v_h \approx -1.3$). Similar critical descent rate ratios ( $v_c/v_h=-1.35$), for when the cores are located within the rotor plane, were found in single rotor studies (Reference Green, Gillies and BrownGreen et al., 2005). As the descent rate further increases, the vortex cores start to propagate above the rotor disks. The superimposed vorticity contours, furthermore, indicate a strong vorticity build-up within the rotor plane in the VRS which is believed to be the cause for the aerodynamic losses as well as the increased vibrations. Thus, broadly speaking, the flow field of this dual-rotor set-up shows similar characteristics to that of a single rotor in axial descent, regarding the formation and trajectory of the vortex ring system as well as the critical descent rate ratio.
Meanwhile, the PIV data shows apparent differences in the flow fields for the two rotor separations: at the larger separation ( $S=2.0$), the toroidal vortex systems are clearly observable on both sides of each rotor disk, similar to isolated rotors in the VRS. However, at the closer separation ( $S=1.0$), the flow field is lacking these distinct vortex rings in between rotors. Since the two remaining outboard vortex filaments must be a continuous structure and cannot just be truncated, they are assumed to be connected to one another, leading to the assumption that the vortex ring systems of two rotors start to merge in the inter-rotor region when they are brought sufficiently close to one another, resulting in the formation of a single, continuous ‘ $0/8$’-shaped vortex ring structure, as schematically illustrated in figure 10. Note that the exact geometry of the resulting vortex structure cannot be determined by the here provided two-dimensional PIV data and is left for future studies. When the rotors are spaced sufficiently far apart, the individual vortex ring systems are assumed to be distinct from one another, with each of them fully encompassing their respective rotor without merging.

Figure 10. Artistic interpretation of the presumed vortex ring system geometry (vortex tubes) of two rotors arising in the VRS at different rotor separation based on results from figure 9. Here (a)  $S=1.0$ and (b) $S=2.0$.
It has to be noted that, while the presented ensemble-averaged flow fields of rotors in the VRS display well-defined and orderly vortex rings, the instantaneous behaviour is marked by a highly unsteady flow and periodic wake break-down, resulting in chaotic and noisy PIV data for each image pair. Yet, by ensemble averaging over large enough data sets of instantaneous flow fields, a clear outline of the characteristic vortex formations can be achieved to provide valuable insights into the underlying flow structure around dual-rotors in the VRS. It should also be noted that these measurements were performed for counter-rotating rotors and whether the same observations can be made for a corotating system is left for future investigations.
The obtained flow fields of this study can be compared with computational flow field results of closely arranged twin-rotor (Reference Takii, Yamakawa and AsaoTakii et al., 2020) and multirotor (Reference McQuaid, Kolaei, Bramesfeld and WalshMcQuaid et al., 2020; Reference Veismann, Wei, Conley, Young, Delaune, Burdick and IzraelevitzVeismann et al., 2021) configurations in axial descent found in the literature. In the interest of brevity, this comparison will be qualitative in nature and readers are encouraged to consult the provided literature for their own, in-depth analysis. Examining these computational flow fields for vehicles with small rotor separations ( $1.0< S<2.0$) in the VRS shows that for the twin-rotor case a vortex ring system is still present in the inter-rotor region, albeit much smaller than the outboard vortex rings. Meanwhile the multirotor flow fields lack these inter-rotor vortex rings. This notwithstanding, all cases display a greatly reduced vorticity built-up between rotors compared with the outside of the rotors, which is in alignment with the findings of this study. Whether the observed differences in the vortex ring systems between the rotors are physical and purely dependent on rotor separation and number of rotors or are artifacts of the computational fidelity cannot be answered here. One has also to consider that significant aerodynamic interference may be introduced by the vehicle structure (rotor arms, fuselage and/or wings), which is present in all of the aforementioned computational studies.
At high descent velocities associated with the TWS ( $v_c/v_h=-1.94$), figure 9 shows that nearly all fluid flow is directed upward except near the rotor tips, where the rotor flow is sharply redirected outboard and aligned with the free stream flow. In contrast to the VRS, the rotor flow is not directly recirculated as the cores of the vortex rings are generally located far above the rotors. The vorticity trailed by the rotors is therefore convected outboard and away from the rotor disks, which explains the observed decrease in the vibrations and the recovery of thrust. One may note the smaller vortex rings and localized vorticity at the rotor tips in the inter-rotor region for $S=1.0$. This highlights once more that the flow field of two rotors undergoes significant changes in all descent stages when rotors are brought closely together. These findings certainly warrant further investigations in the future to help answer the question of why, for instance, the mean thrust curve of a rotor only changes marginally, of the order of single digit per cent, for different rotor separations despite having considerably different flow fields.
6. Conclusions
Thrust measurements and accompanying flow visualization were performed on a small-scale, dual-rotor model in a vertical wind tunnel under simulated steady-state, axial descent conditions. Rotor separation, rotor size and hover thrust were varied in order to explore their influence on the system's thrust generation in descent. To establish a baseline, single-rotor tests were conducted and compared with measurements from dual-rotor tests. The most relevant contributions of this study are the following.
(1) Load cell measurements indicated that for a constant rotor rotation rate, the collective mean thrust of the here-investigated rotor pairs decreased more than 30 % in simulated descent compared with hover conditions. The thrust response for each rotor geometry generally follows a characteristic curve, largely independent of the rotation rate (i.e. thrust level). The mean thrust data suggests that above rotor separations of $S>1.5$, the operation of these small-scale rotor pairs in VRS is relatively insensitive to the number of rotors, their separation and similar to that of a single rotor. At separations of $S=1.0$, increased critical descent rate ratios, mean thrust losses and thrust fluctuations were recorded. Meanwhile, tests showed that the rotor geometry plays another significant role determining the extent of the mean thrust losses. Peak thrust reductions consistently occurred at normalized descent rate ratios of $v_c/v_h=-1.2$ to $-1.3$.
(2) Low-frequency vibrations were observed to grow in severity as descent rate increased, with the largest fluctuations found within the critical ratio range of
$v_c/v_h=-1.2$ to $-1.3$. Much like the arithmetical mean, oscillations in the thrust history displayed a characteristic behaviour for each rotor geometry independent of rotation rate. The shape of this characteristic curve and maximum extent of the fluctuations appears to be determined by the rotor geometry, with rotor geometries experiencing larger mean thrust losses also displaying larger amounts of vibrations. Comparing the investigated rotor separations showed that the peak vibrational loads were much more significant for $S=1.0$, compared with $S=1.5$ and $S=2.0$, which displayed comparable levels of vibrations.(3) Mean thrust measurements obtained by a single-rotor model closely matched those of the dual-rotor model for
$S>1.5$, thus suggesting that single-rotor studies could be used to describe multirotor systems with larger rotor separations in descent without significant loss of accuracy. However, higher vibrational loads were recorded for the single-rotor set-up compared with the dual rotor set-up. It remains to be answered if these differences are due to the different set-ups of single and dual rotors or if they are physically manifestation in the VRS behaviour.(4) Rotor geometry (i.e. planform shape, pitch, airfoil selection) appeared to have a non-negligible effect on the axial flight performance of the rotors tested in this study. Increased collective pitch was found to reduce variations in mean thrust and fluctuations in vertical flight. However, the critical descent ratio remained largely unchanged.
(5) Flow field analysis in VRS captured the formation of distinctive vortex ring systems, with the vortex cores attached to the rotor tips, leading to an in-plane vorticity build-up when thrust losses and fluctuations were most severe. When undergoing TWS conditions, the vorticity was observed to be transported outboard and away from the actuator disks.
(6) Ensemble-averaged PIV measurements of the dual-rotor model in VRS indicated that as the inter-rotor spacing is decreased to
$S=1.0$, the characteristic vortex rings disappear between the rotors, leading us to believe that the individual vortex ring systems associated with each of the two rotors merge and form a single, continuous vortex ring structure enclosing both actuator disks.(7) All experiments were performed on a counter-rotating set-up. Further research is required to examine if the same observations can be made on an identical, corotating system and for systems with more than two rotors. This applies to the aerodynamic measurements as well as the flow field analysis.


Supplementary material
Supplementary material (additional flow field measurements) is available at https://doi.org/10.1017/flo.2022.31.
Declaration of interests
The authors declare no conflict of interest.
Funding statement
The authors gratefully acknowledge funding by the Center for Autonomous Systems and Technologies (CAST) at Caltech.
Author contributions
M.V. and C.D. created the research plan, designed the experimental set-up and performed the flow visualization experiments. M.V. performed the aerodynamic force measurements and data analysis and wrote the manuscript. M.G. supervised the project.
Data availability statement
Raw data are available from the corresponding author (M.V.).
Ethical standards
The research meets all ethical guidelines, including adherence to the legal requirements of the study country.


 Open access