


Introduction
Snowpack state variables such as depth, density, wetness, temperature and snow grain morphology are important for many climate and hydrological applications such as surface energy balance, avalanche predictions and water resources management (e.g. Reference HallHall, 2004; Reference Armstrong and BrunArmstrong and Brun, 2008; Reference BrownBrown, 2010; Reference FosterFoster and others, 2011). Characterizing the seasonal and vertical snow grain size is key for snow grain- size retrieval from visible and near-infrared (NIR) satellite data (Reference Jin, Charlock, Yang, Xie and MillerJin and others, 2008; Reference Fernandes, Zhao, Wang, Key, Qu and HallFernandes and others, 2009; Reference Lyapustin, Tedesco, Wang, Aoki, Hori and KokhanovskyLyapustin and others, 2009), for snow water equivalent (SWE) retrieval from passive microwave satellite data (e.g. Reference Chang, Foster, Hall, Rango and HartlineChang and others, 1982; Reference MätzlerMätzler, 2006; Reference PulliainenPulliainen, 2006; Reference Durand, Kim and MargulisDurand and others, 2008; Reference DerksenDerksen and others, 2010; Reference Langlois, Royer and GoitaLanglois and others, 2010a; Reference TakalaTakala and others, 2011) and for studies of atmospheric/snow chemical interactions (Reference GrannasGrannas and others, 2007; Reference DomineDomine and others, 2008). Grain size has also been shown to be the most sensitive parameter of all the snow physical properties in microwave radiative transfer models such as the Microwave Emission Model of Layered Snowpacks (MEMLS; Reference Durand, Kim and MargulisDurand and others, 2008; Reference Langlois, Royer and GoitaLanglois and others, 2010a; Reference BruckerBrucker and others, 2011), the Helsinki University of Technology model (HUT; Reference Butt and KellyButt and Kelly, 2008; Reference Kontu and PulliainenKontu and Pulliainen, 2010) and the dense-media radiative transfer model (DMRT; Reference Tedesco and KimTedesco and Kim, 2006; Reference GrodyGrody, 2008;Reference Brucker, Picard and FilyBrucker and others, 2010). Previous studies used different methods to measure snow grain size to validate the MEMLS model, as discussed below (Reference Mätzler and WiesmannMätzler and Wiesmann, 1999; Reference Wiesmann and MatzlerWiesmann and Mätzler, 1999; Reference Toure, Go'ta, Royer, Matzler and SchneebeliToure and others, 2008). Nonetheless, these analytical models still need to be further validated with more reliable and accurate ground-based snow grain measurements to improve their modeling accuracy.
The greatest diameter, D max, of a snow grain has long been used as a classical parameter for characterizing grain size (Reference FierzFierz and others, 2009). Given the variety of grain shapes and its relevance to radiative transfer models, the definition of grain size remains ambiguous (Reference Aoki, Aoki, Fukabori, Hachikubo, Tachibana and NishioAoki and others 2000; Reference MätzlerMätzler, 2002; Reference Taillandier, Domine, Simpson, Sturm and DouglasTaillandier and others, 2007). More-over, demarcation of individual snow grains is ambiguous as the boundaries between grains are not always clearly identifiable (Reference DomineDomine and others, 2008). This reduces the repeatability of such snow grain measurements, due to the subjectivity of the observer. There are several methods for characterizing the physical properties of snow grain size, including stereology (e.g. Reference Matzl and SchneebeliMatzl and Schneebeli, 2010), methane adsorption measurements (Reference Domine, Cabanes, Taillandier and LegagneuxDomine and others, 2001), X-ray computed microtomography (µ-CT; Reference FlinFlin and others, 2005; Reference Chen and BakerChen and Baker, 2010) and optical methods (Reference Matzl and SchneebeliMatzl and Schneebeli, 2006; Reference Painter, Molotch, Cassidy, Flanner and SteffenPainter and others, 2007; Reference Gallet, Domine, Zender and PicardGallet and others, 2009; Reference Langlois, Royer and GoitaLanglois and others, 2010b; Reference ArnaudArnaud and others, 2011). Here we focus on optical approaches allowing in-field or in situ measurements. As the spectral reflectance (or its hemispherical component: spectral albedo, hereafter referred to as albedo) of snow is very sensitive to grain size (e.g. Reference Wiscombe and WarrenWiscombe and Warren, 1980; Reference Nolin and DozierNolin and Dozier, 2000; Reference Kokhanovsky and ZegeKokhanovsky and Zege, 2004; Reference Domine, Salvatori, Legagneux, Salzano, Fily and CasacchiaDomine and others, 2006; Reference Xie, Yang, Gao, Kattawar and MishchenkoXie and others, 2006) and shape (e.g. Reference Jin, Charlock, Yang, Xie and MillerJin and others, 2008; Reference Picard, Arnaud, Domine and FilyPicard and others, 2009), albedo can be used to derive snow grain size and, more precisely, the specific surface area (SSA), a fundamental geometrical characteristic of porous materials. Here SSA quantifies the ice surface-to-volume ratio of a snow grain. Several studies have illustrated the usefulness of SSA measurements, and different methods have been developed for measuring it (Reference Domine, Cabanes, Taillandier and LegagneuxDomine and others, 2001; Reference Matzl and SchneebeliMatzl and Schneebeli, 2006; Reference Painter, Molotch, Cassidy, Flanner and SteffenPainter and others, 2007; Reference Gallet, Domine, Zender and PicardGallet and others, 2009; Reference Langlois, Royer and GoitaLanglois and others, 2010b; Reference ArnaudArnaud and others, 2011).
Reference Matzl and SchneebeliMatzl and Schneebeli (2006) suggested a method based on the use of a commercial camera modified to measure the NIR albedo near 900 nm. The advantage of this method is that it yields vertical SSA profiles rapidly from photos of the snow-pit wall. However, despite its robustness, the method is limited to the NIR spectrum due to the charge-coupled device's (CCD) sensitivity spectrum that abruptly drops above 1000 nm, which reduces the sensitivity to SSA measurement when compared to SWIR albedo measurements (Reference Gallet, Domine, Zender and PicardGallet and others, 2009). This limited sensitivity renders this method difficult to accurately calibrate, and results are hard to reproduce, particularly under variable illumination conditions in deep snow pits, even with a modified protocol as discussed by Reference Langlois, Royer and GoitaLanglois and others (2010b). Reference Painter, Molotch, Cassidy, Flanner and SteffenPainter and others (2007) suggested a system based on directional spectral reflectance measurements of snow using a spectroradiometer in the range 950-1050 nm under controlled illumination. However, the resolution of this measurement (2 cm) is rather coarse and is inadequate to properly characterize thinner snow layers (<1 cm) within the snowpack. Also, these wavelengths are more sensitive to absorbing impurities which affect the snow reflectance (Reference Warren and WiscombeWarren and Wiscombe, 1980; Reference Flanner, Zender, Randerson and RaschFlanner and others, 2007). In addition, Reference Grenfell and WarrenGrenfell and Warren (1999) suggest that to reach higher effective grain-size accuracy, hemispherical reflectance is better than biconical reflectance measured by Reference Painter, Molotch, Cassidy, Flanner and SteffenPainter and others (2007). Nonetheless, this method is less destructive and avoids possible snow grain alteration from sampling. Reference Gallet, Domine, Zender and PicardGallet and others (2009) developed a shortwave infrared (SWIR) albedo measurement system using an integrating sphere and laser diodes at 1310 and 1550 nm as illumination sources. This system, DUal-Frequency Integrating Sphere for Snow SSA (DUFISSS), requires extraction of a snow sample, which can be difficult in weakly cohesive snow hoar layers and in the presence of ice lenses. The vertical resolution is also less detailed than with photographs since these measurements are punctual. However, using such a device in a fixed position (in more controllable measurement conditions) improves the accuracy and reproducibility of such measurements. Reference ArnaudArnaud and others (2011) modified the method using a profiler, Profiler Of Snow Specific Surface area Using SWIR reflectance Measurement (POSSSUM), to measure a normalized SWIR reflectance within a drilled hole up to 20m deep. POSSSUM retrieves SSA profiles with an effective vertical resolution of 10-20mm, but the drilling approach is not applicable in non-cohesive seasonal snow. To limit the issues due to the destructiveness of drilling a hole in seasonal snow, the Laboratoire de Glaciologie et G?ophysique de l’Environnement (LGGE) developed the Alpine Snow Specific Surface Area Profiler (ASSSAP) which measures the reflectance profile within a cylindrical dug hole using the same principles as POSSSUM. This instrument is still in development by the LGGE.
Here we present a new approach based on a SWIRcam (hereafter referred to as SWIRcam), at wavelengths comparable to the SWIR integrating sphere system used in this study (InfraRed Integrating Sphere (IRIS)) developed at Universit? de Sherbrooke, southeastern Qu?bec, Canada, and based on the DUFISSS design (Reference Gallet, Domine, Zender and PicardGallet and others, 2009). Compared to IRIS and DUFISSS, this new camera gives high-resolution SSA profiles. Hence, the main objective of this paper is to analyze and compare the two optically based field retrieval methods of snow grain size (SWIRcam and IRIS) and to discuss their accuracy and reproducibility with various measurements taken in arctic, subarctic and southern regions of Canada.
The next section briefly recalls the theory behind the snow spectral albedo. The different systems used are then described: the new SWIRcam and IRIS. Finally, the advantages and drawbacks of each approach are discussed.
Background
In radiative transfer studies, the ‘optical’ diameter of particles, D
o, is commonly used to characterize particle sizes using the volume (V) to surface area (A) ratio where D
o = 6(V/A) (e.g. Reference Grenfell and WarrenGrenfell and Warren, 1999). The optical diameter of a particle is defined as the diameter of a sphere having optical properties identical to those of the measured particle regardless of its shape. For a single size distribution of spheres, D
o corresponds to their diameter. The optical diameter can also be related to the SSA of particles. For snow, SSA can be defined either by its surface-area-of-ice (A) to volume-of-ice (V) ratio (SSA
V
= A/V) (m-1) or its surface area of ice per unit of mass of ice ![]() where ρ
ice is the density of pure ice (917 kg m-3 at 0°C). The latter definition of SSA can be related to gas adsorption measurements as described by Reference Domine, Cabanes, Taillandier and LegagneuxDomine and others (2001). The relationship between the optical diameter and the SSA is then
where ρ
ice is the density of pure ice (917 kg m-3 at 0°C). The latter definition of SSA can be related to gas adsorption measurements as described by Reference Domine, Cabanes, Taillandier and LegagneuxDomine and others (2001). The relationship between the optical diameter and the SSA is then
The SSA of snow can be related to its albedo using a simple optical equation model suggested by Reference Kokhanovsky and ZegeKokhanovsky and Zege (2004), hereafter referred to as KZ04:

where R a,λ(ξ) is the spectral albedo at the wavelength λ and illumination angle ξ, γλ is the absorption coefficient of ice which depends on the imaginary part of the refraction index of ice (W.J. Wiscombe, ftp://climate1.gsfc.nasa.gov/wis-combe/), the constant b represents the shape factor of snow grains (b ranges from 4.53 for spheres to 3.62 for tetrahedral grains; Reference Picard, Arnaud, Domine and FilyPicard and others, 2009), D o is the optical diameter of the snow grain and K 0 is the escape function which determines the angular distribution of light escaping the medium and depends mainly on the incident lighting conditions (9/7 for normal incidence albedo and 1 for spherical albedo). Figure 1 shows the spectral spherical albedo (K 0 = 1) of snow simulated with the KZ04 model for different grain sizes, D o, and a shape factor, b, of 4.3. Figure 1 shows the higher sensitivity of snow albedo to D o in the SWIR region (>1.2 µm) compared to the NIR region (<1.0 µm). For a fixed value of b = 4.3, a variation of ΔD o = 0.8mm (SSA of 8.2 m2 kg-1), for instance, gives a variation of ΔR a = 0.275 at 1.3 µm, while this variation is only ΔR a = 0.172 at 0.9 µm. In other words, a given error in measured albedo translates into a larger error on D o at 0.9 µm than at 1.3 µm.

Fig. 1. Spectral albedo of snow for different grain sizes, D o, simulated with the KZ04 model (Eqn (2)) for spherical albedo (K 0 = 1). A shape factor, b, of 4.3 fitted best for spheres in the data presented by Reference Jin, Charlock, Yang, Xie and MillerJin and others (2008). The spectral responses of the NIR (dark gray rectangle) and SWIR (light gray rectangle) cameras are displayed. The wavelength of the IRIS and that of the DUFISSS laser system are included in the SWIRcam spectral response.
Simulations with the KZ04 model using different values of b were compared to computed spectral spherical albedo using the improved geometric-optics method (IGOM) developed by Reference Yang and LiouYang and Liou (1996) (derived from the data of Reference Jin, Charlock, Yang, Xie and MillerJin and others, 2008; Z. Jin and others, personal communication, 2011). Using an iterative approach to optimize the correlation between the KZ04 and Reference Jin, Charlock, Yang, Xie and MillerJin and others (2008) models, we sought the value of b that provides the best fit. Results show that b = 4.3 for spheres gives the best correlation (rmse = 0.01; Fig. 1). The spectral albedo variations (Fig. 1) computed for monodispersed sizes of idealized particle shapes suggest (not shown) that the shape of snow grains could be important in the retrieval procedure, as also outlined by Reference Jin, Charlock, Yang, Xie and MillerJin and others (2008) and Reference Picard, Arnaud, Domine and FilyPicard and others (2009). In practice, however, snow samples include different sizes and shapes giving a polydispersed particle distribution and theoretically affect the shape factor b (Reference Picard, Arnaud, Domine and FilyPicard and others, 2009). The shape and size variability within a snow sample can clearly be seen in microtomography measurements (e.g. Reference Chen and BakerChen and Baker, 2010; Reference Matzl and SchneebeliMatzl and Schneebeli, 2010). However, Reference Gallet, Domine, Zender and PicardGallet and others (2009) and Reference ArnaudArnaud and others (2011), based on simultaneous measurements of SSA using CH4 adsorption and IR reflectance of natural snow samples, could not detect any effect of grain shape and fitted their data using the b value adequate for spheres. This indicates that shape effects may cancel out in natural snow, which then behaves as a collection of disconnected spheres.
Data and Methods
Study sites
Intercomparison field campaigns include snow-pit measurements from: (1) the Centre d‘Applications et de Recherche en T?l?d?tection (CARTEL) experimental site SIRENE at Universit? de Sherbrooke throughout several winters since 2008, and (2) Barnes Ice Cap, Baffin Island, Nunavut, Canada, in March 2011 (Reference DupontDupont and others, 2012).
The first site is an open mid-latitude area where different types of snow grains from fresh snow, rounded grains to depth hoar are found. The second site is an arctic ice cap where the observed snow grains were mostly dense rounded grains, wind crusts and depth hoar. No firn was observed between the ice layers and the seasonal snow. Further details are provided by Reference DupontDupont and others (2012).
Two other datasets were collected for calibration purposes (12 samples overall) in cold rooms at Dartmouth College, Hanover, New Hampshire, USA, and Québec City, Canada. The grains measured were mainly rounded grains and depth hoar. One fresh snow sample was observed at the time of the measurements in Québec City (Table 1).
Table 1. Study sites for the intercomparison field campaigns (SIRENE and Barnes) and the instrument calibration (Québec City and Dartmouth College)

Laser Albedo Measurements
Instrument description
The first system used to measure snow albedo was the Shortwave InfraRed Integrating Sphere (IRIS) system, similar to that developed by Reference Gallet, Domine, Zender and PicardGallet and others (2009), using an integrating sphere (Labsphere®; 10cm diameter) with three ports. The main difference between the IRIS and the DUFISSS systems is the sphere geometries. DUFISSS has a larger inner diameter (15 cm) and wider ports. The first port of the IRIS system is for illumination by a 1.33 μm laser (1.31 μm for the DUFISSS system) with a 1cm beam expander. The second port, in front of the laser, is placed in front of the target (snow sample), and the third one, in the perpendicular plane, is for an indium gallium arsenide (InGaAs) photodiode detector. A diaphragm is placed in front of the laser beam in order to measure the dark current and possible stray light entering the sphere. A first measurement with, and a second without, the diaphragm is done. Subtracting the first measurement (dark current and stray light) from the second (signal of the sample) determines the exact signal of the laser reflected on the snow sample. This lightweight and simple system is used in a fixed mode where a snow sample is extracted (Fig. 2) and placed under the integrating sphere, rather than a mobile mode where the integrating sphere is placed against the snow wall. It should be noted that the surface of the snow sample is slightly lower than the sphere’s inner surface, giving an effective solid angle of the reflected radiation lower than 2π steradians. The sample cup is an aluminum cylinder (10 cm in diameter and 6cm high) with a metallic plate that slides at the bottom portion of the cylinder (Fig. 2). The sampler was built sufficiently large and deep to limit errors due to possible internal reflections within the sampler (Reference Gallet, Domine, Zender and PicardGallet and others, 2009, p. 171-172).

Fig. 2. The IRIS sampler before extraction of the snow sample within the snow cover (left) and after the sample extraction with the cut surface (right).
Calibration and measurements
To provide accurate albedo measurements, the IRIS system is calibrated to albedo for each snow pit using reference Lambertian Spectralon reflectance targets (0.01, 0.07, 0.12, 0.27, 0.47, 0.64, 0.86 and 0.99 at 1330 nm) taking into account any possible shift in the laser intensity between every measurement session. Two calibrations, before and after snow measurements, are done to check the stability of the laser measurements. Figure 3 shows an example of a calibration curve. The nonlinear response is due to a reillumination effect of the reference panels by reflected light (the higher the albedo, the stronger is the reillumina- tion; Reference Gallet, Domine, Zender and PicardGallet and others 2009). A fit is computed using a third- degree polynomial (rmse of 0.008 albedo and R2 = 0.999). The mean measured variability before and after snow-pit measurements (15-30 min) is of the order of 1.3% which is comparable to the variability of the DUFISSS system (1%) (Reference Gallet, Domine, Zender and PicardGallet and others, 2009). This variability is mainly due to the temperature dependency of the laser (Reference Park, Huffaker, Zou, Shchekin and DeppePark and others, 1999). Note that the calibration curve does not pass through zero;such an offset is due to photons diffracted by the beam expender and directly reflected by the inner sphere surface toward the InGaAs detector, thus giving a signal even if the albedo sample is zero. This offset is taken into account by the calibration curve (Fig. 3).
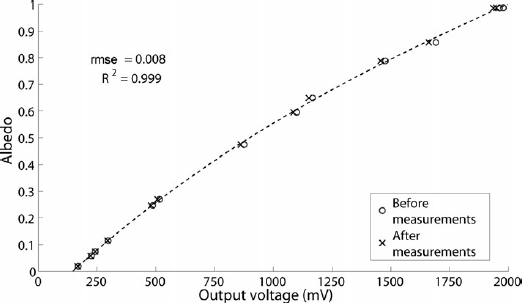
Fig. 3. Example of an IRIS calibration curve. The relationship is R= (3.23 × 10⁻¹¹)V 3 – (2.11 × 10⁻⁷)V 2 + (8.53 × 10⁻⁴)V – 0.12. The nonlinear response is due to a reillumination effect of the reference panels by reflected light inside the integrating sphere.
To extract an undisturbed snow sample, the sampler is slid inside the snow pit from the surface at desired depth with a 3 cm vertical resolution (the top portion of the sampler corresponds to the measurement height). The sample is then placed under the integrating sphere, three measurements are made to ensure measurement stability and the mean value is taken. To ensure no external light penetrates the integrating sphere, the system is placed inside an enclosed box and the sample is placed directly under the sphere, leaving no space between the sphere port and the sample.
Swir Photographs Albedo Measurements
Instrument description
The other instrument used in this study is a camera sensitive to the NIR and SWIR (0.9-1.7 µm) based on a cooled InGaAs array (320 × 256 pixels) (© Xenics Xeva-320). A filter centered at 1.295 ± 0.012 mm (Edmund NT62-863) is placed in front of the lens to narrow the range. This wavelength was chosen for the best compromise between sensitivity of the spectrum albedo to SSA and signal intensity (Fig. 1). The advantage of such an instrument compared to a commercial camera (Reference Matzl and SchneebeliMatzl and Schneebeli, 2006; Reference Langlois, Royer and GoitaLanglois and others, 2010b) is the possibility of directly deriving (after calibration) SSA from the KZ04 model with greater precision as shown in the previous section (Eqn (2)).
Measurement and calibration
The SWIRcam measurement protocol was based on that suggested by Reference LangloisLanglois and others (2010b) for snow NIR photographs. Some modifications were made to the protocol concerning control of the ambient lighting conditions and transmission of light through the top layers of the snow pit, in order to improve the accuracy and reproducibility of the measurements. After the snow pit is dug and a clean snow profile has been prepared with a sharp spatula, the camera is placed perpendicularly in front of the snow wall. All measurements were made under diffuse lighting conditions using a white translucent cover, avoiding direct solar illumination. Also, to avoid measurement artifacts due to direct light transmission penetrating the snow cover from the surface to the top portion of the snow profile, a large Styrofoam panel is placed on top of the snow profile (at the snow-cover surface). For calibration from grayscale values to albedo, five reference targets (Lambertian Spectralon targets: 0.06, 0.25, 0.59, 0.79 and 0.99 at 1300 nm) and a rigid ruler are placed along the snow profile (Fig. 4). A first picture is taken with a Styrofoam panel placed in front of the snow wall and the reference targets. This picture is used for image normalization to correct illumination variations over the image. Prior to the snow measurements, the mean albedo (Ra, λ = 0.97) and standard deviation (0.00) of this reference panel (80cm × 80 cm) was measured under controlled illumination (using a 600W halogen lamp, Q60-SGL). A picture of the snow profile without the Styrofoam panel is then taken. Both photos (snow and reference panel) are taken with a minimum time lag (seconds). The diffuse solar conditions are assumed constant between the two photographs (Fig. 4).
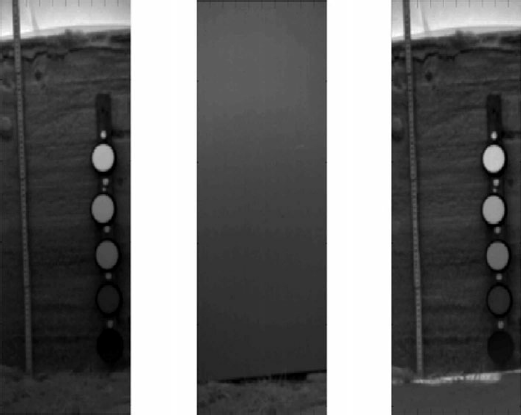
Fig. 4. Example of a snow profile picture (left), a reference Styrofoam panel picture (middle) and a normalized picture (right) taken at the SIRENE study site on 16 February 2011. The normalized picture is the product of the snow profile picture divided by the reference
panel picture.
Before calibrating the photographs from grayscale to albedo, the photograph is normalized by dividing, pixel by pixel, the grayscale values of the snow wall picture with the grayscale values of the Styrofoam panel picture (Fig. 4). This corrects illumination variations along the snow profile as seen in Figure 4 where the bottom part of the profile is less dark on the normalized picture (right picture, Fig. 4) than the original snow picture (left picture, Fig. 4). After normalization, a calibration is done between the measured normalized grayscale pixels of the reference target and their albedo values given by the manufacturer (Fig. 5). Figure 5 shows the expected linearity of the calibration (rmse = 0.01; R2 = 0.99). Such linear relationships are computed for each snow pit taking into account relative lighting and geometric conditions specific to each snow pit. No geometric deformation within the pictures was detected. The pixel to cm conversion is thus vertically constant. To produce an albedo profile, a section of the snow wall (~5-10cm wide) is extracted in the SWIR picture and the mean horizontal albedo value is then associated with its height. In this study, the mean SWIR photograph resolution was 2 mm pixel-1 since no thin layer (<2 mm) was observed. Nonetheless, if there were thin snow or ice layers within the snowpack, multiple pictures of the snow wall (taken at different depth) could be taken, with a minimal time lag, closer to the snow wall to increase the image resolution.

Fig. 5. Example of a calibration curve between the normalized grayscale values and the manufactured albedo values for the SWIRcam.
Results and Discussion
In this section, various albedo and SSA measurements from both SWIR instruments (IRIS and SWIRcam) acquired during several field campaigns in mountainous, northern temperate, subarctic and arctic regions are compared. To limit any possible artifacts due to the sample holder of the IRIS system (Reference Gallet, Domine, Zender and PicardGallet and others, 2009), measurements from snow layers having a density lower than 200 kg m-3 have been rejected. These layers were all fresh snow layers and comprised 6% of the overall data given in the following subsections.
IRIS albedo measurement validation for SSA
Figure 6 shows the relationship between albedo measurements taken with the IRIS system and SSA values obtained from two different methods: (1) SWIR albedo measurements with DUFISSS (Reference Gallet, Domine, Zender and PicardGallet and others, 2009) and (2) X-ray computed microtomography (μ-CT) (Reference Chen and BakerChen and Baker, 2010). The DUFISSS dataset was fitted to the KZ04 model (Eqn (2)) to validate both the IRIS measurement and the KZ04 simulations.
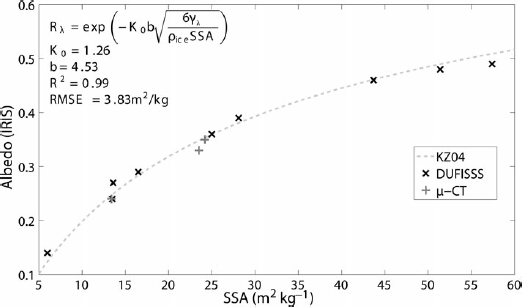
Fig. 6. Relationship between the IRIS-derived albedo and SSA measurements from the DUFISSS system (×) and μ-CT measurements (+). Dashed line corresponds to the KZ04 albedo model (Eqn (2)).
Albedo measurements from both instruments (IRIS and DUFISSS) were taken from the same snow samples. In fact, the samples were taken with the same sampler and placed under both systems with a minimal time lag (a few minutes) in order to limit any changes in the physical properties. The SSA was then derived from the DUFISSS measurements with the Reference Gallet, Domine, Zender and PicardGallet and others (2009) relationship and compared to the IRIS albedo measurements. Since there are differences in the geometries of both spheres (sphere inner diameter and port geometry and inner diameters) and in the wavelengths used in both systems (1310 nm for DUFISSS and 1330 nm for IRIS), directly comparing the albedo measurements is not adequate. As discussed by Reference Gallet, Domine, Zender and PicardGallet and others (2009) and Reference ArnaudArnaud and others (2011), these IR albedo integrating sphere systems do not directly measure directional-hemispherical albedo but rather a combination of directional- hemispherical and diffuse-hemispherical albedos that are highly dependent on the sphere's geometry (Reference Gallet, Domine, Zender and PicardGallet and others, 2009, equation 6).
Nine samples ranging from 6.0 to 57.4 m2 kg-1 were measured in a cold room in Québec City. Results show good agreement with the KZ04 model using a shape factor b of 4.53 (snow grain shape corresponding to spheres according to Reference Picard, Arnaud, Domine and FilyPicard and others, 2009) and an escape function K0 of 1.26 (R2 = 0.99; rmse = 2.33 m2 kg-1), meaning that the snow grain shape does not scatter the points in these conditions. This calibration is, however, valid over a limited range of SSA (SSA < 57.4 m2 kg-1) and may differ for SSA values higher than 57.4 m2kg-1. Reference ArnaudArnaud and others (2011) showed that directional-hemispherical albedo SSA measurements tend to give a shape factor corresponding to spheres (b = 4.53; Reference Picard, Arnaud, Domine and FilyPicard and others, 2009) with K0 = 9/7 as used for the SSA retrieval using the SWIRcam. The difference with the escape function given in Figure 6 (K0 = 1.26) is explained by the combination of directional/diffuse-hemispherical albedo measured with IRIS compared to the SWIRcam measurements.
Another independent dataset was used to validate this relationship. The albedo measurements were acquired on the same samples with the IRIS system and the SSA measurements obtained from the μ-CT at Thayer School of Engineering, Hanover. The rmse from the model is 1.33 m2 kg-1. The overall accuracy of the IRIS system using the KZ04 model for retrieving the SSA in comparison to these two SSA datasets is 1.89 m2 kg-1, i.e. of the order of 7%.
SWIRcam comparison
Figure 7 shows an example of a normalized image acquired with the NIR (left) and SWIR (right) cameras with their respective albedo profiles. The NIR image was taken with the same measurement protocol as the SWIRcam;details of the apparatus are provided by Reference LangloisLanglois and others (2010b). One should note that the differences in the albedo profiles (0.8-0.9 for the NIR picture and 0.25-0.3 for the SWIR picture) are simply due to a difference in wavelengths (~850nm for the NIR image and 1300nm for the SWIR image). The NIR image shows a better vertical resolution (1.3 mm pixel-1), but the SWIR image (2.0 mm pixel-1) shows a much more detailed snow-pit stratigraphy (i.e. more sensitive to changes in SSA). This is shown by the albedo profiles beside the pictures. There is much more variability, especially in the top portion of the profile where the albedo range is ~0.1 for the NIR picture and ~0.2 for the SWIR picture. This variability is mainly due to the presence of an ice lens near the surface which is not clearly visible in the NIR picture because of its high sensitivity to lighting conditions. This shows the advantage of using instruments in the SWIR spectrum rather than the NIR spectrum since the SWIRcam is less sensitive to lighting conditions.

Fig. 7. Albedo profile taken with NIR (left) and SWIR (right) pictures with their mean horizontal (black), minimum and maximum (gray) profiles.
To validate the albedo measurements taken with the SWIRcam, five profiles were taken during the 2011 winter and compared with point measurements taken with the IRIS system along those profiles. Figure 8 shows the comparison between the SSA data derived from the SWIRcam and IRIS measurements taken at SIRENE (three profiles) and on Barnes Ice Cap (two profiles). The error bars correspond to the minimum and maximum SWIRcam SSA horizontal values of the snow wall section. The SSA measurements derived from the SWIRcam were calculated using equation 6 of Reference ArnaudArnaud and others (2011) since the SWIRcam albedo measurements are hemispherical-directional (K0 = 9/7). The SSAs measured with both SWIRcam and IRIS systems are in good agreement, with little variability (R2 = 0.82; rmse = 3.45 m2 kg-1). There is some variability in the SWIRcam measurements because the values extracted from the profiles are averaged over 5-10cm horizontally. The averaged horizontal length depends on the length available within the picture and can vary from one site to another. This averaging does not eliminate the possibility of extracting two-dimensional SSA information within a SWIR picture. It is done mainly to extract the overall vertical variability due to the layering of snowpack stratigraphy. The mean standard deviation over the averaged values is of the order of 2.0 m2 kg-1, which is comparable to the rmse. This explains most of the variability in the comparison between the two instruments.

Fig. 8. Compared SSA measurements of the IRIS system and the SWIRcam taken at the experimental site SIRENE (×) and Barnes IceCap (?) during the 2011 winter. The error bars give the minimum and maximum horizontal SWIRcam albedo variation at their respective heights.
The SWIRcam also provides more information than the IRIS system, by allowing characterization of the stratigraphy within the snow pit. Figures 9-11 show examples of SWIR photographs (right side) taken with the camera and the derived SSA profile (left side) taken at the SIRENE experimental site (Figs 9 and 11) and on Barnes Ice Cap (Fig. 10). SSA measurements taken with the IRIS system along the same profiles are also shown.

Fig. 9. SSA profile derived from the IRIS system and the SWIRcam taken at SIRENE during the 2011 winter. The picture on the right shows the portion of the snow pit (5.75cm width) from which the mean SWIR albedo was computed.

Fig. 10. SSA profile derived from the IRIS system and the SWIRcam taken on Barnes Ice Cap in March 2011. The picture on the right shows the portion of the snow pit (9.18cm width) from which the mean SWIR albedo was computed.
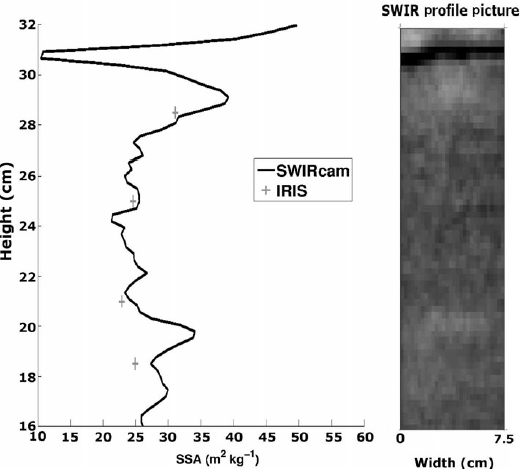
Fig. 11. SSA profile derived from the IRIS system and the SWIRcam taken at SIRENE during the 2011 winter. The picture on the right shows the portion of the snow pit (7.5 cm width) from which the mean SWIR albedo was computed. The ice lens (height ~31 cm) can clearly be distinguished by its dark region at the top of the snow pit.
As mentioned by Reference LangloisLanglois and others (2010b), the use of a passive-based camera to measure snow albedo is complex because numerous variables (lighting conditions, camera angle, lighting normalization) affect the measurements. This reduces the accuracy and reproducibility of the measurements compared to those made with IRIS. The Figure 9 profile was measured twice with a 5 min interval, the set-up was dismantled between measurements, and the mean albedo variation between the two measurements along the entire profile was 5%, with an rmse of 0.02. Another interesting feature of these measurements (Figs 9-11) is the albedo variability provided at 2 mm vertical resolution. At this resolution, one can distinguish from the SSA profile a fresh snow layer (49-50 cm; 39 m2 kg-1 <SSA< 55 m2 kg-1, mean SSA = 47.4 m2 kg-1), a dense rounded snow grain slab (25-49 cm; 17.0 m2 kg-1 < SSA<27.0 m2 kg-1, mean SSA = 21.6 m2 kg-1) a hard snow crust (21-24 cm; 5.0 m2 kg-1 <SSA< 13.0 m2 kg-1, mean SSA = 9.0m2kg-1) and a coarse depth-hoar layer (4-21 cm;8.0m2kg-1 <SSA < 16.0 m2 kg-1, mean SSA = 12.8 m2 kg-1).
The SWIR image (Fig. 10, right) from which the SSA profile was extracted also reveals the fine vertical variability of SSA well. Figure 10 is a good example of the vertical information that the SWIRcam provides. Compared to Figure 9, Figure 10 shows much more vertical SSA variability on Barnes Ice Cap, which could be omitted by IRIS measurements. In fact, thin (~2 cm) high-SSA (>50 m2 kg-1) layers could be missed with IRIS since the sampler is 6cm high. This shows the importance of high-resolution SSA profiles. This high resolution can even distinguish a 4 mm thick ice lens within the snow pit as shown in Figure 11. The dark region with a minimal SSA of 4.6 m2 kg-1 at 31 cm was visually associated with a clear ice lens. The value shown of 10.5 m2 kg-1 at 31 cm on the SSA profile (Fig. 11) is caused by the slight inclination of the ice lens. Thus, the horizontal mix of snow with ice raises the averaged SSA value at that height.
Since ice lenses affect the snow microwave signature considerably (Reference GrodyGrody, 2008; Reference Rees, Lemmetyinen, Derksen, Pulliainen and EnglishRees and others, 2010), it is essential that they be detected and characterized. With the SWIRcam it is possible to characterize fairly precisely the position of the lens and its thickness along a certain horizontal width. This is another excellent application of this new SWIRcam.
Conclusion
The main objective of this paper was to test the robustness of the determination of snow SSA from SWIR albedo measurements using two methods that differ in their sampling technique, lighting conditions and detector type. The two instruments presented in this paper, which are based on passive optical solar measurements (SWIRcam) or active laser-based devices (IRIS), have been compared. The IRIS measurements were validated with an independent method (μ-CT) and have proven to be accurate for SSA measurements within 10%. For both instruments, we used the Reference Kokhanovsky and ZegeKokhanovsky and Zege (2004) model to derive the snow grain SSA, showing the usefulness of this equation with a fixed shape factor (b) value for the different shapes measured (fresh snow, rounded grains, depth hoar) and an escape function, K0 , adapted to the type of albedo measured (directional and/or hemispherical).
Among the optical methods tested here, the most accurate and precise instrument for determining snow SSA is the IRIS system (relative variations of 3-5% on SSA measurements). Similar to the DUFISSS instrument (Reference Gallet, Domine, Zender and PicardGallet and others, 2009), the mean accuracy of the IRIS device is on the order of 10% compared to the methane adsorption method (considered as reference measurement). The downside of such a system is the need to extract snow samples for measurements, which can be difficult depending on snow conditions and stratig-raphy (ice lenses, non-cohesive layers) and which lengthens the acquisition time to complete a full snow profile (15-30 min). Also, the vertical resolution of this system is lower than NIR and SWIRcams or with POSSSUM.
The lower sensitivity to illumination conditions (Fig. 7) and the lower sensitivity to absorbing snow impurities make the SWIRcam a more accurate instrument for snow grain- size retrieval than the 850nm NIR camera used by Reference LangloisLanglois and others (2010b). Also, the vertical resolution for albedo measurements using the SWIRcam (~2 mm) gives more detailed stratigraphic information than the IRIS system (Fig. 10) and can detect thin ice lenses within the snowpack (Fig. 11). Another version of the SWIRcam used in this study was developed by © Xenics with a better spatial resolution, meaning the SWIR image could have a better resolution without having to take multiple pictures closer to the snow wall to increase the resolution.
In addition to other types of profile measurements for density, thermal conductivity (Reference Morin, Domine, Arnaud and PicardMorin and others, 2010) or liquid water content using capacitance plates (e.g. Reference DenothDenoth, 1989) or snow forks (e.g. Reference Sihvola and TiuriSihvola and Tiuri, 1986), the precise determination of vertical profiles of snow grain SSA and stratigraphy (layering) using a lightweight optical system is essential for improving snow and radiative transfer models. A thorough comparison between existing methods for SSA determination - optical, stereology, methane adsorption and X-ray microtomography - is needed to further define the accuracy and limitations of each approach.
Acknowledgements
We thank Ian Baker who allowed us to acquire the μ-CT grain-size measurements. The research at Dartmouth College was supported by US National Science Foundation (NSF) grant OPP-0821056. The views and conclusions contained herein are those of the authors and should not be interpreted as necessarily representing official policies, either expressed or implied, of the NSF or the US Government. We thank Jean-Charles Gallet who processed and provided the methane adsorption measurements, and Z. Jin who provided albedo calculations for different grain shapes (Fig. 1). All of our colleagues who helped us during the field campaigns in France and Canada are also gratefully acknowledged. This work was supported by the Natural Sciences and Engineering Research Council of Canada, the Canadian Polar Continental Shelf Program (Barnes Ice Cap field campaign), Environment Canada (principal investigator Anne Walker), Centre National de la Recherche Scientifique (CNRS), France, Institut Paul-Émile Victor (IPEV; French Polar Institute), the Programme International de Collaboration Scientifique (PICS) of CNRS, and the Ministère des Relations Internationales du Québec and Ministère des Affaires Étrangères et Européennes de la Republique Francaise (Consulat Général de France à Québec) in the framework of the 63e Session de la Commission Permanente de Coopération Franco-Québécoise.


