


Introduction
Climatic temperature fluctuations leave a subsurface thermal signature within ice sheets which can be used to infer past temperatures. The highly homogeneous thermal properties and relatively simple dynamics of major ice sheets facilitate this work, and a number of such studies have been conducted (e.g. Reference JohnsenJohnsen, 1977; Reference Dahl-Jensen and JohnsenDahl-Jensen and Johnsen, 1986). These studies involve either forward modelling of candidate temperature histories, which are selected or tuned to optimise agreement with observed temperature profiles, or inversion of the observed temperatures to derive potential surface histories. Both methodologies suffer from the inescapable limitation that dispersion of the thermal signal in the ice leads to information loss and consequent non-uniqueness of reconstructed histories.
Reference Dahl-Jensen, Morgan and ElcheikhDahl-Jensen and others (1999) adopt a Monte Carlo inversion strategy to explore the temperature history stored in the Dome Summit South (DSS) borehole, Law Dome, East Antarctica, focusing principally on the longest available time-scales (centuries to millennia). Study of the recent portion of the borehole temperature record and comparison with instrumental data requires interpretation of temperature variations in the thermally more complex firn region. To properly estimate recent warming, the thermal signal in the ice must be related to the climatic temperatures, and relevant processes quantified. In this study, we focus on the recent temperature variations recorded in the upper several tens of metres of the borehole. We use instrumental temperature data -short- term records from a nearby automatic weather station (AWS), and 37 years of data from Casey station, 120 km distant- to drive an ice-sheet thermal model over this time period.
Measurements
The ice-sheet temperature profile (Fig. 1) is derived from measurements in three boreholes drilled near the DSS site 4.6 km south-southwest of the summit of Law Dome. The main record comes from the DSS fluid-loaded borehole (Reference Morgan, Wookey, Li, van Ommen, Skinner and FitzpatrickMorgan and others, 1997) which extends some 1200 m to bedrock, and was logged in 1996. A second record (DSSWOk), extending to 40 m depth, originates from a site 830 m south of the deep drilling site which was handaugered and logged in March 1996. The record is completed by a third set of temperature data (DSS97) taken in November 1997 from a location ∼ 4 5 0 m east of DSSWOk, also in a dry hole, and extending to 270 m depth.
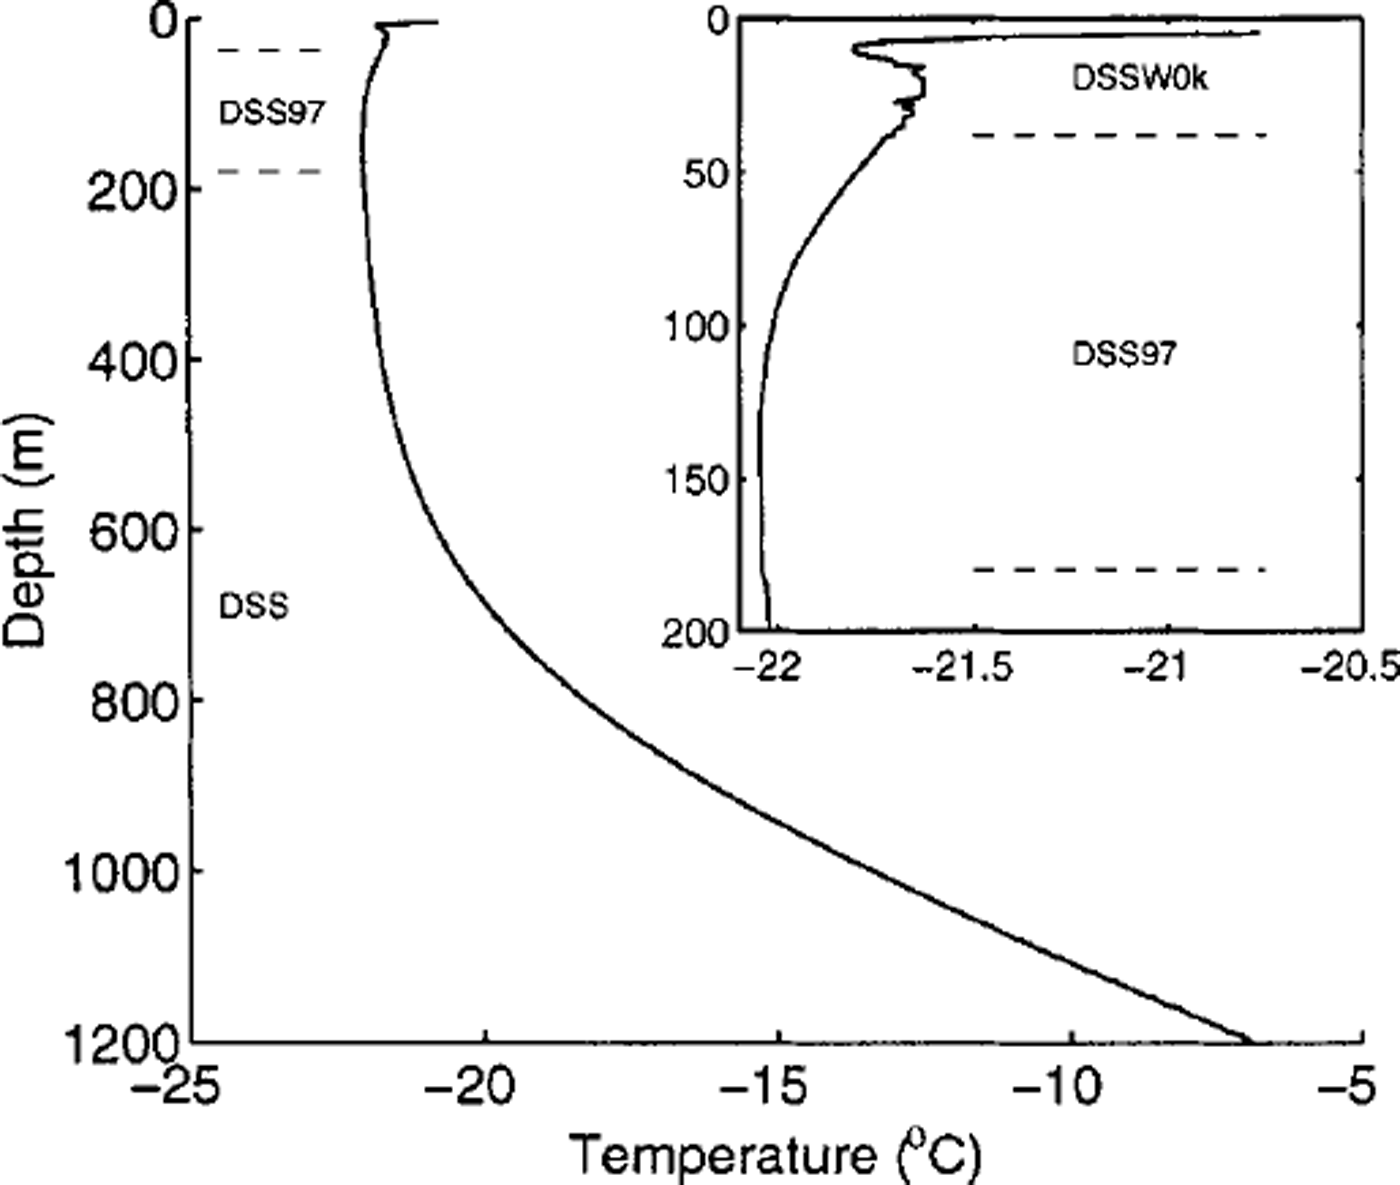
Fig. 1. Composite borehole temperature. Detail of upper 200 m shown inset on expanded scale.
Construction of this composite record was necessitated by thermal disturbances in the upper portions of both DSS and DSS97 records. In the case of the DSS record, the disturbance was the result of drilling activities and fluid movements in the upper cased section of the borehole. The DSS97 record was likewise influenced in the upper few tens of metres by surface excavation to accommodate drilling equipment and by the presence of a warmer than ambient shelter for 1 month prior to logging. The site characteristics at the three boreholes are effectively identical, with only a 1-2 m elevation difference, accumulation rates within 1% (over 44 years) and temperature profiles which overlap at depth to within the measurement accuracy. The final composite record comprises DSS97 temperatures at 38-180 m depth, with DSSWOk temperatures above and DSS below.
The borehole temperature measurements have an instrumental accuracy of ∼0.02°G. The DSS measurements were made (some 4 years after the disturbance of drilling) using a thermistor sensor hanging on a thin cable 2 m below a borehole inclination logger (Reference Morgan, van Ommen, Elcheikh and LiMorgan and others, 1998). The relatively large heat capacity of the fluid and the stable thermal resistance between the probe and the liquid allowed a standard cooling curve to be used to calculate final temperatures. In the dry holes, variations in thermal contact between the probe and the hole wall required a relatively long series of measurements so that a cooling constant could be determined for each depth. These dry-hole measurements used a four-wire platinum resistance sensor and a resistance bridge. Measured resistances were converted to temperature using the standard relation for industrial platinum temperature sensors.
Air-temperature measurements used here come from an AWS located near Law Dome summit and operated as part of the Australian Antarctic Division AWS network (Reference Allison, Wendler and RadokAllison and others, 1993; Reference AllisonAllison, 1998). These AWS installations have been operated for several years, and their reliability and accuracy is well characterised (Reference AllisonAllison, 1998), with absolute differences between overlapping station records <0.2°G over periods up to 18 months.
Model
The starting-point for modelling is the time-dependent heat-transfer equation (Reference PatersonPaterson, 1994, p. 224), which in one dimension can be written:
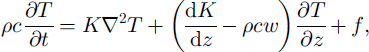
where p is density, c is heat capacity, K is thermal conductivity, T is temperature, w is vertical velocity and / is internal heating, all of these being functions of the vertical (z) coordinate. This one-dimensional treatment is appropriate for a near-summit site, where horizontal advection is not significant. The problem is further simplified by neglecting internal heat production, / , which we estimate at this site to be at least three orders of magnitude smaller than the coefficients of OT/dz in the partial differential equation. The equation was numerically solved using the discretisation method of Patankar (Reference Patankar1980) for dealing with combined advective and diffusive heat transport.
Thermal properties of ice and firn were computed from the relations given by Paterson (Reference Paterson1994, p. 205). In particular, thermal conductivity was computed as the mean of the lower-and upper-bound values given by the Reference Van Dusen and WashburnVan Dusen (1929) and Schwerdtfeger (Reference Schwerdtfeger1963) relations, respectively. In fact, the Van Dusen relationship was observed to give reasonable values of conductivity for temperatures around -5°C, so these were scaled by the factor K^Tj/K^-S) where K^T) is the thermal conductivity of solid ice at temperature T (personal communication from E. D. Waddington, 1998).
Firn density was computed using an empirical density-depth relationship derived for Law Dome summit. Through most of the firn column (the top several tens of metres), the relationship is approximated by two terms, a "fast" exponential, which describes the near-surface variations, superimposed upon a linear trend. Below a parametensed "break" depth, this relationship is replaced by a single exponential relaxation to the density of ice. This density model is
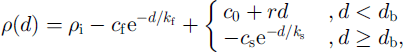
where d is depth, p is density and the parameters take the following best-fit values: Pi = 917 kg nT3, cf = 147.55 kg nT3, h = 7.1504 m, c0 = -371.56 kg nT3, r = 4.2826 kg nT4, dh = 56.972 m, cs = 648.65 kg nT3, with continuity at 4 giving ks = 35.034 m.
In addition to providing a good observed fit to density measurements on the DSS core, we have utilised this relationship to give ice-equivalent depth scales for the DSS and DSS97 ice cores, which were drilled 10 years apart. With a minor correction for flow-thinning and a fixed offset of ∼7.5m, we find that we can align «5180 seasonal cycles between the two cores with a residual depth "jitter" of 0.035 m (rms). This variability of <0.5 % includes a contribution due to surface irregularities and provides strong validation of our density model.
The ice-sheet thermal model uses advection velocities based on a constant accumulation rate of 0.6781 ma-1, and a simple Reference Dansgaard and JohnsenDansgaard and Johnsen (1969) flow regime for the DSS site, as described in Reference Morgan, Wookey, Li, van Ommen, Skinner and FitzpatrickMorgan and others (1997).
Driving Temperatures
The principal focus of this work is to use the observed surface temperature record from 1960 to March 1996 to drive the thermal model just described and draw comparisons with the firn temperatures shown inset in Figure 1. For this purpose, we need an approximation to the ice-sheet thermal state to provide a starting-point, and we have constructed a simple temperature history which we detail below. We have not sought to fine-tune this history, and indeed, an optimised temperature history is the result of the companion work of Reference Dahl-Jensen, Morgan and ElcheikhDahl-Jensen and others (1999).
We have not extended our model grid into the bedrock, as would be indicated if we were concerned with the precise details of basal temperature history. In fact, as noted in Reference Dahl-Jensen, Morgan and ElcheikhDahl-Jensen and others (1999), the response time at the base of the ice sheet to surface temperature variations (∼4ka) is sufficiently short that the basal temperature gradient is essentially determined by the geothermal heat flux.
We find that the temperatures in the lower part of the ice sheet are well reproduced by a steady-state condition with a basal heat flux of 72 mW nT2 and a surface temperature of -20.64°C. From this stable condition, we approximated the temperatures in the intermediate and upper ice sheet with a time-history as follows: 800 years linear cooling to -21.08°C, followed by 300 years constant temperature, and 655 years of temperature variation based on the ^18O record at Law Dome (Reference Morgan and van OmmenMorgan and van Ommen, 1997).
To convert 018O values to temperatures, we used the calibration derived by Reference van Ommen and Morganvan Ommen and Morgan (1997) which may be written: T = 018O/0.44 + 29.3°C. We varied the intercept term to obtain the best possible fit between modelled and observed borehole temperatures and found a value of 27.8°C. The \a range in the value from van Ommen and Morgan is 29.3 ± 1.5°C, so the adjustment here is unremarkable.
With ice-sheet temperatures thus preconditioned, we are able to consider running the model with observed monthly averaged temperatures from 1960 to March 1996. For this purpose, we have two datasets: (i) a record of AWS 4 m air-temperatures from 1988 to 1996, and (n) a full record of temperatures from Casey station covering the period in question (Casey temperature data are available at http: //www antcrc.utas. edu. au/^jacka/climate.html).
We have been able to establish a very close correspondence (<xresid = 1°C) between the monthly-averaged temperatures at the two locations over this period, given by the relationship TAWS = 0.94TCasey - 12.161 (°C). This has allowed us to use the Casey temperatures prior to 1988 (and to fill some AWS data gaps). The AWS is located ∼ 5 km north of the DSS site at an elevation <10 m lower. We expect, from the absence of topographical features and typical lapse-rate values, that the mean temperature at the AWS may be up to 0.1 °G warmer. Subsurface temperature measurements at the two sites support the assertion that any difference is likely to be at the 0.1-0.2°C level, which is small relative to other uncertainties considered in the following.
The question remains as to how well the 4 m air temperatures correspond to the effective driving temperatures for the ice sheet. Subsurface absorption of radiation and surface evaporative cooling lead to differences between mean temperatures at the surface, in the air and at depth (Budd, 1967; Reference WellerWeller, 1968). Weller shows data which indicate a temperature differential in excess of +1°C (relative to the surface) over the upper 8 m at a site in an ablation zone. The surface at Law Dome summit differs substantially, with ventilated firn and a higher albedo, both of which should considerably reduce warming by radiation. In addition, we note that the AWS temperature sensors at nominal heights of 1, 2 and 4 m show persistent temperature inversions (i.e. cooling toward the surface) of typically 0.25-0.5°C m^.The strength and persistence of this inversion is atypical of East Antarctic AWS sites (personal communication from I. Reference AllisonAllison, 1998) and is attributed to the relatively low wind speed (Reference Allison, Wendler and RadokAllison and others, 1993) at Law Dome summit. Thus, the 4 m AWS temperatures are typically 1-2°C warmer than the surface, although the precise value is difficult to determine from the limited data available due to rapid burial of the lower sensors at this high accumulation (-1.5 ma-1 snow) site. The net result of the subsurface temperature gradient and the air-temperature inversion is that the 4 m AWS temperatures are likely to overestimate the effective ice-sheet temperature by 1°C or so. In the following modelling, we accept the uncertainty in this figure and incorporate an adjustable offset to the 4 m driving temperatures.
Results and Discussion
Figure 2 shows tautochrones of temperature vs depth generated by our model at the end of each of the 12 months leading up to the firn-temperature measurements which were conducted around the first week of March 1996. The sequence commences with March-December 1995 (labelled 3-12), and concludes with January and February 1996 (labelled 1 and 2). The firn-temperature measurements are indicated by the crosses, and the righthand inset shows the residuals (model—observation).
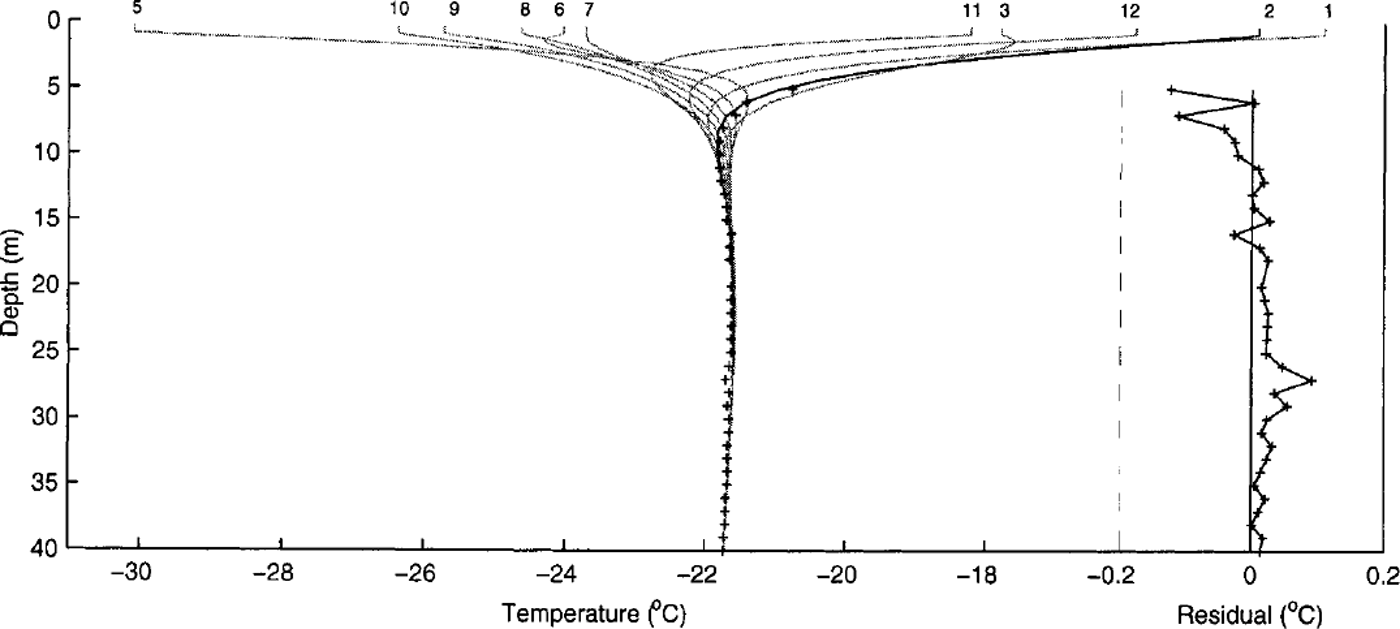
Fig. 2. Temperature tautochrones generated by model/or end of months April 1995 (numbered 4) through March 1996 (3). Crosses show the logged borehole-temperature profile from measurements in the first week of March 1996. Righthand panel shows residuals (model-observation) using the February tautochrone (2).
The model requires two parametensed offsets in order to achieve this degree of concordance with observations. The first, as discussed in the previous section, is an offset between the 4 m air temperatures and the effective driving temperature of 0.8°C (air temperature warmer). This is within the expected range, as discussed above.
The second offset to the model is the incorporation of an isothermal snow layer at the surface. Initial modelling showed that the annual temperature wave did not extend as far into the firn as observations indicate (or more precisely, it was attenuated more strongly with depth). This observation is not entirely unexpected since the modelling neglects heat transport by such processes as firn ventilation and radiation. Reference Cameron, Bull, Wexler, Rubin and CaskeyjrCameron and Bull (1962) illustrate this effect with subsurface temperature profiles that show minimal attenuation of the annual temperature wave in the top 0.5 m at S-l (coastal Law Dome). At DSS, the high accumulation and absence of melt (which is prevalent at S-l) give a surface which is generally more porous and likely to show even stronger ventilation effects. We have parametensed such effects by increasing the effective thermal conductivity in the top 1 m of the firn column to the point where there is no temperature gradient in the monthly-averaged signal. Of course, this simplified parametensation represents the actual effects of non-conductive processes integrated over several metres of depth.
The model can thus be "tuned" with the two offsets just described, and to a degree the fit of Figure 2 reflects our choice of parameters. These choices, however, do not influence the shape of the curve, as is evident in the strength of the residual previous winter inflection at 6-8 m depth. The concordance in shape between the observations, which were actually made over a few days either side of 1 March 1996, and the model output for the end of February 1996 confirms the soundness of the model. Furthermore we argue that despite being empirically determined, these "tuned" parameters represent realistic averages of actual physical processes.
The residuals show a small trend of ∼0.1°C about which the measured errors have an rms scatter of ∼0.02°C (as expected from the instrumental errors). The trend itself is attributed to limitations of the model. In particular, the monthly averages only approximate the averaged result of the thermal processes because of non-linear behaviour (see, e.g., Reference JohnsenJohnsen, 1977). The temperature dependence of thermal conductivity leads to small but significant offsets (simulations here indicate these are important at the -0.05-0.1 °G level). This term will be built into the chosen 0.8°G offset, but will distort the thermal wave and degrade the fit in the upper sections where residual seasonal wave is evident.
More seriously, the model assumption of a constant accumulation rate, with material added to the surface at the prevailing mean temperature, breaks down at some point. Material is added in a stochastic fashion and the thermal exchanges may not be well represented by means. An interesting and useful future exercise will be to explore the near-surface air- and firn-temperature data emerging from the local DSS AWS. The recent addition of surface accumulation sensors should permit the accurate registration of the height and depths of the temperature sensors, the lack of which has hampered investigations to date.
Turning, then, to interpretation of the borehole-temperature record, the results from this firn modelling show a temperature signal consistent with meteorological data once appropriate offsets are included. This result stands as a caution to avoid extrapolating through the seasonally varying part of a borehole-temperature profile using current mean air temperature as the uppermost comparison point. Indeed, at DSS one is likely to reach the conclusion that current temperatures are some -0.8° G warmer than indicated by the underlying borehole-derived measurements.
Acknowledgements
The authors wish to acknowledge the contribution of E. D. Waddington whose MATLAB routines provided the basis for this numerical modelling. AWS data for Law Dome, provided by I. Allison, come from the Australian Antarctic Division AWS network.


