


Introduction
One of the main reasons for the evolutionary success of flowering plants is the vast diversity of their seed morphology and functions (Eriksson et al., Reference Eriksson, Friis and Löfgren2000; Linkies et al., Reference Linkies, Graeber, Knight and Leubner-Metzger2010; Baskin and Baskin, Reference Baskin and Baskin2014). This diversity in seed forms and functions is accompanied by a high variability in seed mass, a trait that is central to many features in plant ecology and evolution (Moles et al., Reference Moles, Ackerly, Webb, Tweddle, Dickie, Pitman and Westoby2005; Sims, Reference Sims2013; Igea et al., Reference Igea, Miller, Papadopulos and Tanentzap2017). Seed mass is indeed a trait associated with other vegetative, physiological and reproductive traits, linked to critical stages of a plant's life history, including seed/fruit production (Bolmgren and Eriksson, Reference Bolmgren and Eriksson2010), dispersal (Howe and Smallwood, Reference Howe and Smallwood1982; Chen et al., Reference Chen, Poschlod, Antonelli, Liu and Dickie2020), persistence (Thompson et al., Reference Thompson, Band and Hodgson1993; Long et al., Reference Long, Gorecki, Renton, Scott, Colville, Goggin and Finch-Savage2015; Gioria et al., Reference Gioria, Pyšek, Baskin and Carta2020), germination (Baskin and Baskin, Reference Baskin and Baskin2014) and seedling establishment (Moles and Westoby, Reference Moles and Westoby2004). Nevertheless, whilst seed mass has been found to be associated with other plant traits, the evolutionary co-variations of plant traits with seed mass are still not sufficiently understood. Thus, it is difficult to evaluate the consistency of functional traits’ relations and to disentangle them from traits’ evolutionary histories. For example, a generally positive correlation between seed mass and genome size (GS) across Spermatophytes has been shown, but this relationship is absent across Angiosperms (Beaulieu et al., Reference Beaulieu, Moles, Leitch, Bennett, Dickie and Knight2007), possibly because it is mediated by other ecological and functional constraints (Price, Reference Price1988; Veselý et al., Reference Veselý, Bureš, Šmarda and Pavlíček2012; Shao et al., Reference Shao, Li, Luo, Wang, Xi, Liu and Xu2021).
A dependence of seed mass on GS (i.e. the total amount of DNA in an unreplicated gametic nucleus, also known as a 1C value; Faizullah et al., Reference Faizullah, Morton, Hersch-Green, Walczyk, Leitch and Leitch2021) has long been sought (Beaulieu et al., Reference Beaulieu, Moles, Leitch, Bennett, Dickie and Knight2007). This dependence is likely driven by scaling relationships between GS and cell size and the number of cells in a tissue (Knight and Beaulieu, Reference Knight and Beaulieu2008). Indeed, whilst GS is highly variable across angiosperms (Pellicer et al., Reference Pellicer, Hidalgo, Dodsworth and Leitch2018; Pellicer and Leitch, Reference Pellicer and Leitch2020), there is strong evidence that it may act as a phenotypic trait, setting a lower limit on cell size, correlated with both cell division and tissue growth rate (Bennett, Reference Bennett1987; Knight and Beaulieu, Reference Knight and Beaulieu2008; Šímová and Herben, Reference Šímová and Herben2012). On the other hand, cell size and cell cycle times are correlated with a number of plant functional traits (including specific leaf area and xylem diameter; Faizullah et al., Reference Faizullah, Morton, Hersch-Green, Walczyk, Leitch and Leitch2021). In turn, natural selection acting on plant traits may also impact GS evolution, altogether leading to a correlation between GS and plant traits (Knight and Beaulieu, Reference Knight and Beaulieu2008). This may explain how GS, irrespectively of genic content, can impact species abundance, growth and fitness (Price, Reference Price1988; Carta and Peruzzi, Reference Carta and Peruzzi2016; Simonin and Roddy, Reference Simonin and Roddy2018; Faizullah et al., Reference Faizullah, Morton, Hersch-Green, Walczyk, Leitch and Leitch2021). Nevertheless, the relationship between GS and other plant traits decreases at higher ‘phenotypic scales’ (Knight and Beaulieu, Reference Knight and Beaulieu2008). Indeed, variation in seed mass is only marginally affected by changes in GS (Shao et al., Reference Shao, Li, Luo, Wang, Xi, Liu and Xu2021). The relation between GS and seed mass is a complex, non-linear association. Rather, GS is related to other life-history traits (including life forms; Stebbins, Reference Stebbins1938; Bennett, Reference Bennett1972; Bainard et al., Reference Bainard, Bainard, Henry, Fazekas and Newmaster2012; Shao et al., Reference Shao, Li, Luo, Wang, Xi, Liu and Xu2021) that are also shown to be important in the evolution of seed mass (Eriksson et al., Reference Eriksson, Friis and Löfgren2000; Moles et al., Reference Moles, Ackerly, Webb, Tweddle, Dickie, Pitman and Westoby2005).
GS and seed mass show significant phylogenetic clustering (Carta et al., Reference Carta, Bedini and Peruzzi2020; Shao et al., Reference Shao, Li, Luo, Wang, Xi, Liu and Xu2021) and a life-form-dependent distribution in GS and seed mass has been documented (Bennett, Reference Bennett1972; Moles et al., Reference Moles, Ackerly, Webb, Tweddle, Dickie, Pitman and Westoby2005; Shao et al., Reference Shao, Li, Luo, Wang, Xi, Liu and Xu2021). Accordingly, it is expected that annual herbaceous plants have lighter seeds and smaller genomes that enable rapid germination, exploitation of unpredictable habitats and completion of their life cycle before the end of the growing season (Stebbins, Reference Stebbins1938; Grant, Reference Grant1958; Harper, Reference Harper1977; Baskin and Baskin, Reference Baskin and Baskin2014). Woody angiosperms are not temporally limited like annuals, although some structural restrictions may exist regarding cell size, such as xylem diameter, with a negative effect on GS (Knight and Beaulieu, Reference Knight and Beaulieu2008). On the other hand, woody plants usually exhibit a higher investment in reserve and defence tissues in dispersal units (Moles et al., Reference Moles, Ackerly, Webb, Tweddle, Dickie, Pitman and Westoby2005). Moreover, woody plants take many years to reach reproductive maturity (Verdú, Reference Verdú2002), providing fewer opportunities to accumulate changes in GS (Beaulieu et al., Reference Beaulieu, Smith and Leitch2010). In short, woody and tall plants can have either large or small seeds, but smaller plants, be they annual or perennial, can only have relatively small seeds (Moles et al., Reference Moles, Ackerly, Webb, Tweddle, Dickie, Pitman and Westoby2005). Whilst perennial herbs usually have lighter seeds compared to woody plants, there is no obvious reason for them to be strongly limited in terms of GS (Leitch and Bennett, Reference Leitch, Bennett and Doležel2007). Rather, because of the positive relationship between generation time and GS, plants with larger genomes are usually perennials (Knight et al., Reference Knight, Molinari and Petrov2005) and are also thought to exhibit ecological constraints associated with larger GS (e.g. under-represented in extreme environments; Knight et al., Reference Knight, Molinari and Petrov2005). Altogether, it seems that differing GS and seed mass relations among life forms can be responsible for the absence of a direct relationship across angiosperms (Shao et al., Reference Shao, Li, Luo, Wang, Xi, Liu and Xu2021). However, to date, these hypotheses have not been supported by comparative studies of the correlated evolution of GS and seed mass using adaptive models.
Here, we used a macroevolutionary approach to formally test for correlated evolution of seed mass and GS towards distinct evolutionary optima according to different selective regimes related to life form in angiosperms. We applied two main classes of evolutionary models (Hansen, Reference Hansen1997): the Brownian motion (BM: stochastic evolution of continuously valued traits through time) and the Ornstein–Uhlenbeck (OU) process (adaptive evolution of traits toward optimal values). Specifically, by applying multivariate models of adaptive evolution (Clavel et al., Reference Clavel, Escarguel and Merceron2015) on data from 3242 species, we tested to what extent seed mass and GS are adaptations to plant life form. If seed mass and GS are highly adaptive traits, the OU models of trait evolution (modelling selection toward different optima according to different life forms) should outperform a pure drift trait evolution as described by BM models. Moreover, according to the expectations reported above, we should find both optimal seed mass and GS to be low in annuals, while a large evolutionary optimum in seed mass and a low optimum in GS are expected for woody plants. This prediction will be also evaluated by looking at the phenotypic evolutionary correlation between traits inferred from multivariate comparative models as this is also suggestive of different constraints acting within life forms.
Materials and methods
Data source
Seed mass data were extracted from the Seed Information Database (Royal Botanic Gardens Kew, 2022) and from TRY v5 (https://www.try-db.org; Kattge et al., Reference Kattge, Bönisch, Díaz, Lavorel, Prentice, Leadley and Cuntz2020). Seed mass data were combined with GS data (1C, prime estimates) taken from the Plant DNA C-values database (https://cvalues.science.kew.org/search/angiosperm, release 7.1, May 2020; Pellicer and Leitch, Reference Pellicer and Leitch2020). We also considered the monoploid GS (1Cx), calculated by dividing the 1C value by the ploidy level, allowing us to test for evolutionary covariation between both 1C DNA and 1Cx DNA content with seed mass. By repeating the analysis for both 1C and 1Cx, we could evaluate the effect of bulk genome content over the basal monoploid GS (the latter is much more associated with both meiosis and cell cycle duration; Beaulieu et al., Reference Beaulieu, Moles, Leitch, Bennett, Dickie and Knight2007). Moreover, as 1C evolution is largely affected by discrete transitions of ploidy level (e.g. polyploidization often followed by diploidization; Carta et al., Reference Carta, Bedini and Peruzzi2020), while the comparative adaptive models available model GS as a continuous quantitative process, it is important to use both 1C and 1Cx (the latter is much less influenced by discrete transitions; Beaulieu et al., Reference Beaulieu, Moles, Leitch, Bennett, Dickie and Knight2007) to test for GS-dependent relationships. We finally gathered 3242 and 2095 taxa, respectively, for 1C and 1Cx.
Mean seed mass and GS were calculated for each species, while within-species variation was not estimated separately for each species, because within-species samples were limited to only a few samples. Evolutionary models are particularly affected by measurement error (Silvestro et al., Reference Silvestro, Kostikova, Litsios, Pearman and Salamin2015). Hence, we estimated the pooled variance across the species and used it, weighted by sample size, to estimate the sampling variance of the individual species (see Garamszegi, Reference Garamszegi2014). All data were log10 transformed (Beaulieu et al., Reference Beaulieu, Jhwueng, Boettiger and O'Meara2012).
A phylogenetic tree was compiled by pruning from the GBMB mega-tree (GenBank taxa with a backbone provided by Magallón et al., Reference Magallón, Gómez-Acevedo, Sánchez-Reyes and Hernández-Hernández2015) of seed plants (Smith and Brown, Reference Smith and Brown2018), the 3242 angiosperm species present in our dataset. As a measure of the phylogenetic signal, we applied Pagel's λ (Pagel, Reference Pagel1999). A significant phylogenetic signal of trait states on the phylogenetic tree occurs when λ > 0, meaning taxa are more similar than expected by chance.
Models of trait evolution
To determine the evolutionary correlations and whether the evolution of seed mass and GS differed among the three life forms (representing the selective regimes), different multivariate models of trait evolution were fitted (Table 1). Two main classes of evolutionary models were applied: the BM and the OU process models. BM models estimate the stochastic evolution of a continuously valued trait through time (controlled by the drift rate parameter σ2). They can approximate various scenarios of phenotypic evolution such as drift (Felsenstein, Reference Felsenstein1988; Hansen, Reference Hansen1997; O'Meara et al., Reference O'Meara, Ané, Sanderson and Wainwright2006). In contrast, the OU models estimate trait selection toward a common optimal value and add to the BM model a parameter α that determines the strength of selection toward an optimal trait θ (Hansen, Reference Hansen1997; Butler and King, Reference Butler and King2004; Beaulieu et al., Reference Beaulieu, Jhwueng, Boettiger and O'Meara2012).
Table 1. Performance of the multivariate evolutionary models fitted on seed mass and GS (1C or 1Cx) in angiosperms

The best-fitting model, based on Akaike weights, was the OUM, which estimated a separate θ (evolutionary optimum) for each life form. σ2 represents the evolutionary drift rate (rate of stochastic motion)
Abbreviations: BM, Brownian motion models; OU, Ornstein–Uhlenbeck models.
For each main class of evolutionary models (BM and OU), we fitted two versions, for a total of four different models (Table 1): for BM models, we fitted a model with one drift rate for the whole tree (BM1) and a model with one drift rate per life-form regime (BMM). We also fitted different variants of the OU models (Beaulieu et al., Reference Beaulieu, Jhwueng, Boettiger and O'Meara2012): with a single optimum θ (OU1) or with a different optimum for each life form (OUM). In all cases, the starting value was assumed to be distributed according to the stationary distribution of the OU process (Clavel et al., Reference Clavel, Escarguel and Merceron2015). All analyses were carried out in R (R Development Core Team, 2020), using the mvMORPH package (Clavel et al., Reference Clavel, Escarguel and Merceron2015).
Each species was assigned to a life form (annual, perennial herb, woody) based on TRY v5 (https://www.try-db.org; Kattge et al., Reference Kattge, Bönisch, Díaz, Lavorel, Prentice, Leadley and Cuntz2020), the Plant DNA C-values database (Pellicer and Leitch, 2019) and on the woodiness database (FitzJohn et al., Reference FitzJohn, Pennell, Zanne, Stevens, Tank and Cornwell2014). Internal branches were assigned to each discrete category (annual, perennial herb, woody) using stochastic character mapping. The best transition model was first selected by comparing the AICc of three models fitted with the R package ape (Paradis et al., Reference Paradis, Claude and Strimmer2008): the EqualRate (ER; AICc = 4372), Symmetric (SYM; AICc = 3961) and All Rates Different (ARD; AICc = 3782) were fitted to reconstruct ancestral states in life forms. We then generated 100 stochastic maps (R package phytools; Revell, Reference Revell2012), based on the best transition model (ARD), assuming different transition rates between character states. We used stochastic maps in order to consider the effect of uncertainty in the evolutionary history of selective regimes on the tree.
The reliability of the parameter estimates returned by the models was evaluated by checking that the eigenvalues of the Hessian were positive (Clavel et al., Reference Clavel, Escarguel and Merceron2015). The AIC weight (wi), representing the relative likelihood that model i is the best-fitting model given a set of models (Burnham and Anderson, Reference Burnham and Anderson2002), was calculated for all models.
Results
Mean seed mass and GS values in life forms
Mean seed mass observed in the dataset was 15.09 mg (11.80–20.00, 95%CI) for annual herbs, 21.80 mg (0.16–43.50, 95%CI) for perennial herbs and 1001.25 mg (16.24–1986.27, 95%CI) for woody plants. Mean GS (1C) observed in the dataset was 2.67 pg (2.42–2.92, 95%CI) for annual herbs, 5.01 pg (4.61–5.42, 95%CI) for perennial herbs and 1.79 pg (1.50–2.06, 95%CI) for woody plants. Mean monoploid GS (1Cx) observed in the dataset was 2.25 pg (2.05–2.44, 95%CI) for annual herbs, 4.81 pg (4.30–5.32, 95%CI) for perennial herbs and 1.51 pg (1.29–1.73, 95%CI) for woody plants.
Phylogenetic signal
A significant phylogenetic signal was observed in both traits with λ = 0.96 (0.95–0.97, 95%CI) for seed mass, λ = 0.92 (0.91–0.93, 95%CI) for 1C and λ = 0.97 (0.97–0.98, 95%CI) for 1Cx. This indicates that closely related species have very similar seed mass and GS.
Models of seed mass and GS evolution
The multivariate analyses supported OUM as the best-fitting model for both seed mass-1C GS and seed mass-1Cx GS (AICc weight = 1; Table 1). This model suggests that the seed mass and GS have different evolutionary optima (θ) for the three life forms and that there is an evolutionary force that maintains seed mass and GS closer to these evolutionary optima than would be expected under a pure drift scenario (BM model).
The estimated parameters as medians across 100 stochastic maps are reported in Table 2. The evolutionary optimal seed mass towards which species evolved was higher for woody plants (back-transformed median = 40.87 mg) than in perennial (back-transformed median = 2.27 mg) and annual herbs (back-transformed median = 0.95 mg). However, the estimated optimal seed mass values for perennials and annuals are partially overlapping (Fig. 1) because estimated optimum values for annuals are less identifiable. The optimum GS (1C) is instead highest in perennial herbs (back-transformed median = 2.4 pg) and lowest in woody plants (back-transformed median = 1.04 pg), albeit largely overlapping with annuals (back-transformed median = 1.06 pg; Fig. 1).

Fig. 1. Evolutionary optima (θ) estimated from the multivariate OUM model. θ values are the estimated trait optima towards which 1C GS (pg) and seed mass (mg) evolve under different selective regimes (life forms): annuals (yellow), perennial herbs (green) and woody plants (brown). The dashed lines represent the median θ for each category. Each dot as well as the probability density distributions of optimal GS and seed mass were generated by running the analyses on 100 stochastic maps representing the effect of the uncertainty in reconstructing the ancestral states of life-form regimes and mapping them on the phylogenetic tree.
Table 2. Model parameters for the multivariate OUM model, which was the model that received the highest AICc weight (Table 1)
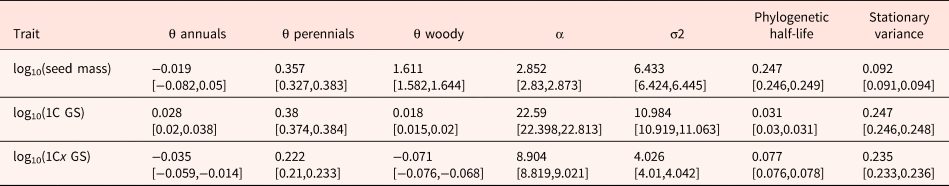
Estimated values of the parameters θ (evolutionary optimum), α (selective pull), σ2 (rate of stochastic motion), phylogenetic half-life (t 1/2 = ln(2)/α) and stationary variance (vy = σ2/2α) are shown. Parameter estimates are reported as median across 100 stochastic maps; numbers in brackets indicate the 25% and the 75% quantiles.
The phylogenetic half-life t 1/2 is longer for seed mass as compared with GS; accordingly, the selection strength estimate (α) is much higher in GS (Table 2) suggesting that GS changes towards the respective optima should happen more rapidly than seed mass changes when shifting from one life form to another. However, the estimated stationary variance and the stochasticity component (σ2) for GS were higher as compared with that of seed mass (Table 2), also indicating stronger random changes in GS.
The overall evolutionary correlation (r) between seed mass and 1C GS was moderate (0.12) while the one between seed mass and 1Cx GS was low (0.01). The evolutionary correlation was instead stronger within life forms, particularly in annual plants (0.54; Table 3).
Table 3. Evolutionary correlations (r) between seed mass and GS (1C and 1Cx)

Estimates are reported as mean across 100 stochastic maps; numbers in brackets indicate the 25% and the 75% quantiles
Discussion
Using multivariate evolutionary models on data from 3242 species, we showed an overall positive correlated evolution of seed mass and GS, deviating from a pure drift process. As we will outline below, there is strong evidence that evolutionary changes in seed and genome sizes were driven by adaptive selection towards optimal values differing among life forms. Specifically, evolutionary correlation is strongest in annual plants, suggesting that the two traits are tightly adaptively related in this group of plants, likely ensuring high regenerative potential.
The evolutionary optima towards which seed mass and GS evolve show a covariation toward small values in annuals, intermediate values in perennial herbs and a trade-off between seed mass and GS in woody plants. These results confirm our expectations and should be interpreted as functionally linked with different net effects on fitness (Laughlin et al., Reference Laughlin, Gremer, Adler, Mitchell and Moore2020) among life forms (Moles et al., Reference Moles, Ackerly, Webb, Tweddle, Dickie, Pitman and Westoby2005; Veselý et al., Reference Veselý, Bureš, Šmarda and Pavlíček2012; Shao et al., Reference Shao, Li, Luo, Wang, Xi, Liu and Xu2021) which occupy different positions in the plant life spectrum (Díaz et al., Reference Díaz, Kattge, Cornelissen, Wright, Lavorel, Dray and Gorné2016; Laughlin et al., Reference Laughlin, Gremer, Adler, Mitchell and Moore2020).
Estimated optimum seed mass values for annuals partially overlap with optimum values estimated for perennial herbs. Indeed, the selective pull (α) was lower for seed mass and the phylogenetic half-life (corresponding to the time required for the expected phenotype to move half-way toward the optimal shape from its ancestral state; Hansen, Reference Hansen1997) was longer as compared to GS, suggesting a stronger degree of phylogenetic constraint in the evolution of seed mass. Whilst the shorter phylogenetic half-life and stronger selective pull for GS can imply a strong selective pressure, the stationary variance (a measure of the relative influence of stochastic factors in the adaptive process) is also large, thus rapid changes in genome sizes may also occur as a consequence of other factors like unmeasured selective forces and genetic drift. In summary, it appears that the evolution of seed mass and GS follow a concerted evolutionary scenario mediated by life form, but it also seems that seed mass exhibits greater phylogenetic inertia compared to GS; the latter appearing much more labile. The evolutionary lability found here, particularly applies to 1C GS, likely as a consequence of rapid ploidy changes that occurred along lineages (Carta et al., Reference Carta, Bedini and Peruzzi2020). Nevertheless, the shorter phylogenetic half-life and the stronger selective pull in 1Cx compared to seed mass, still highlights a role of the basal monoploid genome quantity, irrespective of the ploidy level, in driving the observed patterns. Taken together, this empirical evidence helps understanding correlations between GS and plant traits. Nevertheless, more research is needed to separate the effects of GS from other factors influencing plant growth and fitness.
The current implementation does not allow the estimation of regime-specific selective pull (α) and drift rate (σ2) under the multivariate OUM model (Clavel et al., Reference Clavel, Escarguel and Merceron2015), unlike the univariate framework (Beaulieu et al., Reference Beaulieu, Jhwueng, Boettiger and O'Meara2012). Nevertheless, our results already suggest the occurrence of different degrees of selection in different life forms. Indeed, whilst the overall evolutionary correlation between seed mass and GS was weak, the evolutionary correlation was stronger within life forms, particularly in annual plants, suggesting that the two traits are tightly adaptively related at the seed level in this functional group of plants. This could be to ensure life cycle completion within a restricted growing season (Stebbins, Reference Stebbins1938; Grant, Reference Grant1958; Harper, Reference Harper1977; Baskin and Baskin, Reference Baskin and Baskin2014), with a corresponding positive net effect on fitness (Laughlin et al., Reference Laughlin, Gremer, Adler, Mitchell and Moore2020). In contrast, the evolutionary correlation between seed mass and GS was weaker in woody plants. Different reasons could be considered to explain this weaker correlation. First, it should be noted that the larger seed mass optimum found in woody plants is not a direct consequence of woodiness itself, but is likely to reflect the positive association with plant height (Moles et al., Reference Moles, Ackerly, Webb, Tweddle, Dickie, Pitman and Westoby2005). Then, we should consider that the positive effects of possessing larger seeds are not necessarily linked to the net effect on fitness, while the small GS, which is directly associated with vessel diameter, may have much more impact on demographic rate (such as survival or reproduction; Adler et al., Reference Adler, Salguero-Gómez, Compagnoni, Hsu, Ray-Mukherjee, Mbeau-Ache and Franco2014; Laughlin et al., Reference Laughlin, Gremer, Adler, Mitchell and Moore2020). In addition, although we found that GS is generally under selective constraints, life-history specific constraints are also present. For example, in woody plants, these constraints likely reflect the longer generation times that characterize them (Beaulieu et al., Reference Beaulieu, Smith and Leitch2010), providing fewer opportunities for changes in GS to occur per unit of time. Altogether, the weak evolutionary correlation between seed mass and GS in woody plants points toward a mismatch between the effects of seed mass and GS among developmental stages, with seed mass that is an important trait early in the life cycles, while specifically for woody plants GS is a major constraint at later stages (xylem diameter restrictions with negative effects on GS; Knight and Beaulieu, Reference Knight and Beaulieu2008).
We conclude that the evolutionary correlation between seed mass and GS is present but weaker than previously thought because this relation is strongly mediated by plant life forms. The asymmetry in the correlated evolution acting on seed and genome sizes due to life form could explain how life-history traits interplay with functional trait and how plants have evolved diverse successful life-history strategies, under prevailing environmental conditions (Adler et al., Reference Adler, Salguero-Gómez, Compagnoni, Hsu, Ray-Mukherjee, Mbeau-Ache and Franco2014; Liu et al., Reference Liu, Walck, El-Kassaby and Jimenez-Lopez2017; Lundgren and Das Marais, Reference Lundgren and Des Marais2020).
The findings of this work can help to predict the functional responses of plant traits and their prevalence in response to current and future climate change (Baskin and Baskin, Reference Baskin and Baskin2022; Carta et al., Reference Carta, Fernández-Pascual, Gioria, Müller, Rivière, Rosbakh, Saatkamp, Vandelook and Mattana2022). Moreover, understanding how life-history and functional seed traits interplay may support the potential domestication process of yet to be explored wild plants, unlocking their potential economic, nutritional, medicinal and cultural value (Mattana et al., Reference Mattana, Ulian and Pritchard2022). However, because the relationship between GS and other plant traits increases at lower phenotypic scales and the strength of such relations varies between cell types and developmental stages (Knight and Beaulieu, Reference Knight and Beaulieu2008), future studies relating GS and seed traits should be encouraged, especially concerning seed functional traits directly linked to cell cycles and/or cell expansions like embryo growth and germination (Astuti et al., Reference Astuti, Pratesi, Peruzzi and Carta2020).
Acknowledgements
All analyses were performed in the high-performance computing cluster at the University of Pisa.
Author contribution
A.C. conceived the study and performed the analyses. A.C. wrote the manuscript with help from F.V. A.C. prepared the figure with help from E.M. All authors revised the manuscript and approved the final version.
Conflicts of interest
The authors declare none.


 Open access