


Shyness is a temperamental characteristic that is typically expressed in unfamiliar social situations and in feelings of social assessment, and includes feeling uncomfortable, excessively cautious, and sensitive (Crozier, Reference Crozier1995). From the perspective of social motivation, shy individuals have conflicts between social approach and social avoidance motivation. Although they are eager to participate in social interactions, they feel nervous and anxious in the face of communication (Asendorpf, Reference Asendorpf1990). Individuals in a collectivism culture have a stronger sense of self-blame, depression and loneliness than those in an individualistic culture (Zhao, Kong, & Wang, Reference Zhao, Kong and Wang2012). Previous studies have shown that the shame experience of Chinese college students was more common and more serious than that found in other countries, and it has seriously hindered the development of college students’ social skills (Ban, Reference Ban2010).
During a critical period of self-consciousness and identity establishment, college students understand themselves through interaction with others or society. However, shy or evasive behavior hinders this kind of interaction, which has different degrees of negative impact on the interpersonal communication and self-growth development of college students. Shy college students are prone to maladaptation and may not get along with teachers and classmates. The college student community is an important builder of the future society, and a sound personality and good social skills are of paramount importance to students. Therefore, analyzing college students’ shyness and helping them to overcome shyness may have important value and significance to improve their mental health.
Shyness is the discomfort and inhibition state of an individual when others appear (Cheek & Buss, Reference Cheek and Buss1981). In the past few years, several scales have been developed to measure shyness, such as the Social Avoidance and Distress Scale (SAD; Watson & Friend, Reference Watson and Friend1969), the Revised Shyness Scale (RCBS; Cheek & Buss, Reference Cheek and Buss1981), the Interaction Anxiety Scale (IAS; Leary, Reference Leary1983a), the Shyness Syndrome Inventory (SSI, Melchior & Cheek, Reference Melchior and Cheek1990) and the Stanford Shyness Questionnaire (Shy-Q, Bortnik, Henderson, & Zimbardo, Reference Bortnik, Henderson and Zimbardo2002). However, none of these scales reveal the whole picture of shyness. For example, the IAS measures the cognitive component and emotional components of shyness, while the SSI measures the cognitive, somatic, and behavioral components of shyness (Su & Wu, Reference Su and Wu2008). These scales were compiled according to a classical test theory (CTT) framework and have fixed lengths. The only way to cover all aspects of shyness is to increase the number of items, but this would enlarge the test burden and reduce the test motivation (Forkmann et al., Reference Forkmann, Boecker, Norra, Eberle, Kircher, Schauerte and Wirtz2009). Besides, the scales usually contain items corresponding to various levels of shyness. A large number of items may deviate from respondents’ symptoms of shyness, in that they are commonly required to answer each item of a questionnaire, which may increase individuals’ measurement burden and prolong test time. A more rapid, convenient and accurate measurement method is needed to reduce the burden of shyness measurement and solve the problem of low measurement accuracy.
Computerized adaptive testing (CAT) is a new measurement technology based on item response theory (IRT) that has been developed over the past two decades. It is considered to be a suitable measurement method for various types of psychological assessment (Meijer & Nering, Reference Meijer and Nering1999). CAT selects an appropriate item based on the participant’s trait (theta) from an item pool and then updates the trait according to the responses to this item. Compared with traditional paper-and-pencil testing, CAT has many advantages. First, in CAT administrations, IRT models enable selection of the most informative items for a particular range of shyness and allow for estimation of comparable test scores from any combination of items, along with individual assessment of measurement precision (Walter et al., Reference Walter, Becker, Fliege, Bjorner, Kosinski, Klapp and Rose2005). Second, a CAT participant’s motivation to respond increases, because the selected items correspond highly to their trait (Gibbons et al., Reference Gibbons, Weiss, Kupfer, Frank, Fagiolini, Grochocinski and Immekus2008), and they may think that the test is tailored for their own condition. Third, while paper-and-pencil testing fixed the number of items, CAT can flexibly select items based on the participant’s trait (theta); therefore, CAT greatly reduces the amount of test items and reduces the test burden of participants (Tonidandel, Quinones, & Adams, Reference Tonidandel, Quinones and Adams2002). However, CAT also has disadvantages, such as being technically complex, having high initial costs, and requiring a substantial amount of human and financial resources to organize a CAT program. However, the advantages significantly outweigh the disadvantages (Meijer & Nering, Reference Meijer and Nering1999).
At present, measurement of shyness is mainly conducted with a questionnaire, and the existing shyness questionnaires have been mostly developed based on classical test theory, which is not conducive to the measurement and evaluation of shyness. Therefore, a new approach to assessing shyness in college students using CAT is worth exploring.
In this study, we aim to solve the problems mentioned above by establishing a new, more effective and accurate measurement for shyness using CAT (hereby referred to as the CAT-Shyness). The items in the initial CAT-Shyness bank were selected from seven widely used shyness scales according to the definition of shyness by Cheek and Buss (Reference Cheek and Buss1981). Otherwise, the graded response model (GRM; Samejima, Reference Samejima1969) and the generalized partial credit model (GPCM; Muraki, Reference Muraki1992), which are polytomously scored IRT models, were compared based on test-level, model-fit checks to choose one optimal model to fit the data of the CAT-Shyness. Then, several statistical analyses, including unidimensionality, local independence, item fit, item discrimination, and differential item functioning (DIF) analyses were conducted to create the final item bank of the CAT-Shyness (see Appendix). Finally, both a CAT simulation study and a real data study were carried out to investigate the marginal reliability, convergent-related validity, and predictive utility (sensitivity and specificity) of the proposed CAT-Shyness.
Methods
Participants
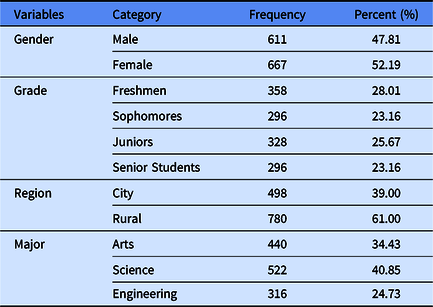
About 1400 participants were recruited from four universities in Jiangxi Province, China. Before the survey, participants were informed that their personal information would be kept confidential and the test would take about 20 minutes. Participants volunteered to take part in the survey. After excluding some invalid data due to large missing responses, 1278 participants remained. The mean age was 20.06 years (SD = 1.57, ranging from 18 to 29 years). Table 1 contains the detailed demographic information. This study was approved by the Research Center of Mental Health, Jiangxi Normal University and the Ethics Committee of the Department of Psychology of Jiangxi Normal University. Written informed consent was obtained from all of the participants in accordance with the Declaration of Helsinki.
Table 1. Demographic characteristics (N = 1278)
Measures
The initial item bank was determined by referring to previous studies and consisted of 117 items from seven widely used shyness scales, including the Revised Shyness Scale (RCBS; Cheek & Buss, Reference Cheek and Buss1981), Social Avoidance and Distress Scale (SAD; Watson & Friend, Reference Watson and Friend1969), Brief Fear of Negative Evaluation Scale (BFNS; Leary, Reference Leary1983a), Interaction Anxiousness Scale (IAS; Leary, Reference Leary1983b), Shyness Scale (SS; Su & Wu, Reference Su and Wu2008), McCrosky Shyness Scale (MSS; McCrosky & Richmond, Reference McCroskey and Richmond1982), and the Shyness Syndrome Inventory (SSI; Melichor & Cheek, Reference Melchior and Cheek1990). As different shyness scales may contain very similar or even the same topics, in order to avoid overlapping of the items in the item bank, those items with the same topics were removed. Based on previous studies, items from the seven selected scales could be classified into nine domains (Cheek & Buss, Reference Cheek and Buss1981; Leary, Reference Leary1983a, Reference Leary1983b; McCrosky & Richmond, Reference McCroskey and Richmond1982; Melichor & Cheek, Reference Melchior and Cheek1990; Su & Wu, Reference Su and Wu2008; Watson & Friend, Reference Watson and Friend1969): shyness, social avoidance, social distress, cognitive component of shyness, somatic component of shyness, emotional component of shyness, behavioral component of shyness, fear of negative evaluation, and interaction anxiousness. Table 2 contains detailed information about these scales.
Table 2. Sources and proportions of items
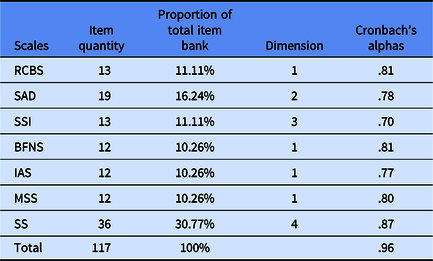
Note: RCBS, Revised Shyness Scale; SAD, Social Avoidance and Distress Scale; SSI, Shyness Syndrome Inventory; BFNS, Brief Fear of Negative Evaluation Scale; IAS, Interaction Anxiousness Scale; MSS, McCrosky Shyness Scale; SS, Shyness Scale.
All of the seven chosen scales are self-reported scales. The RCBS contains 13 items with a 5-point Likert-type scale (Very uncharacteristic or untrue, strongly disagree to Very characteristic or true, strongly agree). The SAD contains 19 items and each item has two levels (yes and no). The BFNS and the IAS both contain 12 items with a 5-point Likert-type scale (Not at all characteristic to Extremely characteristic). The SS contains 36 items with a 5-point Likert-type scale (Not at all characteristic to Extremely characteristic). The SSI contains 13 items with a 5-point Likert-type scale (Very uncharacteristic or untrue, strongly disagree to Very characteristic or true, strongly agree). The MSS contains 12 items with a 5-point Likert-type scale (Strongly disagree to Strongly agree).
Except for the MSS and the SSI, the other five scales have a Chinese version. The RCBS was revised into Chinese for college students (Xiang, Ren, Zhou, & Liu, Reference Xiang, Ren, Zhou and Liu2018). The results demonstrated that the Cronbach’s alpha and retest reliability of the Chinese version of RCBS were .88 and .58 respectively. As for validity, the Chinese version of the RCBS had a close association with the Social Interaction Anxiety Scale (r = .77, p < .01). Peng, Fan, and Li (Reference Peng, Fan and Li2003) modified the SAD in China and the results showed that the Cronbach’s alpha and retest reliability of the Chinese version of the SAD were .85 and .76 respectively, and the subscale reliabilities of the Chinese version of SAD were .77 and .73 respectively. Regarding its validity, the Chinese version of SAD had a significant correlation with the IAS (r = .67, p < .01). The Chinese versions of the BFNS and IAS were developed by Wang, Wang, and Ma (Reference Wang, Wang and Ma1999). The Chinese version of the BFNS had a Cronbach’s alpha of .90 and a retest reliability of .75. Regarding validity, the Chinese version had a close correlation with the SAD (r = .51, p < .01). The Chinese version of the IAS had a Cronbach’s alpha of .87 and a retest reliability of .80. Regarding validity, the Chinese version of the IAS had a close correlation with the RCBS (r = .60, p < .01). The SS is a Chinese scale developed by Su and Wu (Reference Su and Wu2008), with a Cronbach’s alpha of .95 and a retest reliability of .90. Their findings indicated that the subscale reliabilities of the Chinese version of the SS were .80 ~ .87. Regarding validity, the SS had a close correlation with the RCBS (r = .88, p < .01).
Melchior and Cheek (Reference Melchior and Cheek1990) reported that in the SSI revision sample of 326 college students, the alpha internal consistency coefficient was .94; it had a 45-day retest reliability of .91 for a sample of 31 college students, with a correlation of .96 with the RCBS. The MSS had a Cronbach’s alpha of .90 and had a significant correlation of .01 with the RCBS (McCrosky & Richmond, Reference McCroskey and Richmond1982). The MSS and the SSI were translated into Chinese. The translation of the MSS and the SSI were performed by six researchers with extensive experience in translation of self-report measurement. Three of them performed a forward translation of the items, and the other researchers performed an independent review of these translations. Following this, if there were different opinions on translation, discussions and revisions were needed by the six researchers and a professor of psychology. Revisions and seminars were repeated until consistent results are obtained. The confirmatory factor analysis (CFA) showed that the Chinese version of the MSS had the same structure as the original MSS (Tucker-Lewis index [TLI] = 0.89, confirmatory fit index [CFI] = 0.91, root mean square error of approximation [RMSEA] = 0.07, standardized root mean square residual [SRMR] = 0.06). The alpha coefficient for the Chinese version of the MSS was .80, and it has a close association with the RCBS (r = .42, p < .01). Regarding the Chinese version of the SSI, after setting the error terms of item 10 with item 8, and item 2 with item 1 to be related due to their content being very similar, the SSI had the same structure with the original SSI, with TLI = 0.91, CFI = 0.93, RMSEA = 0.05 and SRMSR = 0.04. The alpha coefficient for the Chinese version of the SSI was .70, and the SSI has a close association with the RCBS (r = .73, p < .01). These indicated that the Chinese version of the MSS and SSI have acceptable reliability and validity.
To validate the proposed CAT-Shyness, the Shyness Questionnaire (Shy-Q; Bortnik et al., Reference Bortnik, Henderson and Zimbardo2002) was chosen as the external criteria scale. It is commonly used to diagnose shyness symptoms in a clinical setting. It is considered that the average score of participants is more than 3.5 (Henderson, Gilbert, & Zimbardo, Reference Henderson, Gilbert, Zimbardo, Hofmann and DiBartolo2014). There are 35 items in the scale, which are divided into four dimensions: self-blame, seeking approval, fear of rejection, and self-restriction of expression. The scale is 5-point Likert-type scale, with 1 = Not at all characteristic and 5 = Extremely characteristic. In this study, the Cronbach’s alpha was .88.
Construction of the CAT-Shyness Item Bank
For construction of the CAT-Shyness item bank, statistical analyses based on IRT were sequentially carried out, including the IRT analyses of unidimensionality, local independence, item fit, item discrimination, and DIF.
Unidimensionality
Within the framework of IRT, the unidimensionality assumption was checked first. Given the clear correlation shown between the different personality traits (Muñiz, Suárez-Álvarez, Pedrosa, Fonseca-Pedrero, & García-Cueto, Reference Muñiz, Suárez-Álvarez, Pedrosa, Fonseca-Pedrero and García-Cueto2014), a unidimensional hypothesis for the battery was established. Robust maximum likelihood estimation method was used in the exploratory factor analysis (EFA).
In EFA, the unidimensional hypothesis is established when the first factor explains at least 20% of the total variance (Reckase, Reference Reckase1979) and the explanatory variance ratio of the first factor to the second factor is more than 4 (Reeve et al., Reference Reeve, Hays, Bjorner, Cook, Crane and Teresi2007).
To confirm acceptable unidimensionality of the dataset, we first ran an EFA and eliminated items with factor loadings below 0.30 (Nunnally, Reference Nunnally1978) on the first factor, and then reran the EFA to investigate the unidimensionality of the item pool.
Parameter estimation
Based on the 1278 response data, item parameters were estimated by expectation-maximization (EM) algorithm via IRTPRO2.1.
Model selection
In IRT, choosing an appropriate model for data analysis is the premise to ensure the accuracy of data analysis results. In this study, the commonly used Akaike information criterion (AIC), Bayesian information criterion (BIC), and -2 log-likelihood (-2LL) were used to determine which model fit best. The smaller these test-fit indices are, the better the model fit (Posada & Crandall, Reference Posada and Crandall2001).
Under the IRT framework, IRT models can be divided into two main categories: the difference models (or cumulative logit models) and the divided-by-total models (or adjacent logit models; Tu, Zheng, Cai, Gao, & Wang, Reference Tu, Zheng, Cai, Gao and Wang2017). The graded response model (GRM; Samejima, Reference Samejima1969) is a typical model in difference models; in addition, the generalized partial credit model (GPCM; Muraki, Reference Muraki1992) is a representative model of divided-by-total models. The GPCM is an extension of the partial credit model (PCM; Masters, Reference Masters1982) by adding the discrimination parameter. The GRM has the same number of item parameters as the GPCM and belongs to the class of models that measures the response in order. After investigating a large number of studies, the above two models were not only commonly used polytomously scoring models in IRT, but also commonly used in CAT (e.g. Paap, Kroeze, Terwee, Palen, & Veldkamp, Reference Paap, Kroeze, Terwee, Palen and Veldkamp2017). Therefore, the model with the smaller test-fit indices between the GRM and the GPCM was selected for further analysis.
Local independence
Local independence is also a necessary assumption of IRT models. It means that when controlling for trait levels, the response to any item is unrelated to the response for any other item (Embretson & Reise, Reference Embretson and Reise2000). In other words, there are no other underlying factors explaining the response behavior. Yen’s Q3 statistic (Yen, Reference Yen1993) was used to test local independence, where Q3 values higher than 0.36 were represented as locally dependent (Flens, Smits, Carlier, van Hemert, & de Beurs, Reference Flens, Smits, Carlier, van Hemert and de Beurs2016). Therefore, items with a Q3 larger than 0.36 were removed from the item pool.
Item fit
The item-fit test was used to determine whether the item fitted to the IRT model, and the item-fit test was performed using the S-χ2 statistic (Orlando & Thissen, Reference Orlando and Thissen2003). Items with p values of S-χ2 less than .01 were eliminated from the original item bank (Flens et al., Reference Flens, Smits, Carlier, van Hemert and de Beurs2016).
Item discrimination parameters
In GRM and GPCM, which are both two-parameter models, the relation is determined by two parameters: the discrimination parameter (a), giving information about the discriminative ability of an item; and item threshold parameter (b), indicating the location or difficulty of an item. According to Fliege’s criteria (Fliege, Becker, Walter, Bjorner, & Rose, Reference Fliege, Becker, Walter, Bjorner and Rose2005), we deleted items with low discrimination (<.7).
Differential item functioning
DIF was analyzed to identify item bias for a wide range of variables, such as gender or region, to build nonbiased item banks. DIF analyses were conducted using the polytomous logistic regression method (Swaminathan & Rogers, Reference Swaminathan and Rogers1990) via the package lordif (Choi, Gibbons, & Crane, Reference Choi, Gibbons and Crane2011). Change in McFadden’s pseudo R 2 was used to evaluate effect size, and the hypothesis of no DIF was rejected when R 2 change ≥ .2 (Flens et al., Reference Flens, Smits, Carlier, van Hemert and de Beurs2016), so these items were removed from the final analysis. We evaluated DIF for region (rural, city) and gender (male, female) groups.
The IRT analyses were all done in R package mirt (Version 1.24; Chalmers, Reference Chalmers2012). The analyses of unidimensionality, local independence, item discrimination, item fit, and differential item functioning were repeated until all remaining items of CAT-Shyness sufficiently satisfied the above rules.
CAT-Shyness Simulated Study
After the final item bank was established, the CAT simulation was carried out. Based on the CAT-shyness real item bank parameters, the performance of the CAT-shyness in different shy levels was simulated to test its feasibility and rationality and its related algorithm. The social shyness trait levels of the subjects were simulated and ranged from −3.5 to 3.5 intervals of 0.25. Each point simulated 100 subjects, and a total of 2900 subjects were simulated. All analyses were done in R (Version 3.4.1) and catR package for R studio (Magis & Raiche, Reference Magis and Raiche2011).
Starting point, scoring algorithm, item selection algorithm, and stopping rule
The first step was to determine the starting point. In CAT simulation, item selection depends on the participants’ responses to a given item. At first, however, the participant knows nothing about prior information. Therefore, a simple and effective method is to randomly select the first item from the final item bank (Magis & Barrada, Reference Magis and Barrada2017).
The second step used a scoring algorithm to estimate the score on the latent trait of the simulated subjects. The expected a posterior estimation (EAP) method was used to estimate the person parameters. First, this method can effectively utilize the information provided by the entire posterior distribution, and the EAP algorithm has high stability. Second, it does not need iteration and the calculation process is simpler. The simplicity and stability of the EAP makes it a widely used method for CAT simulations (e.g., Bulut & Kan, Reference Bulut and Kan2012; Chen, Hou, & Dodd, Reference Chen, Hou and Dodd1998). Third, the accuracy of EAP estimates are higher than the MLE (e.g., Sorrel, Barrada, de la Torre, & Abad, Reference Sorrel, Barrada, de la Torre and Abad2020).
The third step was to determine the item selection algorithm. Maximum Fisher information criterion (van der Linden, Reference van der Linden1998) is the most widely used item selection algorithm in CAT programs. Its purpose is to improve the accuracy of measurement, but it is also likely to lead to uneven exposure of items in the item bank and reduce the safety of testing (Barrada, Olea, Ponsoda, & Abad, Reference Barrada, Olea, Ponsoda and Abad2009). However, as Likert-type scales require participants to respond in the usual way, the response results without correct answers greatly reduces the safety of the test. Therefore, maximum Fisher information criterion was chosen as the item selection algorithm.
Finally, the stopping rules were based on the standard error (SE) of measurement. That is, the CAT will be stopped if participants’ SE of measurement reaches the predefined SE of measurement, which is also called the variable length termination rule.
The relationship between the SE and the Fisher information can be defined as
 $${\rm{SE}}\left( {\rm{\theta }} \right) = {\frac{1}\over{{\sqrt {\mathop \sum \nolimits_{j=1}^n {I_j}\left( {\rm{\theta }} \right)} }}$$
where n is the number of items the participant has answered. In this study, several stopping rules with different SEs were performed, including SE ≤ .50, SE ≤ .45, SE ≤ .40, SE ≤ .35, SE ≤ .30, SE ≤ .25 and SE ≤ .20.
Properties of the item pool
In order to explore the estimation results of simulated subjects under different stopping rules, bias, mean absolute deviation (MAD), root mean square error (RMSE), correlation coefficient between the subject’s true shyness trait, and the estimated shyness trait by CAT-Shyness were all investigated to determine the effectiveness of the CAT-Shyness related algorithms.
The exposure rate (ER) index was used to measure the security of the item pool. ERj = ƒj/N ERj is the exposure rate of item j, and ƒj is the number of times that j is selected. The smaller the ERj, the lower the exposure rate. The chi-squared statistic is used to reflect the overall exposure of the item bank as
 $${{\rm{\chi }}^2} = {\mathop \sum \limits_{j=1}^{\rm{M}} {\frac{{{{\left[ {E{R_j} - E\left( {E{R_j}} \right)} \right]}^2}}}\over{{E\left( {E{R_j}} \right)}}}}$$
where E(ERj) = L/M is the expected exposure rate of item j, L represents the test length, and M is number of items in the item pool (Chang & Ying, Reference Chang and Ying1999). The chi-squared index reflects the difference between the observed item exposure rate and expected exposure rate. The smaller the chi-squared index, the safer the item pool.
The CAT-Shyness real study
In this part, we used real participants’ data that had already been collected and used in development of the item pool. The CAT program stopping rules were also set to when the SE (θ) of measurement reached .50, .45, .40, .35, .30, .25 or .20. The parameter estimation method and item selection algorithm have been discussed above.
Characteristics of the CAT-Shyness
To investigate the characteristics of the CAT-Shyness, several statistics were calculated: number of items used (including the means and standard deviations), mean standard error of theta estimates, marginal reliability, Pearson’s correlation between the estimated theta in the CAT-Shyness, and the estimated theta via the entire item bank. The marginal reliability is the mean reliability for all levels of theta (Smits, Cuijpers, & van Straten, Reference Smits, Cuijpers and van Straten2011). The ER index is also calculated to measure the security of the item pool.
In addition, the number of selected items under several stopping rules was plotted as a function of the final theta estimation and test information curve. The test information shows the measurement precision of the CAT-Shyness: the larger the value, the smaller the error of the theta estimation.
Convergent-related validity of the CAT-Shyness
Convergent-related validity refers to how closely the new scale is related to other variables and other measures of the same construct (Paul, Reference Paul2017). To further investigate the convergent-related validity of the CAT-Shyness, the Shy-Q (Bortnik et al., Reference Bortnik, Henderson and Zimbardo2002), which is widely used in diagnosing shyness, was selected as the criterion scale. Pearson’s correlation between the estimated theta in the CAT-Shyness and the score of the Shy-Q was calculated to address the convergent-related validity of CAT-Shyness.
Predictive utility (sensitivity and specificity) of the CAT-Shyness
The area under curve (AUC) under the receiver operating characteristic (ROC) curve index was used as an additional criterion to investigate the predictive utility (sensitivity and specificity; Smits et al., Reference Smits, Cuijpers and van Straten2011) of the CAT-Shyness. A larger AUC index indicates a better diagnostic effect (Kraemer & Kupfer, Reference Kraemer and Kupfer2006). We used the Shy-Q (Bortnik et al., Reference Bortnik, Henderson and Zimbardo2002) as the classified variable for shyness. Moreover, the estimated theta in CAT-Shyness was used as a continuous variable to plot the ROC curve under each stopping rule. The meaning of the AUC sizes is shown in Table 3 (Forkmann et al., Reference Forkmann, Kroehne, Wirtz, Norra, Baumeister, Gauggel and Boecker2013).
Table 3. AUC indicator size description
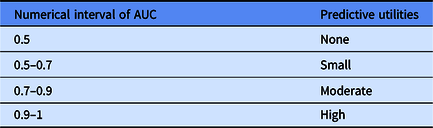
Note: AUC, area under curve.
Determination of the critical value was calculated by maximizing the Youden Index (YI = sensitivity + specificity – 1; Schisterman, Perkins, Liu, & Bondell, Reference Schisterman, Perkins, Liu and Bondell2005). The sensitivity indicates the probability that a patient is accurately diagnosed with a disease, and specificity is the probability of patients without disease who test negative. The bigger the two values, the better the effect of the diagnosis.
Results
Construction of the CAT-Shyness item bank
In the initial item bank development, 117 items were examined for unidimensionality, local independence and item characteristics (reliability curves, test information curves, differential item functioning, threshold, location parameters).
Unidimensionality
In order to determine whether the data were suitable for factor analysis, the Kaiser-Meyer-Olkin (KMO) test and the Bartlett spherical test were performed on the predicted data. The results showed that the KMO value was 0.96, which is higher than the minimum standard of .70, indicating that the data were suitable for factor analysis.
We performed an EFA on 117 items in the initial item bank and deleted the item with the lowest factor loading less than .30 on the first factor; the EFA model then re-estimated after each item removal. We estimated 43 EFA models. In the last EFA model, all items had a factor loading greater than .30, and 75 items remained from the initial item bank. The results show that the first eigenvalue of the factor was 17.34, the second eigenvalue was 3.08, the ratio of the two eigenvalues was 5.63, and the variance explained by the first eigenvalue was 23.12%. The results satisfy that the ratio of the two eigenvalues is greater than 4 (Reeve et al., Reference Reeve, Hays, Bjorner, Cook, Crane and Teresi2007) and the variance explained on the first eigenvalue is greater than 20% (Reckase, Reference Reckase1979). Therefore, the initial item bank consisting of the remaining 75 items satisfies the IRT one-dimensional hypothesis.
Model selection
Table 4 shows the fitness of the GRM model and the GPCM model with the real data. It can be seen that the GRM model’s -2LL, AIC, and BIC fitting index values were lower than the GPCM model, which indicated that the GRM fitted the data better than the GPCM. Therefore, the GRM was applied to the IRT analysis.
Table 4. Test-level model-fit for three polytomously scored IRT models
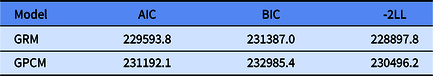
Note: GRM, graded response model; GPCM, generalized partial credit model; AIC, Akaike’s information criterion; BIC, Bayesian information criterion; -2LL, -2 log-likelihood.
Local independence
Three items were deleted from the item bank because their Q3 values were all greater than .36. The remaining items met the local independence well.
Item fit
An item-fitting test was performed on the remaining 72 items, and it was found that the p values of S-χ2 of six items were less than the critical value of .01, so these items were removed from the item bank (Reeve et al., Reference Reeve, Hays, Bjorner, Cook, Crane and Teresi2007). The p values of S-χ2 of the remaining 66 items were higher than .01 (see Table 5).
Table 5. Item parameters for 66 item-bank with GRM
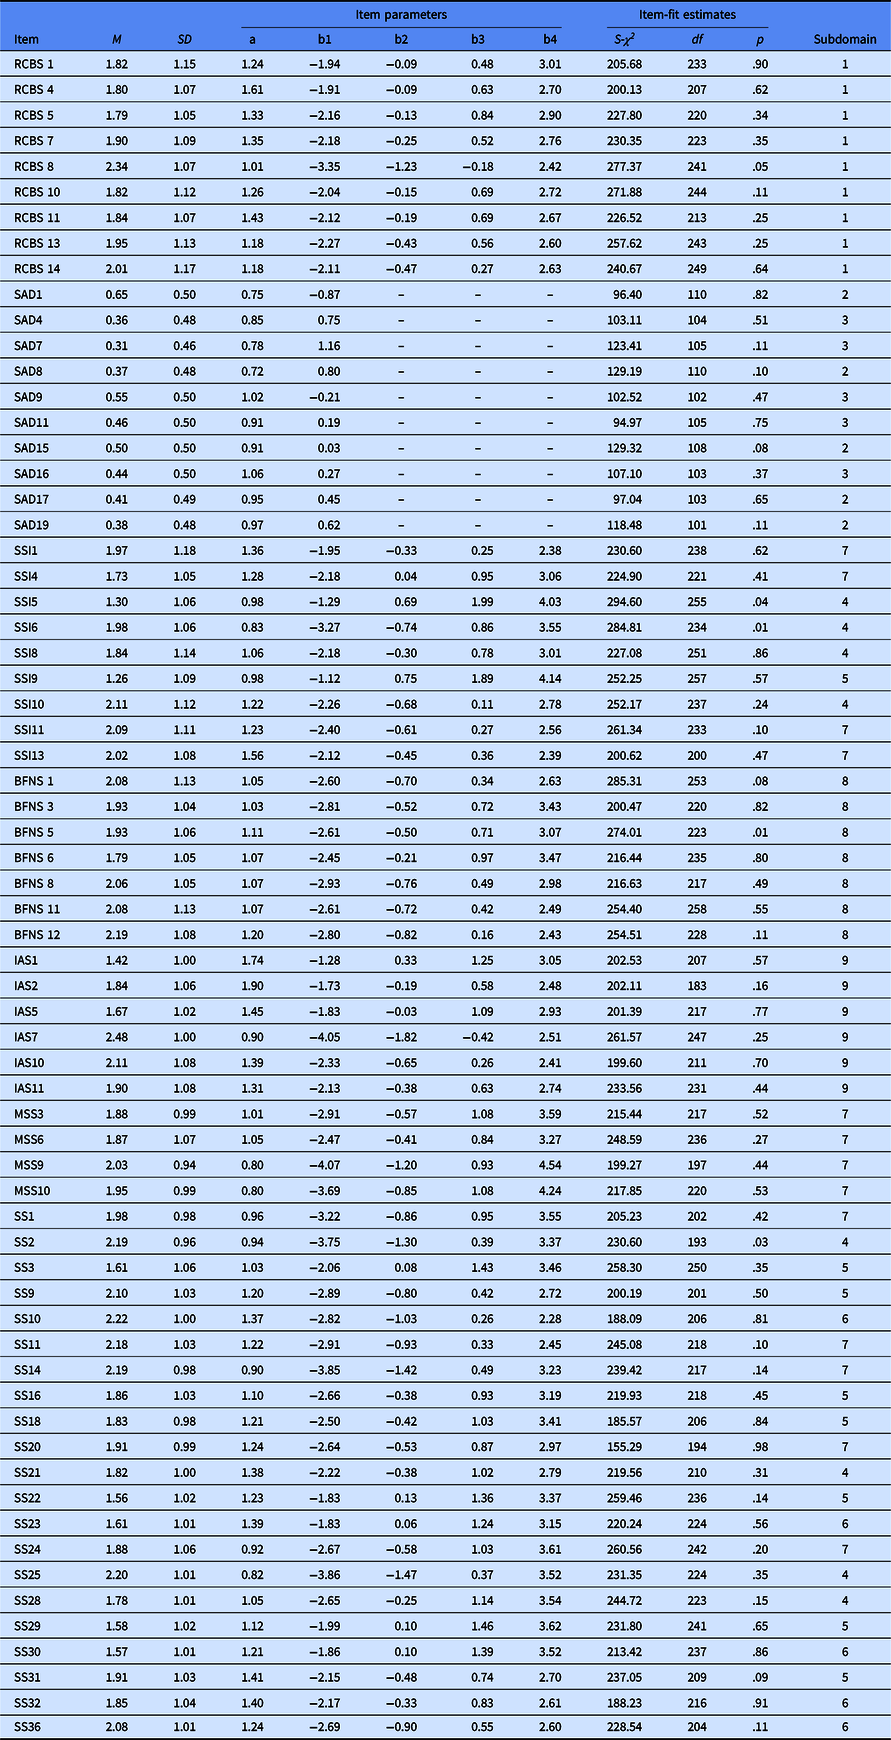
Note: The 10–19 items are scored with 0, 1, and the other items are scored with 0, 1, 2, 3, 4; subdomain: (1) shyness, (2) social avoidance, (3) social distress, (4) cognitive component of shyness, (5) somatic component of shyness, (6) emotional component of shyness, (7) behavioral component of shyness, (8) fear of negative evaluation, (9) interaction anxiousness. a, discrimination parameter; b, location parameters; S-χ2 = Orlando and Thissen’s S-statistic.
Item discrimination parameters
After the item parameters were estimated, we excluded items with a slope below .70 and re-estimated the remaining items. The number of response options per item varied between 2 and 5, with 10 dichotomous items and 56 items with 5. The threshold parameters of the remaining 66 items in the final CAT varied between −4.07 and +4.54 (Table 5), which evenly covered a broad range of the shy symptoms. Slope parameters varied between .72 and 1.90 (Table 5).
Differential item functioning (DIF)
In order to ensure the fairness of the test, this study separately tested the functional differences of the subjects in terms of region (rural, city) and gender (male, female) groups, and found that the change of R 2 in all items was less than .02, that is, there was no DIF for the remaining 66 items, so no item was deleted.
Finally, the remaining 66 items were reanalyzed using the one-dimensionality test, local independence test, item fit test, discrimination test, and DIF test; all 66 items met the measurement requirements set out above. The average discrimination parameter of the 66 items was 1.14 (SD = 0.24), indicating that the whole item bank had a higher quality.
CAT-Shyness Simulated Study
Table 6 documents the ability estimation results of simulated subjects under different stopping rules. The results indicate that whatever stopping rules were used, the bias MAD was less than 0.5, which indicated that the estimation of the shyness of a participant in the CAT-Shyness had an ideal recovery. The RMSE was also less than 0.5 when the stopping rule was SE ≤ .20, SE ≤ .25, SE ≤ .30, SE ≤ .35, SE ≤ .40. However, when the stopping rule was SE ≤ 0.45 or SE < 0.50, the error was slightly larger (RMSE exceeds 0.5), which also indicated that the stopping rule with SE ≤ .45 or SE < .50 may not be suitable for CAT-Shyness. Researchers or users can choose the other five stopping rules, which are SE ≤ .20, SE ≤ .25, SE ≤ .30, SE ≤ .35 or SE ≤ .40. Table 6 also shows that under any stopping rule, the correlation coefficient between CAT-Shyness estimated shy traits and their true values was as high as .97 or more (p < .001), and there was a highly significant positive correlation. It indicated that they had high consistency, and the correlation was stronger as the estimation accuracy increases. Table 6 shows the chi-squared index was smallest when the stopping rule was SE ≤ .20, which means the item pool is mostly safe. The chi-squared index was not significantly different when the stopping rule was SE ≤ .25, SE ≤ .30, SE ≤ .35, SE ≤.40, SE ≤ .45, and SE ≤ .50.
Table 6. Ability estimation results of simulated subjects under different stopping rules
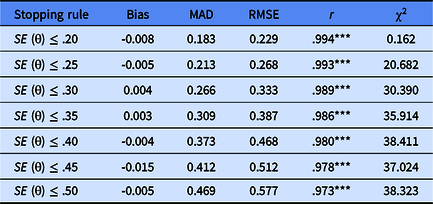
Note: MAD, mean absolute deviation; RMSE, root mean square error; r, estimation of the relationship between the estimated value and the true value; ***p < .001; χ2, the difference between the observed item exposure rate and expected exposure rate.
Figure 1 shows the average amount of items used by the simulated subjects in CAT-Shyness (SE ≤ 0.35). As the degree of shyness level increased, the average number of items used by the participants decreased. When a participant’s shy trait value ranged from −1.5 to 1.5, the average test was less than 15 items (less than a quarter of the total item bank) and the marginal reliability of the test was greater than .88. This result shows that CAT-shyness is suitable for the measurement of shyness, and it can greatly reduce the test items without losing the accuracy of measurement.

Figure 1. Item usage with SE ≤ .35 of competence.
Figure 2 displays the reliability and the whole test information for every simulated tester. For participants with a theta between −2 and 3, the marginal reliability of the test reached .95 or higher; and for participants with a theta between −3 and −2, the marginal reliability of the test was also around .94, which is higher than .9. All of these proved that the quality of this item bank is good.
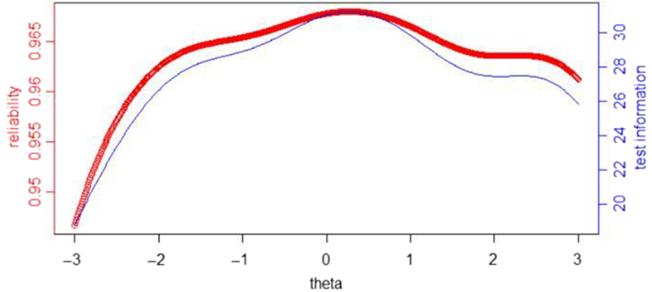
Figure 2. The reliability and the test information for every simulated tester completed for each item.
CAT-Shyness Real Study
Characteristics of CAT-Shyness
Table 7 shows the measurement characteristics based on the real test of CAT-Shyness, including the number of items used by the participants on CAT-Shyness, the average measurement error and the marginal reliability of the measurement. The last column of Table 7 shows the Pearson’s correlation between the estimated theta in the CAT-Shyness and the estimated theta via the entire item bank.
Table 7. Characteristics of CAT-Shyness under different stopping rules
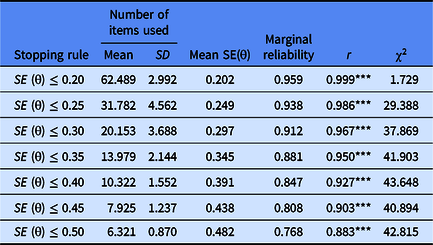
Note: r, the Pearson’s correlation between the estimated theta in the CAT-Shyness and the estimated theta via the entire item bank; ***p < .001; χ2, the difference between the observed item exposure rate and expected exposure rate.
Table 7 shows that the average length of the test used by the 1278 participants on the CAT-Shyness will increase as the measurement accuracy increases. When the stopping rule was SE ≤ .35, the correlation between the CAT-Shyness estimated trait value of the subject and the trait value estimated using the entire item bank was as high as .95 (p < .001). The length of the test was about 14 items for the stopping rule of SE ≤ .35, which only accounts for one fifth of the total number of items in the item bank and can save 1–1/5 = 80% of the items. Regardless of the stopping rule, the correlation coefficients between the estimated theta in the CAT-Shyness and the estimated theta via the entire item bank were all higher than .9 (p < .001), and the average measurement error was below .5, which met the measurement requirements under the framework of IRT.
Table 7 also shows that when SE ≤ .20, SE ≤ .25, SE ≤ .30 and SE ≤ .35, the measured marginal reliabilities of the CAT-Shyness were higher than .85; and when SE ≤ .40, SE ≤ .45 and SE ≤ .5, the measured marginal reliability of CAT-Shyness was between .75 and .85, which were all generally acceptable for individuals. This means that if the measurement reliability of CAT-Shyness in real measurement is to be above .85, the stopping rule strategy of CAT-Shyness can be set to SE ≤ .35 or less, but the test length used in consideration of SE ≤ .3 is more than 1.5 times than that of SE ≤ .35, so the termination rule of SE ≤ .35 can take into account both measurement efficiency and measurement accuracy.
Table 7 shows the chi-squared index was smallest when the stopping rule was SE ≤ .20, which means the item pool is mostly safe. The chi-squared index was not significantly different when the stopping rule was SE ≤ .30, SE ≤ .35, SE ≤ .40, SE ≤ .45, and SE ≤ .50.
Figure 3 displays the number of items administered intuitively across the latent trait under each stopping rule. As documented in Figure 3, despite a great quantity of items administered to individuals with lower trait/theta, the test information was still low. Individuals with middle or high trait/theta only needed to do fewer items and the test information was higher. For example, under the stopping rule SE (theta) ≤ 0.20, (1) the test information was less than 10 for those whose theta was less than −3 even if the entire item bank was administered to them; while (2) the test information was over 25 for those whose theta ranged from −1 to 1.
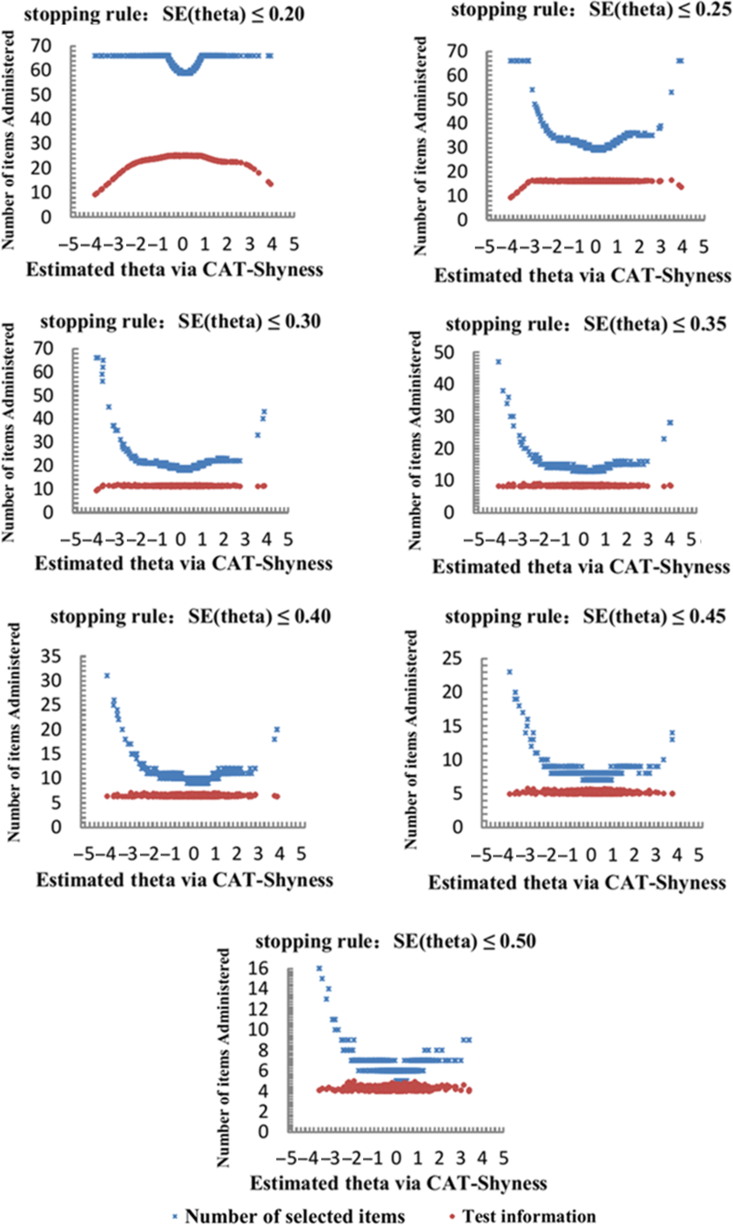
Figure 3. Number of selected items and test information curve under different stopping rules.

Figure 4. Receiver operating characteristic (ROC) curve for different stopping rules in the CAT-Shyness.
Convergent-related validity of CAT-Shyness
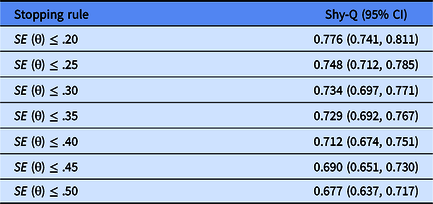
As shown in Table 8, the Pearson’s correlations between CAT-Shyness score and the Shyness Questionnaire (Shy-Q) score ranged from .738 to .776 under different stopping rules. The results indicated that no matter which stopping rule was used, CAT-Shyness had an acceptable and reasonable external convergent-related validity.
Table 8. Criterion-related validity of CAT-Shyness with external criteria scales
Predictive utility (sensitivity and specificity) of CAT-Shyness
Table 9 presents the results of the CAT’s diagnostic accuracy based on the Shyness Questionnaire. The AUC values under all stopping rules were all higher than the critical value of .7, which is widely used as the lower bound for moderate predictive utility. In addition, the sensitivity and specificity of CAT-Shyness were also both acceptable. These results suggested the predictive utility of CAT-Shyness was reasonable.
Table 9. The predictive utility (sensitivity and specificity) of CAT-Shyness
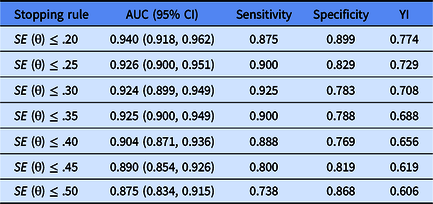
Note: YI, Youden-Index = sensitivity + specificity – 1.
Discussion
In this study, CAT-Shyness was developed using the GRM with a large sample of college students and then the characteristics, marginal reliability, convergent-related validity and predictive utility (sensitivity and specificity) of CAT-Shyness were validated. In order to build a high-quality item bank, items were carefully selected from seven widely used shyness scales. Then, a strict one-dimensional test was carried out to test whether the assumptions of the IRT model were satisfied. In addition, two commonly used polytomous IRT models were compared, and the GRM model was selected to fit the real data due to it having better test level fit than the GPCM. Finally, after sequential analyses of IRT, a high-quality item bank was constructed that included 66 items, and these items had local independence, good item fit, high discrimination and no DIF. Besides, the mean IRT discrimination parameters of the item bank reached 1.14, which clearly showed that the final item bank of CAT-Shyness was of high quality.
Differing from other studies, this study took full account of the efficiency of CAT and investigated both simulated and real data. The simulation study indicated that the two stopping rules of SE (theta) ≤ .35 and SE (theta) ≤ .40 were the most effective and precise stopping rules. The results revealed that about 14 items on average were used to estimate shyness under stopping rule SE (theta) ≤ .35, while only about 6 items were needed with stopping rule SE (theta) ≤ .5. In addition, the theta estimates of the CAT and the full-item bank were very similar and the correlation was very high, exceeding .88 (p < .001). Moreover, CAT-Shyness had an acceptable marginal reliability with an average of .88, ranging from .77 to .96. These results show that the proposed CAT-Shyness not only has high measurement accuracy, but can also greatly shorten the test length (Smits et al., Reference Smits, Cuijpers and van Straten2011).
A further investigation into the convergent-related validity and predictive utility (sensitivity and specificity) of CAT-Shyness was then carried out. The results revealed that: (1) CAT-Shyness had reasonable and acceptable convergent-related validities; (2) the sensitivity and specificity of the CAT-Shyness were both acceptable, and especially for stopping rule SE (theta) ≤ .35, the sensitivity and specificity of the CAT-Shyness were .90 and .79 respectively. So, the CAT-Shyness had good screening performance. The sensitivity (.738–.925) and specificity (.783–.899) of the CAT-Shyness were both acceptable. The minimum probability that a patient was accurately diagnosed with a disease, and that general people were accurately diagnosed with no illness were .738 and .783, respectively, which were higher than the random level (.5).
Despite the encouraging results, this study also had some limitations. First, the participants in this study mainly came from Jiangxi Province, China. Therefore, more samples should be recruited from a wider range of provinces in the future. Second, CAT-Shyness provided little information for those with a latent trait theta higher than 3 or lower than −3, suggesting that CAT-Shyness may not be suitable for these individuals. Future research could aim to develop a CAT appropriate for these people. Third, considering the problems of item exposure rate and item elimination, the existing item bank could be further expanded. Thus, future research needs to further supplement high-quality items and conduct in-depth research on exposure control and other related issues. Moreover, CAT-Shyness is a one-dimensional test and future research could further consider how to report nine domains under CAT-Shyness. Finally, the Shy-Q was selected to determine convergent validity of CAT-Shyness, but it could not show the relationship between CAT-Shyness and some external criteria. In future, other scales could be used to measure convergent-related validity that is a variable to determine the relationship between the CAT-Shyness and a criterion. Furthermore, we chose the maximum Fisher information item selection rule because of its popularity and availability (Magis & Barrada, Reference Magis and Barrada2017). However, this rule has a slightly worse performance in terms of accuracy, compared to global information item selection rules (Sorrel et al., Reference Sorrel, Barrada, de la Torre and Abad2020), and differences are greater for extreme latent trait levels (i.e., <−1.5, >1.5). Future studies could use different item selection rules, such as the global information item selection rule, to improve test accuracy; and the CAT could be probably shorter with a different item selection rule. As CAT-Sshyness has both dichotomous and polytomous items in the item pool, future research could add polytomous items to the item pool and delete dichotomous items to create a unified (polytomous) item pool, and to improve the item discrimination parameter of the item pool.
In addition, future research could use parallel analysis (Lim & Jahng, Reference Lim and Jahng2019), which is another method to determine the number of factors retained in exploratory factor analysis. Parallel analysis is a recommended procedure for deciding on the number of components involved in extracting eigenvalues from random datasets that parallel the actual dataset with regard to the number of cases and variables (O’Connor, Reference O’Connor2000). Parallel analysis is more objective and rigorous in determining potential factors, and it is the gold standard for determining dimensionality (e.g., Lim & Jahng, Reference Lim and Jahng2019).
Conclusions
The proposed CAT-Shyness not only had acceptable psychometric properties, but also had a shorter yet efficient assessment of shyness, which can save significant test time and reduce the test burden for individuals, with less information loss.
Acknowledgments
The authors appreciated the anonymous reviewers who made very helpful comments on an earlier version of this article, and are very grateful to all the participants who were involved in this study. This research was funded by the National Natural Science Foundation of China (31960186, 31760288, 31660278).
Appendix: Final item bank of the CAT-Shyness
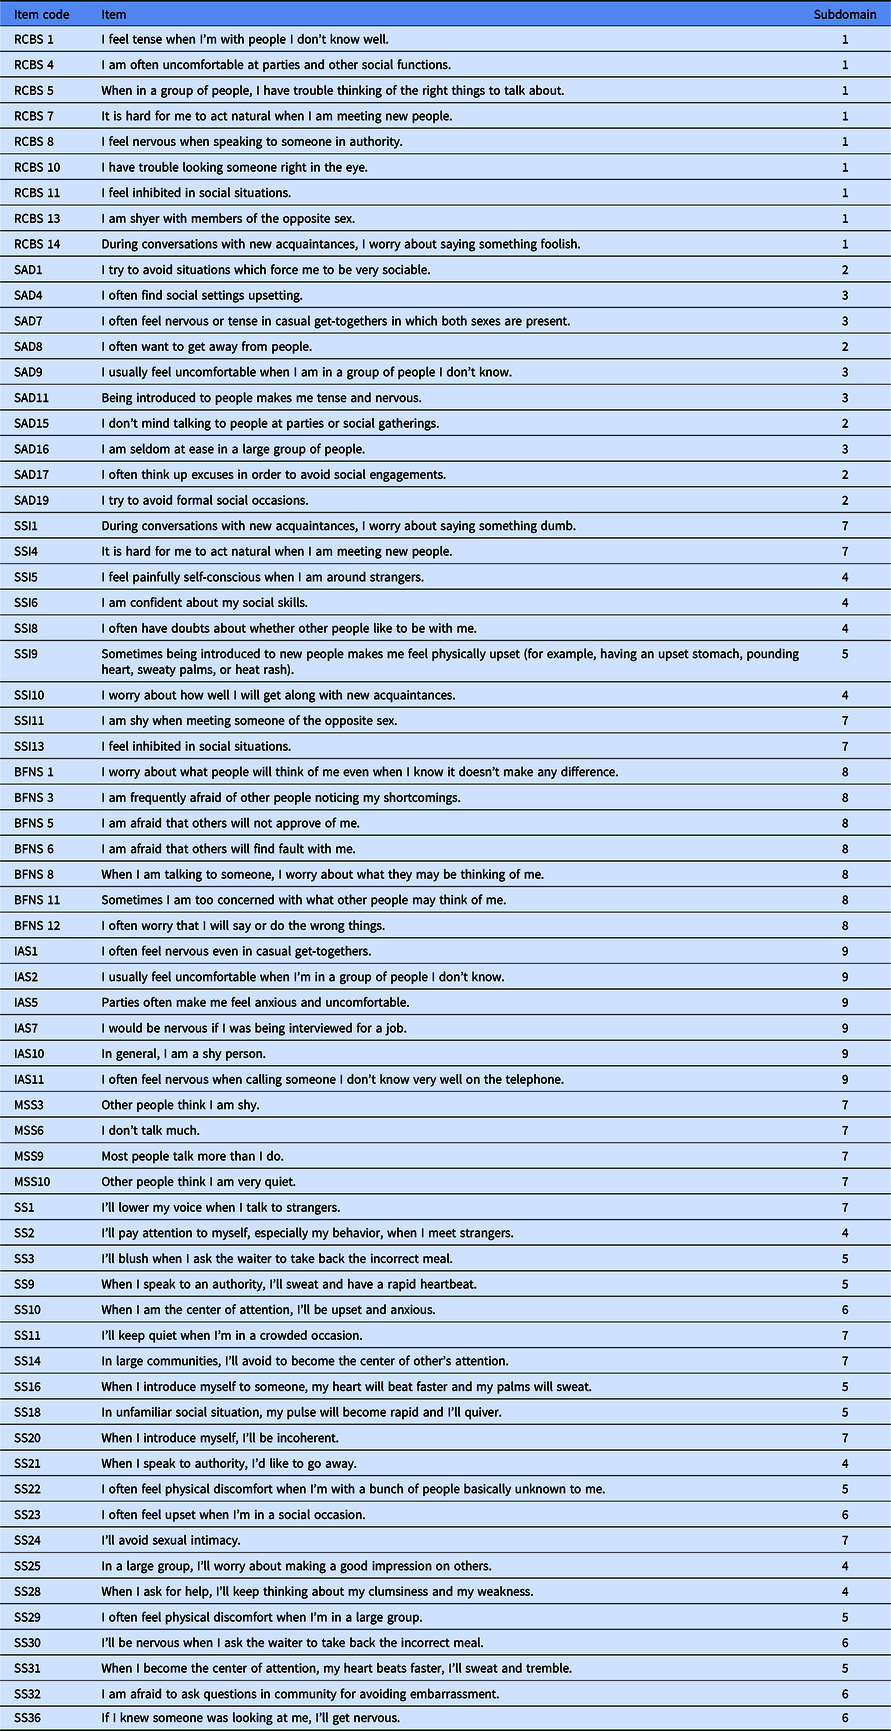
Note: Subdomain: (1) shyness, (2) social avoidance, (3) social distress, (4) cognitive component of shyness, (5) somatic component of shyness, (6) emotional component of shyness, (7) behavioral component of shyness, (8) fear of negative evaluation, (9) interaction anxiousness.


 Open access