


A series of laws in the United States, generally referred to as “Stark Laws” (named for the law's primary sponsor, United States Congressman Pete Stark), banned physicians and other health service providers from referring patients covered by Medicare (a public insurance program providing universal coverage for persons over the age of 64) to specific types of healthcare facilities in which the referring providers had an equity ownership stake (i.e., provider “self-referral”) (Reference Sutton1). The first of these laws (“Stark I”) became effective in 1992. Stark I banned referral of Medicare patients to provider-owned clinical laboratories. Effective in 1998, “Stark II” expanded the self-referral ban to several additional ancillary health services, and extended the self-referral ban to patients covered by Medicaid (a public insurance program for low income individuals). Finally, effective in 2007, “Stark III” provided additional regulatory guidance for compliance, such as defining specific provider compensation arrangements as analogous to ownership interests.
The Stark laws were motivated in part by concerns about the incentive effects of providers referring patients to various types of ancillary service facilities, including free-standing imaging centers, in which the referring physician has an ownership interest (2). The incentive issue relates to the separate payments to facilities for ancillary services in the Medicare and Medicaid payment systems, in addition to payments directly to providers. A self-referring provider thus may receive part of the facility payment by means of profit sharing arrangements associated with an equity ownership share in the ancillary service facility. The concern is that this indirect additional payment will increase the volume of referrals for ancillary services for self-referring providers compared with providers with no ownership interests.
However, the Stark laws included an exemption for in-office ancillary services (IOASs), which typically includes standard imaging, advanced imaging, ultrasound, clinical laboratory, and outpatient therapy (e.g., occupational and physical therapy). The rationale for the IOAS exception was based on the expectation that IOAS capacity would enhance physician supervision of the quality of care, allow for better coordination among patients, physicians, and ancillary services, and improve incentives for patients to adhere to recommended treatment plans (3). However, concerns have been expressed that the IOAS exception provides a loop-hole in self-referral regulations that has contributed to growth in the usage of in-office ancillary services, resulting from the incentive effect of indirect provider payment by means of self-referral (4). Indeed, the issue of ancillary ownership has been the focus of some state-led policy initiatives aimed at restricting physician ownership (5).
Despite the ongoing policy debate, little is known about the extent of onsite MRI capacity among orthopedic practices in the United States, or specific practice or practice area characteristics associated with the presence of onsite MRI capacity. This study reports the results of a 2012 Web-based survey of orthopedic practices in the United States focused on the issue of onsite MRI capacity among orthopedic practices. The survey requested general information about practice characteristics for practices with and without onsite MRI capacity. For practices reporting onsite MRI capacity, the survey asked for the type of MRI capacity (extremity or full body), and the date of acquisition for the MRI equipment. The goal of the study was to document the extent of onsite MRI capacity among orthopedic surgery practices, as well as the time trend in initial practice acquisition of onsite MRI capacity, and to explore the associations between specific practice characteristics or practice area characteristics and the likelihood of onsite MRI acquisition.
MATERIALS AND METHODS
A team from Oxford Outcomes, Inc., in collaboration with the American Academy of Orthopedic Surgeons (AAOS), developed a survey of orthopedic practices to determine if the orthopedic practice had onsite MRI capacity, and if so the type of MRI capacity (extremity or full body), the date of acquisition for the MRI equipment, and general information about the practice. The survey platform was developed using Sawtooth Software (Orem, UT; www.sawtoothsoftware.com), Web-based survey tool. A Web-hosted platform was selected because of the user-friendly, interactive format, and the ability to monitor participation and data collection in real-time.
On July 19, 2012, the survey was sent to practice administrators and physician AAOS members by means of multiple forms of communication containing an e-mail link to the survey. Two rounds of reminder communications at approximately 3-week intervals after the initial communication were used in an effort to increase participation. While the survey was in the field, the Oxford Outcomes team provided assistance to practices with questions about the survey. Most of these questions related to technical issues with the Web interface. The planned target was completed surveys for 600 orthopedic practices. By September 4th, 2012, a total of 770 orthopedic practice survey responses had been received, and the survey data collection was considered complete.
After closing the survey data collection process, all survey response data was downloaded into a master Excel spreadsheet, and variable names were assigned to each component of the survey. Preliminary data verification consisted of the following: (i) deleting duplicate entries; (ii) converting verbatim responses (e.g., respondent states “we do not own an MRI”) to appropriate code values for survey variable (e.g., “MRI” =1 for onsite MRI, or =0 for no onsite MRI), (iii) converting MRI acquisition dates as entered in the survey to a uniform date format (dd/mm/yyyy); and (iv) combining Web-based survey data with the e-mailed spreadsheets containing practice provider ID numbers. Duplicate responses from twenty-nine practices were eliminated, and one additional practice response was eliminated from the final survey sample due to a lack of item response for multiple key questions. Thus, after eliminating duplicate surveys and a survey with mostly missing data, the final survey sample consisted of responses from 740 practices.
For practices reporting that they had onsite MRI capacity, the survey requested that the respondent report the number of providers in the practice authorized to order MRI exams as of the acquisition date of the first onsite MRI reported. All non-MRI practices were asked to report the number of current providers in the practice authorized to order MRI exams. Unfortunately, approximately 25 percent of the 740 responding practices did not report the number of authorized providers (90 percent of these were non-MRI practices). For these practices, the number of providers in the practice was imputed based on the number of unique National Provider Identifier (NPI) numbers associated with the practice address as listed in the CMS NPI registry database (as of August 2012) (6).
The survey response database was augmented with county-level measures of practice area characteristics as of the year of first onsite MRI acquisition (or 2012 for practices without an onsite MRI). The county location of each practice was assigned based on the zip code location of the primary practice location reported by survey respondents. County-level variables for the initial MRI acquisition year (for MRI practices) or 2012 (for non-MRI practices) were obtained from the Area Health Resources Files (7). Specific county-level variables added to the survey database included county per capita income, the percentage of the county population age 65 or older, the unemployment rate, and county population density. Nominal per capital income for each year was inflated to 2012-equivalent dollars using the Consumer Price Index – All Items (8).
RESULTS
Overall, as shown in Table 1, the 740 practices responding to the AAOS survey reported an average of 8.3 providers authorized to order MRI exams within their practice. Most practices had fewer MRI-authorized providers (median = 3), but the number of MRI-authorized providers ranged from 1 to 138 across all practices. Most of the practices in the sample were private multiple orthopedic surgeon clinics (61.2 percent) or private solo orthopedic practices (11.6 percent), whereas 9.9 percent were multi-specialty physician clinics that included orthopedic surgery as a specialty for the clinic. In terms of payer mix, for most of the practices, commercial insurance accounted for the largest share of practice revenue (median = 44.5 percent), and Medicare accounted for less than 30 percent of total practice revenue for 50.8 percent of the practices. On average, Medicaid and Workers' Compensation insurance accounted for smaller revenue shares, though some practices reported substantial revenue shares from Workers' Compensation.
Table 1. Characteristics of Survey Sample Practices, by Onsite MRI Status, 2012

Source: AAOS Survey Data, 2012.
In the survey sample, 298 (40 percent) of the 740 practices reported having one or more onsite MRI, whereas 442 (60 percent) indicated they had no onsite MRI as of September 2012, as shown in Table 1. The number of providers authorized to order MRI exams within the practice was substantially different between the practices with onsite MRIs and those without an onsite MRI. Specifically, the MRI practices had on average 13.8 MRI-authorized providers in the practice, compared with an average of 4.5 providers for the non-MRI practices (p < .01). Indeed, more than half of the non-MRI practices had only one MRI-authorized provider. In terms of practice setting, MRI practices were more likely to be private multiple orthopedic surgeon clinics (80.5 percent) compared with non-MRI practices (48.2 percent), and less likely to be private solo orthopedic practices (1.3 percent) compared with non-MRI practices (18.6 percent).
However, differences in payer mix across MRI and non-MRI practices are relatively modest. Higher percentages of non-MRI practices report both zero Medicare revenue shares (6.6 percent) and Medicare revenue shares in excess of 40 percent (26.5 percent) compared with MRI practices (1.0 percent and 15.1 percent, respectively). Non-MRI practices were more likely to not report their Medicare revenue share (7.2 percent) compared with MRI practices (zero). On average, MRI practices received a greater share of revenue from commercial insurance (48.0 percent) compared with non-MRI practices (40.8 percent).
In terms of geographic location, MRI practices in the survey sample are more likely to be located in the South (40.9 percent) and less likely to be located in the Northeast (11.4 percent) compared with non-MRI practices (32.6 percent and 18.6 percent, respectively). When compared with the 2012 AAOS Orthopedic Surgeon Census (9), the 740 practices responding to the survey generally were geographically representative of the practice population, with some exceptions: practices in North Carolina and Washington are overrepresented, and practices in Michigan and New York are underrepresented in the survey sample (see the appendix).
Practices with Onsite MRI Services
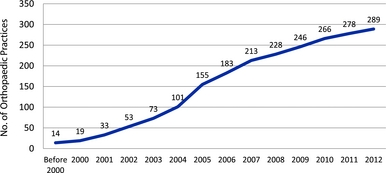
Survey respondents were asked to provide the date when their practice first began to offer onsite MRI services. Practices with more than one onsite MRI reported initial dates for each type of MRI service (e.g., extremity or full-body scans). Nine of the 298 practices reporting onsite MRI capacity did not report any MRI acquisition dates. Using the date of the first onsite MRI service offering for each of the 289 practices reporting acquisition dates, the time-path of MRI acquisition is illustrated in Figure 1.
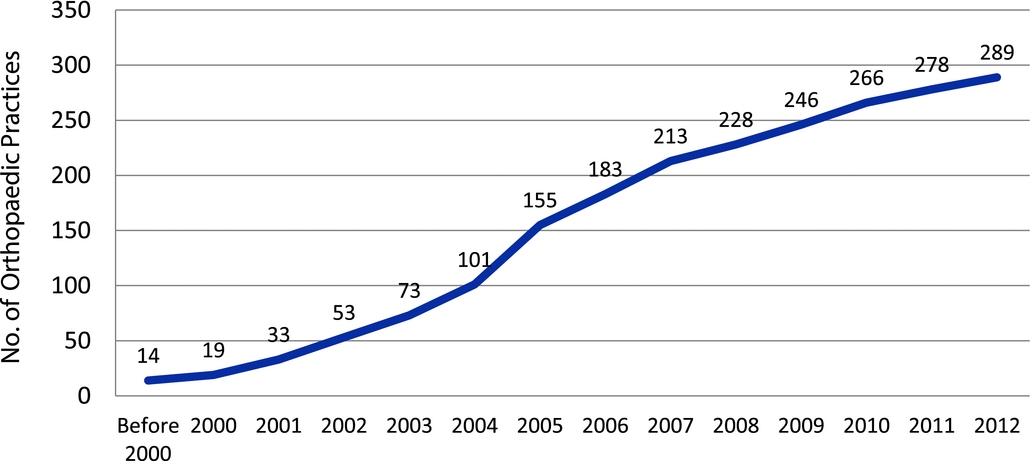
Figure 1. The time-path of MRI acquisition.
The earliest date of onsite MRI service initiation in the survey sample was 1970, but all of the remaining initiation dates reported in the survey sample were for the year 1995 or after. A total of fourteen practices reported onsite MRI services beginning before 2000; by 2004 the total had increased to 101 practices, and by 2007 the total had increased to 213. The most rapid expansion of onsite MRI service availability in the survey sample within the time period 2000–12 occurred from 2004–07, where an average of 35 practices per year acquired initial onsite MRI capability (fifty-four practices in 2005 alone). Eleven practices in the survey sample began to offer onsite MRI services during approximately the first half of 2012 (most survey responses were submitted during July and August 2012), compared with twelve practices during the full year of 2011.
In terms of practice locations for the survey practices reporting onsite MRI capacity, as might be expected, more of the MRI practices in the survey sample tend to be located in more populous states (California, Texas, Florida) with none or few MRI practices in sparsely populated states (Wyoming, North Dakota, Maine), but the pattern does not consistently follow state population, as shown in Figure 2.
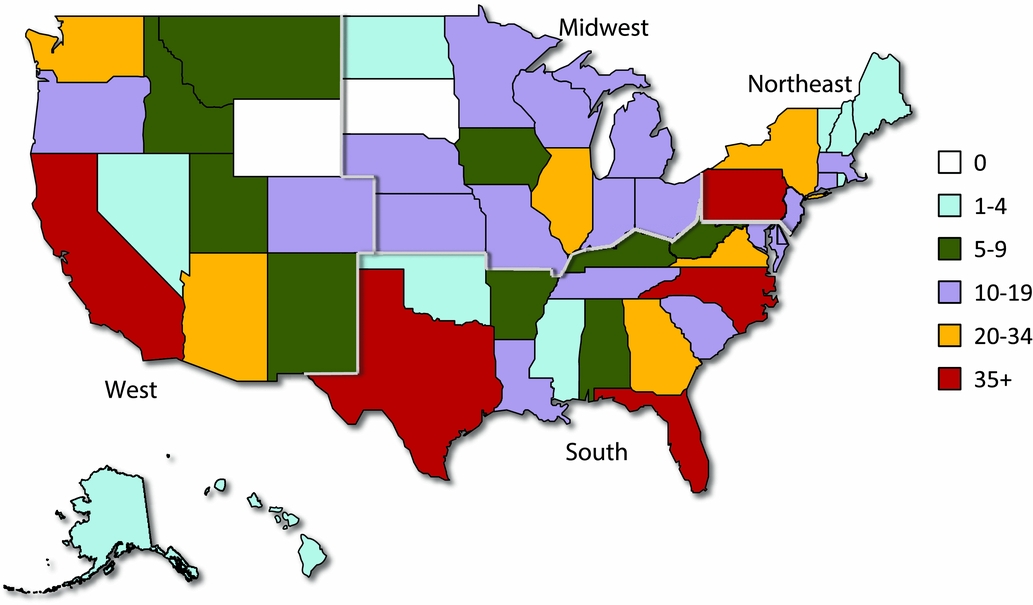
Figure 2. Survey practices reporting onsite MRI capacity.
Factors Influencing Onsite MRI Acquisition
To investigate practice characteristics and other factors associated with the acquisition of onsite MRI capacity, we use a multivariate logistic regression model to predict the likelihood on acquiring onsite MRI capacity given specific practice characteristics including geographic location (Reference Long and Freese10). All models were estimated using Stata Version 13 (11). Results for three multivariate model specifications are reported in Table 2. Column 1 of Table 1 reports results for a model using only practice size (number of providers) as a predictor for the likelihood of onsite MRI acquisition. In column 2, practice setting is added to practice size as predictors, and in column 3, practice location (region) and county-level area characteristics are added to the model specification.
Table 2. Logistic Regression Model Estimates of Factors Associated with Practice Acquisition of Onsite MRI Capacity [N = 740]

Source: AAOS Survey Data, 2012; Area Health Resources Files (various years).
The logistic model results indicate that practice size (defined as number of physicians or other providers authorized to order an MRI exam affiliated with the practice) had a substantial impact on the likelihood of onsite MRI acquisition among the AAOS survey respondents. Specifically, practices with more than ten providers were 8.7 to 10.8 times more likely to acquire an onsite MRI compared with practices with less than three providers (p < .01). Similarly, practices with six to ten providers were approximately 4.5 times more likely to acquire an onsite MRI compared with practices with less than three providers (p < .01). The type of practice organization or setting also influenced the likelihood of onsite MRI acquisition. Orthopedic surgery specialty practices (consisting of more than 1 orthopedic surgeon) were 7.3 times more likely to acquire an onsite MRI compared with providers in “other” practice settings, a reference category including solo practice or hospital-based practice (p < .01). In contrast, geographic region and county-level characteristics of the practice location did not appear to have had any substantial influence on the likelihood of onsite MRI acquisition among the sample of practices in the AAOS survey data.
DISCUSSION
Among the 740 AAOS orthopedic practice survey respondents, a total of 298 (40 percent) reported offering onsite MRI services. This suggests that the majority of orthopedic practices did not have onsite MRI capacity as of mid-2012. However, because orthopedic practices with onsite MRIs were much larger than non-MRI practices (in terms of number of providers), a majority of orthopedic surgeons were in practices with an onsite MRI. Nonetheless, a substantial minority of orthopedic surgeons were in practices without an onsite MRI as of mid-2012. The geographic distribution of survey-reported MRI practices generally is consistent with the geographic distribution of the population across states. However, a few states with relatively small populations but with numerous popular ski resorts (Montana, Idaho, Utah) tend to have more MRI practices in the sample than expected given state population, perhaps due to high rates of ski-related orthopedic injuries in those states. Some states with relatively large populations (Massachusetts, New Jersey, Ohio) have relatively few MRI practices in the survey sample, whereas some smaller states have numerous MRI practices in the sample (North Carolina).
Given that the Stark Laws only apply to patients covered by Medicare or Medicaid, the payer mix for a practice might be expected to influence the decision to acquire onsite MRI capacity. However, as reported in Table 1, differences in payer mix for MRI and non-MRI practices were relatively modest. The mean of the reported Medicare payer share was almost identical for MRI and non-MRI practices in the sample, but with a greater variance for non-MRI practices. The mean reported Medicaid revenue share was greater for non-MRI practices comparted to MRI practices (8 percent and 5 percent, respectively), whereas MRI practices reported a higher share of revenue from privately insured patients. Thus, it does not appear likely that practices acquiring onsite MRI capacity did so to take advantage of the IOAS exception given large Medicare and Medicaid practice revenue shares.
The relatively smooth trend in onsite MRI acquisition over time shown in Figure 1 suggests that onsite MRI acquisition was motived by an organic, evolutionary process, and not by discrete changes in payer payment policy. For example, ongoing enhancements in MRI technology over this period contributed to revisions in authoritative treatment guidelines, which enhanced the role of MRI exams in the evaluation and treatment of many orthopedic conditions (12;13). Similarly, over this time period there was steady growth in the number of physicians in physician practices (Reference Casalino, Pham and Bazzoli14;Reference Kirchhoff15). Together, these factors are likely to have increased the expected volume of use for onsite MRI capacity within many practices, thereby improving the economies of scale for onsite MRI capacity.
Finally, the survey results indicated that, at any particularly point in time, practices with a large number of providers, or many providers likely to use MRI in their practice (e.g., orthopedic specialty practices), were more likely than other types of practices to acquire onsite MRI capacity. This is consistent with factors influencing the classic “make or buy” decision in organizations (Reference Walker and Weber16). Specifically, in practices with providers who are likely to use MRI exams, the practice can reduce transaction costs by “making” MRI exams within the practice (by means of onsite MRI capacity) relative to referring patients to external MRI service providers (i.e., “buying” MRI exams from others).
This fundamental difference between MRI and non-MRI practices also suggests that simple cross-sectional comparisons of MRI volume for MRI and non-MRI practices will be uninformative regarding the magnitude of any causal effect of onsite MRI acquisition on the volume of MRI exams. Specifically, practices likely to acquire onsite MRI capacity would tend to have had a substantially greater volume of MRI exams both before and after MRI acquisition, compared with practices unlikely to acquire an onsite MRI. Thus, a spurious positive association between the presence of onsite MRI capacity and MRI volume is likely in cross-sectional comparisons. Future research assessing the impact of onsite MRI on MRI volume should strive to make use of panel data on practice MRI volume for periods before and after MRI acquisition for MRI practices and for appropriate non-MRI comparison practices over the same period.
LIMITATIONS
This descriptive summary of the AAOS survey data is subject of several limitations. First, the survey response rate was relatively low, and the responding practices may not be representative of all orthopedic practices in the United States. Although the survey sample appears to be representative in terms of the geographic distribution of survey practices, if the sample is not representative of all orthopedic practices in other dimensions, the comparisons of characteristics of MRI and non-MRI practices, and the timing of MRI acquisition reported here, may not be valid indicators for all orthopedic practices.
The MRI practices were asked to list provider characteristics at the time of their first onsite MRI acquisition, whereas the non-MRI practices were ask to list current (2012) provider characteristics. Thus, survey responses relating to practice size are not contemporaneous across MRI and non-MRI practices. If orthopedic practices in general have become larger over the past decade, the survey results could understate differences in practice size for MRI and non-MRI practices, as the non-MRI practices would be likely to have been smaller at the time the MRI practices first acquired an onsite MRI (compared with their size in 2012).
However, for the MRI practices, the survey relied on recall by the survey respondents about the number of providers associated with the practice at the date of the first onsite MRI acquisition. It is possible that MRI practice respondents might have ignored the survey instructions and reported the number of providers associated with the practice at the time of the survey (2012). To the extent this occurred, the practice size of MRI practices at the time of first MRI acquisition could be overstated (given that orthopedic practices generally have become larger over time). Indeed, using the 2012 NPI file to impute practice size for MRI practices regardless of reported MRI acquisition year yields a somewhat larger average practice size compared with the average for the actual survey responses. This suggests that at least some of the MRI practices attempted to follow the survey request to report the number of providers at the time of the first MRI acquisition. Even if many MRI practices reported their current number of providers, the practice size measurement for MRI practices would be more contemporaneous with the timing of measurement for non-MRI practices.
Finally, the results reported here are based on a survey of orthopedic practices located within the United States. Given that the pattern of onsite MRI acquisition over time was undoubtedly affected by specific features of the healthcare system in the United States, the results may not be directly applicable to the patterns of MRI acquisition in countries with very different health system features. A companion analysis to this study, which compared Medicare claims data for physicians in the MRI-acquiring practices before and after the MRI acquisition date to physicians in matched non-MRI practices over the same time period, found no significant differences in the rate of change in MRI usage among Medicare patients (Reference Ohsfeldt, Li and Schneider17). If MRI acquisition primarily affects the site of MRI administration and not overall MRI volume, the overall growth in MRI usage observed over this time period would have been similar without the Stark IOAS exemption, with growth in onsite MRI capacity merely shifted to free-standing facilities. Thus, a possible general implication of our findings is that regulatory efforts to control the modality of use of new technology maybe be relatively ineffective in controlling the overall availability or use of new technology.
CONFLICTS OF INTEREST
Funding for this study was provided by the American Association of Orthopaedic Surgeons. The authors have no other conflicts to report.
Appendix. Geographic Representativeness of AAOS Survey Practices


 Open access