


Introduction
Temperate glaciers are highly effective erosional agents resulting in denudation rates approaching 100 mm a−1 (Hallet and others, Reference Hallet1996). They profoundly affect landscape evolution and sedimentation rates (Hallet and others, Reference Hallet1996; Sternai and others, Reference Sternai, Caricchi, Castelltort and Champagnac2016; Ugelvig and others, Reference Ugelvig S, Egholm and Iverson2016; Ugelvig and Egholm, Reference Ugelvig and Egholm2018), with ancillary effects on processes as diverse as chemical weathering (e.g., Anderson, Reference Anderson2005) and volcanic eruptions (Sternai and others, Reference Sternai, Caricchi, Castelltort and Champagnac2016). The primary processes of glacial erosion are abrasion, the wearing away of underlying bedrock by debris entrained in basal ice, and quarrying (i.e., plucking), the fracturing and removal of bedrock blocks. Quarrying is commonly thought to be responsible for higher denudation rates than abrasion (Hildes and others, Reference Hildes, Clarke, Flowers and Marshall2004; Loso and others, Reference Loso, Anderson and Anderson2004; Riihimaki and others, Reference Riihimaki2005; Zoet and others, Reference Zoet2013). Quarrying rates are difficult to simulate due to the complex mechanisms involved and the difficulty of replicating quarrying in the laboratory. However, initial studies noted that quarrying can generally be divided into three phases (Rӧthlisberger and Iken, Reference Rӧthlisberger and Iken1981; Iverson, Reference Iverson1991). A block must first become isolated from the surrounding bedrock through growth of fractures and their coalescence with preexisting discontinuities. Second, the isolated block must be extracted from its initial location. Finally, the extracted block must be entrained in the ice, thereby completing the erosion process.
Previous studies indicate that quarrying depends on the formation of subglacial cavities that concentrate stresses sufficiently to propagate factures subcritically in the bed (Iverson, Reference Iverson1991, Reference Iverson2012; Hallet, Reference Hallet1996; Cohen and others, Reference Cohen, Hooyer, Iverson, Thomason and Jackson2006; Anderson, Reference Anderson2014). Subglacial cavities reduce the contact area between the ice and bed, thereby increasing normal stress on areas of ice-bed contact and the deviatoric stresses within the bedrock that lead to fracture propagation. Still, the additional normal stress is often insufficient to critically fracture competent rock layers, so slower subcritical fracture growth has been invoked to allow fracture propagation at stresses below the critical rock strength (Atkinson, Reference Atkinson1987; Hallet, Reference Hallet1996). Subcritical crack growth results from weakening of the mineral bonds at crack tips via water, reducing the stresses necessary for fracture growth (Atkinson, Reference Atkinson1987, Reference Atkinson2008).
Although subcritical crack propagation induced by ice loading provides a convenient mechanism for quarrying, fracture patterns expected for glacier-induced subcritical cracks have not consistently been observed in the field. Glacier loading would induce fractures that propagate parallel to the maximum principal stress (σ 1) (perpendicular to the bedrock surface) and laterally extend perpendicular to the ice flow direction (Iverson, Reference Iverson1991). However, Hooyer and others (Reference Hooyer, Cohen and Iverson2012) showed that the strikes of quarried surfaces were independent of sliding direction and were dictated primarily by preexisting discontinuities in the bedrock that were exploited by sliding ice. Thus, cracks likely propagate due to ice loading but exploit pre-existing discontinuities in the rock, rather than initiating them (Iverson, Reference Iverson2012).
Past quarrying models estimate how basal stresses affect fracture growth but do so independent of the complex spatial variations of stress within the rock (Hallet, Reference Hallet1996; Iverson, Reference Iverson2012). To quantify fracture propagation velocities, linear-elastic fracture mechanics (LEFM) are used (Walder and Hallet, Reference Walder and Hallet1985; Jaeger and others, Reference Jaeger, Cook and Zimmerman2007):

V = 0, K I ≤ 0.3K C
V = V s,K I ≥ K C

where V is the fracture propagation velocity, K I is the stress intensity factor of a mode I (opening mode) fracture, K C is rock fracture toughness (i.e., the critical stress intensity above which crack growth is critical),V c and γ are the rock's growth-law parameters determined by plotting V vs $K_{\rm I}^2$ on a log scale once K c is known (Walder and Hallet, Reference Walder and Hallet1985), V s is the critical fracture propagation velocity equal to the shear wave velocity in the rock, c is the crack length and $\sigma _\bot ^\infty$
 is the far-field tensile stress (oriented parallel to the top of the block). Table 1 defines all variables used herein. Importantly, an accurate estimation of K I from Eqn 2 is possible only if stress is uniform (Atkinson, Reference Atkinson1987; Hallet, Reference Hallet1996). If local stress variations are neglected in the estimation of K I from Eqn 2, subglacial fractures can grow without bound under glacier loading (Eqns (1–2)). In most quarrying models, fracture propagation is the rate-limiting process. Thus, to obtain an accurate quarrying rate, a better understanding of how K I varies in a subglacial environment is necessary.
Table 1. Variables used in paper with values prescribed in the results

Here we build on previous efforts to better characterize how geologic structure and subglacial stresses lead to quarrying. First, with photos from drone-base photogrammetry, we map the concentration of fractures in the forefield of Tsanfleuron Glacier, Switzerland, to determine if areas that are dominated by quarrying have a statistically greater concentration of aerially visible discontinuities than abrasion-dominated areas. No statistical correlation is found, suggesting another factor is dictating quarrying at Tsanfleuron. We explore the hypothesis that quarrying may be sensitive to the spacing of bed-parallel discontinuities generally not visible from air. Variation in the bed-parallel discontinuity spacing would likely alter the stress field in the bedrock and reduce the length fractures must travel to isolate a block, causing some areas to be quarried more readily than others. To test this hypothesis, we study fracture propagation dynamics on a subglacial stepped bed by using the COMSOL Multiphysics software to create a finite element model (FEM) to simulate stresses on a fracture propagating normal to the bed. These results provide insight into the bedrock and glacier conditions necessary for quarrying.
Setting
Tsanfleuron Glacier is located in the Rhone Valley of western Switzerland and overrides a 100–120 m thick Cretaceous limestone. In 2000, Tsanfleuron had a surface area of ~4 km2 and an elevation ranging from 2420–2850 m a.s.l. (Hubbard and others, Reference Hubbard, Siegert and McCarroll2000). The exposed bedrock inside the Little Ice Age (LIA) moraine is largely debris free and consists of the Schrattenkalk (German) or Urgonian (French) Limestone (Gremaud and others, Reference Gremaud, Goldscheider, Savoy, Favre and Masson2009; Bover-Arnal and others, Reference Bover-Arnal, Jaramillo-Vogel, Showani and Strasser2011). The limestone of the forefield is folded into an anticline with an axial plunge of ~7° to the ENE that causes dips in the forefield to reach 25° to the SE (Gremaud and others, Reference Gremaud, Goldscheider, Savoy, Favre and Masson2009). Our study sites consist of two ~0.5 km2 areas of the exposed forefield within the Schrattenkalk Limestone, one near the ice margin and the other near the LIA moraine (Fig. 1). The mean ice-flow direction for both study sites was ~90° (i.e. due east) based on striation orientations measured in the field.

Fig. 1. DEMs with hillshading of the Tsanfleuron forefield overlain on 2012 and 2016 DigitalGlobe satellite imagery. Locations of photos with quarried surfaces (yellow dots) and without quarried surfaces (green dots), which were used for the fracture analysis, are also plotted. (a) Broad view of the forefield with the outer limit of the LIA moraine outlined with a black dashed line. The black box shows the location of (b). (b) Expanded portion of the forefield with inset photos that show examples of traced discontinuities in four photos.
Methods
Discontinuity concentration
Aerial discontinuity concentrations within the forefield were determined using scaled photos to manually map discontinuities in the bedrock. Discontinuities were defined as any mappable break in the rock mass and consist of bedding planes, fractures or faults. Photos were collected from an unmanned aerial vehicle (UAV) that was fitted with a one-inch, 20-megapixel CMOS camera and F2.8 wide-angle lens with a 9 mm focal length, and was flown at an altitude of ~50 m above the rock surface. The UAV was capable of adjusting its flight altitude to maintain a uniform distance from the ground while collecting photos oriented perpendicular to the ground-surface. Digital elevation models (DEM) produced from the photos (via structure-from-motion) were used to scale the photos. DEMs were scaled by placing ground control points throughout the forefield with their positions precisely measured using an APS-3 RTK GPS system (0.01 m + 1 ppm), resulting in a DEM total error of ~ 0.1 m. The spatial resolution of each photo was determined by using six points common to the photo and DEM and then calculating the average of the 15 distance combinations between the points. Scaled photos and DEMs were produced for two sections of the forefield, an ice-proximal and an ice-distal section (Fig. 1). Root mean square (RMS)-roughness of the ice-proximal section of the forefield was substantially higher (8.5 m) than the ice-distal section (2.9 m), indicating a higher degree of quarrying in the ice-proximal section than in the ice-distal section (see Appendix A). Specific photos of rocks were selected that were clear of debris, showed clear quarrying surfaces (for quarried zones) or a lack of quarried surfaces (abraded zones), and best represented the fracture patterns of the area (Fig. 1). To assure only inherent discontinuities in the bedrock were included in our analysis, quarried surfaces were not mapped. Rather, fracture concentrations for the quarried zones were measured on unquarried rock immediately adjacent to the quarried zone, and aerial fracture concentrations were assumed similar between the quarried and immediately adjacent surfaces.
Discontinuities were manually mapped and analyzed using the methodology and code of Crompton and others (Reference Crompton, Flowers and Stead2018). A sampling window that captures the general trends of the whole photo was divided into expanded subsections to allow more detailed mapping of the photo area. Metrics used to determine the concentration of discontinuities were linear intensity (P 10), aerial intensity (P 21), aerial density (P 20), intersection density (I 20) and the ratio of minimum and maximum frequency (RMMF or max P 10/min P 10; Table 2). For a more detailed explanation of these metrics see Crompton and others (Reference Crompton, Flowers and Stead2018). A pairwise Tukey honest significant difference (HSD) test (α = 0.05), which is a conservative pairwise test that compares all possible pairs of means of the discontinuity metrics (Dowdy and others, Reference Dowdy, Wearden and Chilko2011), was used to test the null hypothesis that the quarried and nonquarried zone metrics were statistically similar.
Table 2. Discontinuity metric symbology, name, description and p-values from the HSD test. All p-values indicate that there is no significant difference in discontinuity concentrations in quarried and nonquarried areas

Fracture growth
To estimate the stresses on a bed-normal crack tip within a stepped bed and thereby model how a crack might propagate, we used the FEM package COMSOL. The COMSOL software package provides a platform with an array of predefined physics interfaces that are capable of simulating fracture dynamics in the subglacial environment. Indirect estimates of how tensile stresses at the crack tip might change as it extends downward cannot be used with traditional LEFM because the expression for K I (Eqn 2) is predicated on a uniform far-field tensile stress that does not change with crack length. Hence, this approach does not take into account either changes in tensile stress as cracks extend to greater depth or variations in rock geometry that might affect fracture growth. To overcome these limitations and to account for how stress singularities at the crack tip modify the local stress field and affect stress propagation, K I was estimated using the J-integral (Rice, Reference Rice1968) by determining the strain energy release rate for a growing crack.
The J-integral is a 2-D, path-independent line integral along contour Γ around the crack tip and is defined as

where σ ij and u are the stress and displacement components, n i is the normal vector component along Γ (σ ijn i is often defined as the traction vector), ε ij is the infinitesimal strain tensor, s is the arc length of Γ and W is the strain energy density (Rice, Reference Rice1968; Atkinson, Reference Atkinson1987)

For a plane stress configuration in a linear elastic material the J-integral is related to K I by

where E is Young's modulus. Equations (3–5) allow the computation of K I as a crack grows and affects local stresses acting on it. For a detailed explanation on the J-integral, see Rice (Reference Rice1968).
The J-integral was estimated in COMSOL after a FEM domain was constructed that replicated the stress regime of a stepped bed with subglacial cavities, partial ice-bed contact and a preexisting crack (Fig. 2). The geometry of the models consisted of a vertical step with heights of 1 or 2 m and a 5 m horizontal ledge on both sides of the step. An initial bed-normal crack 0.15 m long was considered 1 m from the step edge at the point of ice-bed reattachment. The crack was 1 mm wide at the surface and linearly tapered to single point, to mimic the geometry of an embedded crack. In order to maximize the deviatoric stresses that lead to fracture growth, we simulate a condition of low P w in a large subglacial cavity by applying a normal stress (σ n) to the area bounded by the crack and step edge, and no stresses on the rest of the ledge. The position of the crack relative to the ice-bed contact was chosen to produce the highest tensile stresses near the crack tip (Hetényi, Reference Hetényi1960; Hallet, Reference Hallet1996). Rectangle and circle paths, Γ, were created around the crack tip as integration contours to determine the J-integral (Fig. 2). The crack length was incrementally extended by 1 and 2 cm for the 1 and 2 m step height simulations, respectively, until the crack extended to the depth of the ledge's base.
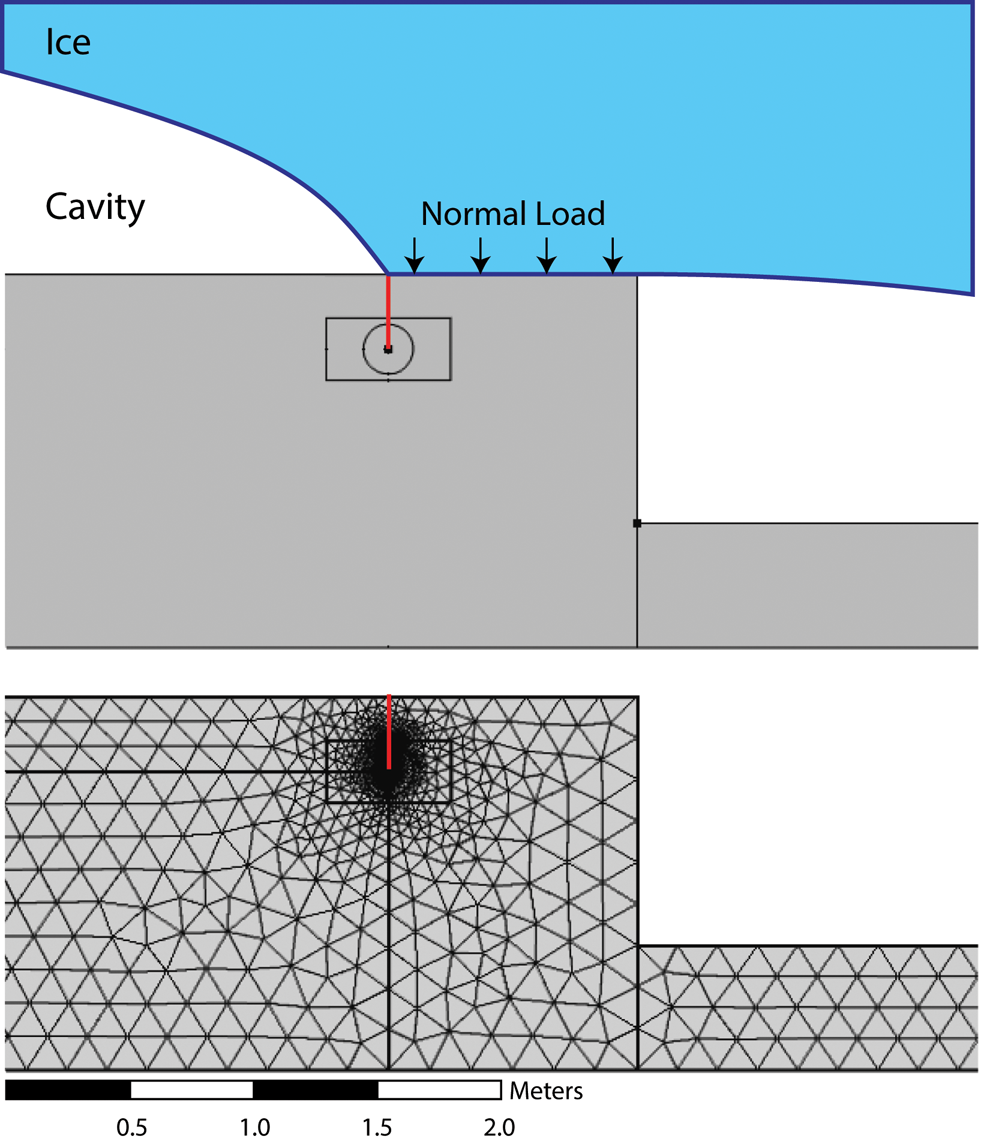
Fig. 2. FEM geometry and mesh used in the fracture-growth simulations. The red line shows the location of the fracture. The circle and rectangle around the crack tip are the paths of integration (Γ) used to calculate the J-integral. Water pressure in cavities is assumed to be zero to maximize the deviatoric stresses on the crack.
Results
Discontinuity concentration
Statistical comparison of the aerial discontinuity concentrations in the Tsanfleuron forefield indicates that the quarried zones are not statistically different from nonquarried zones. A total of 14 different zones of the forefield were analyzed, seven located in quarried areas and seven in nonquarried areas (Fig. 1). All p-values from the Tukey HSD test are greater than 0.3 (Table 2) indicating that aerially visible discontinuities alone are unlikely to have been the controlling factor in determining if an area was dominated by quarrying or abrasion.
Fracture growth
The FEM analysis reveals that stress intensities at the crack tip decline as the crack grows downward and that small variations in σ n associated with changes in water pressure (e.g. Anderson, Reference Anderson2014) can cause highly variable fracture-growth dynamics. Figure 3 shows the Von Mises stress distribution on the stepped bed with an applied normal load of 5 MPa and illustrates that the highest stress is at the crack tip (note that stress range was limited to 10 MPa due to the stress singularity). Von Mises stress is a theoretical measure used to estimate the stresses necessary for a material to yield (see Jaeger and others, Reference Jaeger, Cook and Zimmerman2007). Figure 4 shows the stress intensity factors (or (J · E)1/2) from the FEM for a 1 and 2 m step height with σ n on the block varying from 1 to 5 MPa (solid lines). The fracture toughness (K c, dotted line) and the threshold for subcritical crack growth (K c/3, dash-dotted line) for Balmholtz limestone (Atkinson, Reference Atkinson1987) are plotted for reference. Typical values for fracture toughness of rock range from 0.3 to 3.7 (Atkinson, Reference Atkinson1987). The K Ivalues from Eqn 2 with $\sigma _\bot ^\infty \, = \,2\sigma _n/3$ as used by Hallet (Reference Hallet1996) are also plotted (dashed lines) for reference. For the 1 m step simulation, the maximum stress intensity is located near the ice-bed contact, whereas in the 2 m step simulation stress peaks at ~ 0.4 m depth and then, importantly, begins to decrease with depth. In all simulations, higher σ n values at the surface increase the overall K I, but the effect is amplified for the larger step height (Fig. 4). As the crack tip approaches the level of the base of the step, K I values in both simulations converge to approximately the same value, suggesting the stress regime is the same at that point regardless of step height. The stresses at the crack tip approach the limestone's critical level if σ n >3 MPa and >2 MPa for the 1 and 2 m step height simulations, respectively. We calculate greater K I values than did Hallet (Reference Hallet1996) near the ice–bed interface, but at depth this monotonically increasing K I values exceed the declining K I values of this study (Fig. 4).
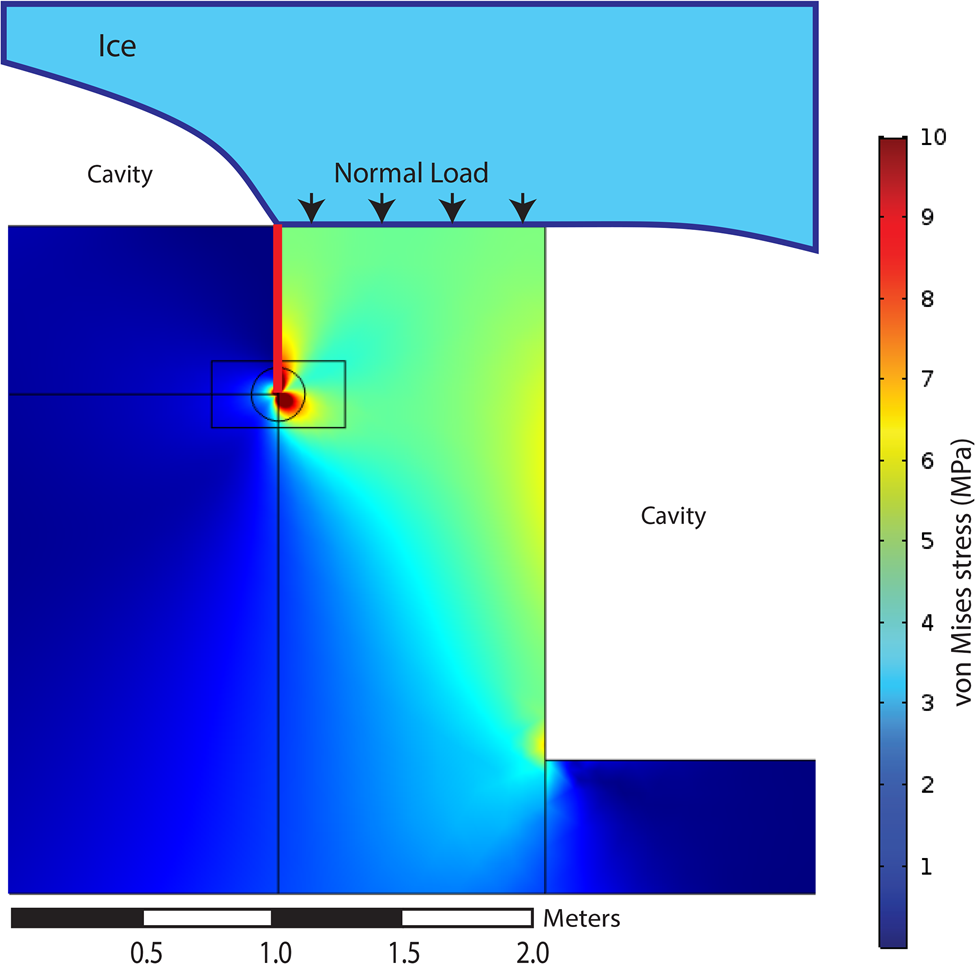
Fig. 3. Von Mises stress from an applied normal load on a step. The stress range was limited to 10 MPa to illustrate the distribution of stresses throughout the bed due to the stress singularity at the crack tip. The red line shows the location of the fracture. The circle and square around the crack tip are the paths of integration (Γ) used to calculate the J-integral.

Fig. 4. Stress intensity (K I) values for FEM simulations with step heights of 1 and 2 m. Solid lines show K I values from the FEM simulations at variable applied normal stresses (σ n) on the top of the block. Dashed lines are the values based on Eqn 2 and the correction factor 0.66 used by Hallet (Reference Hallet1996) to convert applied normal stresses to far-field tensile stresses. The dotted line is the fracture toughness (K c) value for Balmholtz limestone. The dot-dashed line is the threshold for subcritical crack growth (K c/3).
Discussion
If aerially visible fractures are not the controlling factor for quarrying at Tsanfleuron, perhaps the spacing of bed-parallel discontinuities, such as bedding planes, are more important for controlling quarrying. FEM results indicate that lower σ n values are needed for bed-normal fracture propagation in the 2 m step simulation compared to the 1 m step simulation, and thus bed-normal fractures in thicker beds can propagate more readily under equal stress conditions (Fig. 4). For example, if we assume the normal stress acting on the bed is 3 MPa (blue line Fig. 4), the fracture in the 2 m step will fail critically (V = V s) until $c\to$ 1.4 m, after which it will continue to propagate subcritically at a reduced velocity (Eqn 1). In contrast, the 1 m step will never critically fail but will stay in the subcritical regime in which velocities are much smaller than critical velocities. The reason for this variation with a step height is likely due to the buttressing effect of the lower step inhibiting crack growth below that depth, coupled with the potential for longer cracks in the 2 m step to focus more stress at the crack tip. The ledge of the lower step would reduce the tensile stress as the crack approaches the level of the base of the step, which explains why K I values are similar at the base of the steps for both step heights, while increased crack length would lead to increased K I. Consequently, under equal loading conditions, thicker beds (larger steps) would facilitate fracture propagation and quarrying rates and could be a possible explanation for the observed spatial variability of quarried areas where fracture concentrations are statistically similar.
The traditional equations for determining K I in LEFM are not suitable for the complex stress regimes associated with quarrying. As stated by Atkinson (Reference Atkinson1987), ‘application to real rock mechanics problems of the concepts and theories [of crack initiation and propagation] will almost always require the use of the computer and a numerical method such as finite or boundary elements.’ Figure 4 shows that K I values determined from Eqn 2 will result in an increase in calculated stress at the tip of the crack as it grows that will lead to exaggerated fracture velocities (Eqn 1) and runaway crack growth. In contrast, FEM simulations of this study demonstrate that after an increase in K I during initial crack growth, K I values decrease, potentially halting growth of a fracture once it has extended sufficiently far from the bed surface, the exact opposite of the LEFM analysis. Precise estimates of K I are necessary for determining the rates of quarrying, owing to the high sensitivity of V to K I.
Inherent bedrock properties (i.e., discontinuity orientation, length and spacing etc.) play important roles in determining if rock will quarry (Hooyer and others, Reference Hooyer, Cohen and Iverson2012). The K c value of a rock dictates the depth to which a fracture could propagate for a given applied stress (Fig. 4). Assuming that crack growth rate limits the quarrying rate, lower K c values increase fracture propagation rates and maximum penetration depths, accelerating quarrying, whereas high K c values inhibit it. Pre-existing bed-parallel discontinuities are necessary for the extraction phase of quarrying, while preexisting bed-normally oriented fractures are required for bed-normal fracture propagation from ice-induced tensile stresses.
The FEM results suggest that the spatial variation in quarrying prominence observed at Tsanfleuron without an associated change in concentrations of aerial discontinuities could be due to a difference in the spacing of bed-parallel discontinuities. Under the conditions explored with the FEM, greater step heights (i.e., bed-parallel discontinuity spacing) would facilitate critical crack growth for much of the step height (see 3 MPa example in Fig. 4), allowing blocks to be isolated from the intact bedrock relatively quickly. In contrast, smaller step heights would cause bed-normal fractures to propagate subcritically or remain static (Eqns (1–2)), potentially preventing the fractures from reaching the bed-parallel discontinuities, or isolating the block, within the time frame of glacial coverage. It follows that if the ice-proximal region of the forefield has thicker bedding compared to the ice-distal region, thicker beds would enable accelerated fracture propagation and quarrying without a higher concentration of aerial discontinuities. This provides a plausible explanation for the increased degree of quarrying in the ice-proximal region of the forefield compared to the ice-distal region.
Conclusion
In the Tsanfleuron forefield, the concentration of aerial discontinuities is not statistically different in quarried and nonquarried areas. To explore why, we analyze how spacings and orientations of bedrock discontinuities oriented parallel to the bed might affect the quarrying process. FEM results show that taller steps lead to higher fracture propagation rates compared to smaller steps, hence the step size may be an important control on quarrying. These results suggest that fracture growth is facilitated by larger step sizes and exploits pre-existing discontinuities in the bedrock. Future work should explore with the FEM model how proximity of a fracture to the step edge will change the stress field at the crack tip, and consequently, propagation rates of bed-normal fractures. In addition, the development of an analytical or empirical equation for determining K I based on the bed geometry would allow easier implementation of these results into erosion models.
Acknowledgements
We acknowledge funding support for this work was provided by the US National Science Foundation Division of Earth Sciences Program grant EAR166104 to NRI and LKZ. We thank B. Hallet and H. Sone for their helpful discussions. We also thank the reviewers for their valuable comments.
Appendix A
Roughness
To quantitatively distinguish quarried and abraded zones we measure the 2-D RMS roughness (R) values of the upper and lower sections of the forefield shown in Figure 1. Heavily quarried areas will have a higher Rvalue compared to abraded areas. R is calculated on the detrended forefield elevation data that have been oriented so the mean ice flow direction is across the x-axis, z(x, y). The surface data consist of N x × N y measurements spaced at even intervals (Δx, Δy) by taking the integral of the window-normalized discrete power density spectrum (Press and others, Reference Press, Flannery, Teukolsky and Vetterling1986; Perron and others, Reference Perron, Kirchner and Dietrich2008; Jacobs and others, Reference Jacobs, Junge and Pastewka2017)


where k x and k y are wavenumbers along the x and y axes of the topographic section, m and n are indices of the z array, W h is the Hann window function and Z is the discrete 2D-fast Fourier transform (Cooley and Tukey, Reference Cooley and Tukey1965). Note that mΔx = x and nΔy = y. Window normalization of the detrended surface data is necessary because the Fourier transform assumes the input surface is periodic. Otherwise the resulting power spectrum becomes contaminated (Priestley, Reference Priestley1981; Press and others, Reference Press, Flannery, Teukolsky and Vetterling1986). The spectral roughness is equivalent to the variance, or integral divided by the area, of the detrended elevation data z. The RMS roughness of the upper section was 8.5 m, whereas the lower section had a value of 2.9 m, suggesting that the degree of quarrying is higher in the ice-proximal section of the forefield compared to the ice-distal section.


 Open access