The Wilkins Ice Shelf, Antarctica, has experienced a series of break-up events during the first half of 2008, the first on 28/29 February, the second on 30/31 May and the most recent in June/July. The ice shelf (area ∼13 000 km2) experienced the first two break-up events on the connection of the central part of the ice shelf with two confining islands, Latady and Charcot islands. The June/July break-up started in a region where an area of ∼1100 km2 had already broken off in 1998. After the 1998 event, the icebergs were not transported out of the bay; rather, an ice melange formed, composed of icebergs and sea ice. Figure 1a (dated 2 March) shows the northern part of the Wilkins Ice Shelf and the location of the melange.
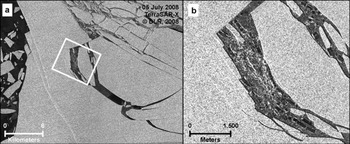
Fig. 1. (a) Envisat ASAR image from 2 March 2008. The white curve illustrates the area of the ice melange. The grey dotted curve displays the western ice front on 16 June 2008. (b) ASAR image from 3 July 2008, at the end of the first phase of the June/July breakup. The inset displays an image in high-resolution TerraSAR-X3 31 strip-map mode, pixel size 3 m × 3 m, from 25 June 2008 with a newly formed fracture. (c) TerraSAR-X scansar wide-swath image from 0850 h, 5 July 2008. The inset displays an Envisat ASAR image from 1240 h, 4 July 2008, showing the beginning of the second phase of the break-up. Copyright proprietors: European Space Agency (ESA); Deutsches Zentrum für Luft und Raumfahrt (DLR).
The June/July break-up occurred in two phases: in the first, the ice melange opened at its northwestern margin and pushed against the northernmost part of the northern ice front, which then broke off. The formation of an iceberg in the interior, followed by a disintegration caused by a capsize mechanism, pushed towards the north and initiated a second phase. A total of 1220 ± 75 km2, or 8.8–10% of its total size, was lost.
In the first phase the melange exhibited an area of open water (Envisat Advanced Synthetic Aperture Radar (ASAR) image, 28 June), while it was still in good order on 26 June. We observe a movement of the melange towards the east, causing fracturing and displacement. There is no visible indication that parts of the melange have melted. In the subsequent 3 days, 70% of the ice melange disintegrated into pieces of thin ice and thicker iceberg fragments (originated from the 1998 break-up). The eastward movement of the melange acted as a force on the northern ice front. The northernmost 30 km of the ice shelf was already fractured during the 1998 break-up event, so that it consisted of rectangular blocks (2–4 km long, 10–30 km wide), all connected on the eastern side to an unfragmented ice-shelf area (Fig. 1a). The acting force on this mass presumably caused the blocks to fracture. During that phase, 540 ± 75 km2 (only ice-shelf ice counted, no melange ice) were lost and an intermediate northern ice front was formed. South of this line, the ice shelf was, up to that date, unaffected. This phase was comparable to (fast) calving rather than to ice-shelf break-up (timescale of hours).
The second phase started on 4 July, when the formation of an iceberg took place 15 km inward of the intermediate ice front. Prior to this (first detected on 24 June), a 6.25 km long rift (inset in Fig. 1b) in the connection between Charcot and Latady islands appeared. The rift was perpendicular to the northern ice front of this ice bridge. It occurred in an area where the estimated ice thickness (Reference Braun, Humbert and MollBraun and others, 2008) drops from ∼240 to ∼180 m normal to the ice front, causing variations in buoyancy forces, which leads to the accumulation of bending stresses. The shape of the fracture, starting at the margin of the ice front, propagating inward and stopping, leads us to assume that tensile stresses are responsible for the rift formation. There were two potential sources for tensile stresses. The first was the predominant wind direction – north-northeast (visible wind erosion structures), which acted as a drag (movement of the sea ice along the northern ice front indicates strong wind at that time). Secondly, the ice melange might have already been moving and a strong contact between the melange and the ice-shelf front could then have produced a tensile stress along the ice-shelf front. The latter can be excluded, since German X-band high-resolution synthetic aperture radar (TerraSAR-X) strip-map mode images from 19 and 25 June show that there was no displacement of the constituents of the melange.
For 9 days following 25 June, the ice-shelf geometry remained stable, although the melange had already started its disintegration. On 4 July an iceberg formation at the rift started (inset, Fig. 1c). Load rearrangement due to mass loss in the first phase and tidal interaction at the intermediate northern ice front may have supported this iceberg formation. A TerraSAR-X scansar image from 5 July (Fig. 2) indicates, only ∼12 hours later, the formation of a second, smaller iceberg and a rapid increase in area between the two icebergs by ∼20 km2. Figure 2b reveals formation of ‘sliver’ icebergs and capsized icebergs, as well as a crushed ice mass. The capsized icebergs are clearly visible as dark blocks in this image. Comparing Figures 2a and 1c reveals a burst-like signature of the event. Hence, we infer that a capsize mechanism has taken place and the large iceberg is ‘explosively’ pushed outwards. The capsize mechanism (Reference MacAyeal, Scambos, Hulbe and FahnestockMacAyeal and others, 2003) forces fragments of ice-shelf ice to capsize as a consequence of flotation instability due to the fragment geometry. The area after capsizing is significantly larger than the unfragmented area. Thus, this mechanism pushes ice in front of the turning iceberg (1.1 km in ≤20 hours), as can be seen in Figure 1c. In this second phase, 680 km2 of ice-shelf ice broke apart and the ice melange has completely disappeared (not shown here).

Fig. 2. (a) TerraSAR-X scansar image from 0105 h, 5 July 2008, displaying the same area as the insets of Figure 1b and c. (b) The capsizing icebergs are apparent as dark blocks between the still-floating icebergs and crushed ice.
The origin of the second break-up phase is located in an area already mechanically weakened by fractures and failure zones. Reference Braun, Humbert and MollBraun and others (2008) have shown that since the early 1990s, failure zones have developed in connection with break-up events, even at large distances (e.g. 65 km) from the break-up area. These failure zones are visible in Figure 1a. Comparison with Figure 1c shows that the disintegration occurred along these failure zones. All identified failure zones discussed by Reference Braun, Humbert and MollBraun and others (2008) could now be assigned to iceberg formation. This shows that the structures and associated processes identified as failure zones by Reference Braun, Humbert and MollBraun and others (2008) utilizing time series of radar and multispectral satellite images are indeed lines where the ice-shelf break-up is eased due to mechanical weakness.
The highly complex pattern of fracturing of the Wilkins Ice Shelf prior to and during the 2008 break-up events renders the detection of the weakest link very difficult. Thus, prediction of where and when the next step in the break-up might occur is impossible. Based on the current state of the ice shelf, two scenarios seem to be reasonable: (1) formation of a new melange imminently (during the 2008 austral winter) or (2) further break-up until a new equilibrium is reached with a projected mass loss of up to 2100 km2 (Reference Braun, Humbert and MollBraun and others, 2008).
The close observation of these events by satellite from different space agencies is the key to examining the causes and triggers of break-up events. Although they are a very powerful tool, we clearly see that the lack of in situ observations of quantities like deformation rates prior to the break-up events makes it much more difficult, if not impossible, to derive a completely unambiguous explanation.
13 September 2008